
Gas Turbine Configurations and Heat Cycles
Abstract
When defining heat cycles, one needs to determine which fluid (air, fuel, hot gases, injected fluid, heat exchanger flows) is flowing where and how. This information helps define the gas turbine’s configuration and efficiency. For high-flight Mach number applications, an afterburner is often employed, which offers higher thrust from the same turbomachinery. This, also called reheat, involves burning fuel in an additional combustor downstream of the jet pipe. The greatly increased exhaust temperature provides a far higher jet velocity, and the ratios of engine thrust to weight and thrust to unit frontal area are greatly increased. This chapter covers various gas turbine configurations and heat cycles as well as steam power plant theory, combined-cycle economics, supercritical systems and various case studies.
Keywords
Steam power plant theory; supercritical systems; power generation gas turbine; ramjet; combined-cycle economics; afterburner; gas turbine configurations
“Every child is an artist. The problem is how to remain an artist once he grows up.”
—Pablo Picasso
When defining heat cycles, one needs to specify the reference engine stations or the positions used for the pressure and temperature measurements that will detail the heat cycle. One also needs to define the flow of that cycle in its simplest terms: In other words, which fluid (air, fuel, hot gases, injected fluid, heat exchanger flows) is flowing where and how. This information helps define the gas turbine’s configuration and efficiency.
Gas Turbine Configurations
The following description1 of main configurations for gas turbine engines does not mention “land, sea, or air.” Some of them, for instance “conventional turbojet,” obviously refer to an aeroengine application. However, a “simple-cycle, free-power turbine engine” can be land (mechanical drive), sea (propulsion), or air (turboprop, helicopter) based.
Figure 3–1(a) shows a conventional single-spool turbojet above the center line and one with the addition of an afterburner, convergent-divergent (con-di) intake, and con-di nozzle.
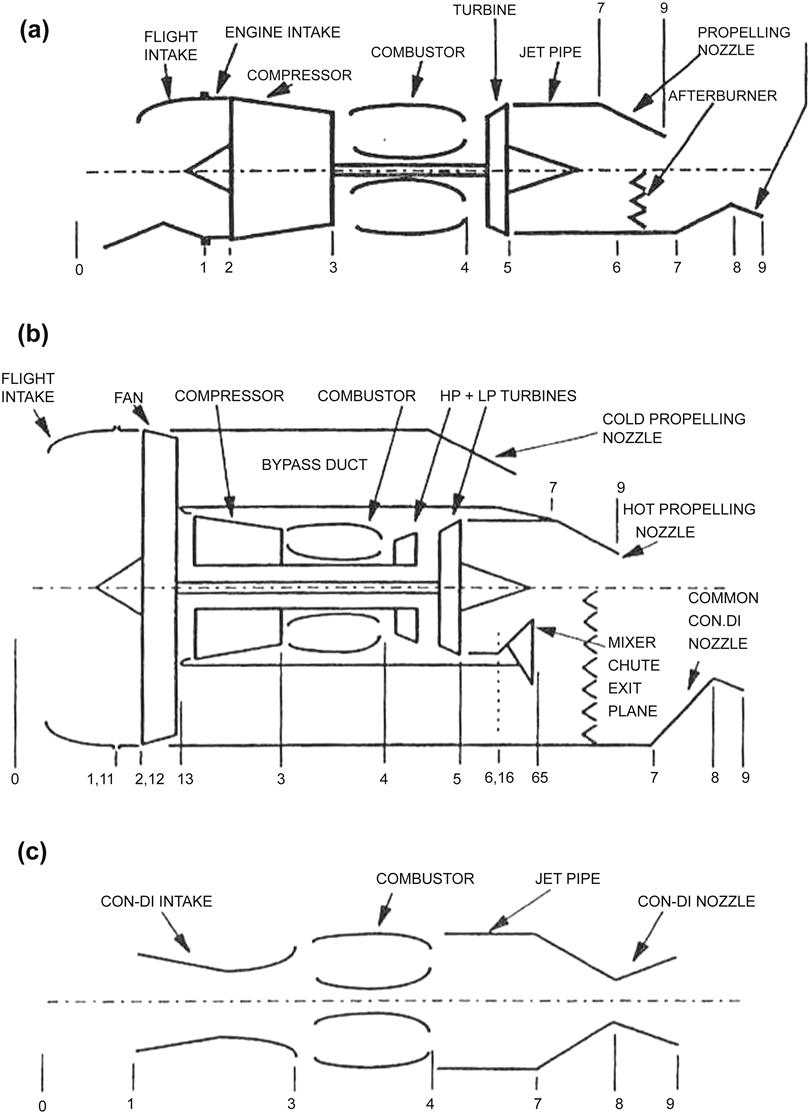
Ambient air passes from free stream to the flight intake leading edge. The air accelerates from the free stream if the engine is static, whereas at high flight Mach numbers, it diffuses from the free stream, ram conditions. Usually, it then diffuses in the flight intake before passing through the engine intake to the compressor face, resulting in a small loss in total pressure.
The compressor then increases both the pressure and temperature of the gas. Work input is required to achieve the pressure ratio; the associated temperature rise depends on efficiency level. Depending on the complexity, the turbojet compressor pressure ratio ranges from 4:1 up to 25:1.
The compressor exit diffuser passes the air to the combustor. Here, fuel is injected and burned to raise exit gas temperature to between approximately 1200 K and 2000 K, depending on the engine technology level. Both the diffuser and combustor impose a small total pressure loss.
The hot, high-pressure gas then is expanded through the turbine, where work is extracted to produce shaft power; both temperature and pressure are reduced. The shaft power is required to drive the compressor and any engine and “customer” auxiliaries and to overcome engine mechanical losses such as disc windage and bearing friction. The turbine nozzle guide vanes and blades often are cooled to ensure acceptable metal temperatures at elevated gas temperatures. This utilizes relatively cool air from the compression system, which bypasses the combustor via air system flow paths that feed highly complex internal cooling passages within the vanes and blades.
On leaving the turbine, the gas still is at a pressure typically at least twice that of ambient. This results from the higher inlet temperature to the turbine and the fundamental form of the temperature–entropy (T–S) diagram.
Downstream of the turbine, the gas diffuses in the jet pipe. This short duct transforms the flow path from annular to a full circle at entry to the propelling nozzle. The jet pipe imposes a small total pressure loss. The propelling nozzle is a convergent duct that accelerates the flow to provide the high-velocity jet to create the thrust. If the available expansion ratio is less than the choking value, the static pressure in the exit plane of the nozzle will be ambient. If it is greater than the choking value, the Mach number at the nozzle will be unity (i.e., sonic conditions), the static pressure will be greater than ambient, and shock waves will occur downstream. In the latter instance, the higher static pressure at nozzle exit plane relative to the intake creates thrust additional to that of the jet momentum.
In a two-spool engine there are both low-pressure (LP) and high-pressure (HP) compressors driven by LP and HP turbines. Each spool has a different rotational speed, with the LP shaft inside of and concentric to that of the HP spool. If the spool gas paths are at different radii, this arrangement necessitates short intercompressor and interturbine ducts, which incur small total pressure losses.
Turbojet with Afterburner and Convergent-Divergent Nozzle (Figure 3–1[a])
For high-flight Mach number applications, an afterburner is often employed, which offers higher thrust from the same turbomachinery. This, also called reheat, involves burning fuel in an additional combustor downstream of the jet pipe. The greatly increased exhaust temperature provides a far higher jet velocity, and the ratios of engine thrust to weight and thrust to unit frontal area are greatly increased.
To enable the jet efflux to be supersonic, and hence achieve the full benefit of the afterburner, a convergent-divergent nozzle may be employed. A nozzle downstream of an afterburner must be of variable area to avoid compressor surge problems due to the increased back pressure on the engine when the afterburner is lit. Usually, for engines utilized in this high flight Mach number regime, a convergent-divergent intake also is employed. This enables efficient diffusion of the ram air from supersonic flight Mach numbers to subsonic flow to suit the compressor ci fan. This is achieved via a series of oblique shock waves, which impose a lower total pressure loss than a normal shock wave.
Separate Jets Turbofan (Figure 3–1[b])
A schematic diagram of a two-spool separate jets turbofan is presented above the center line in Figure 3–1(b). Here, the first compressor, termed a fan, supplies flow to a bypass as well as a core stream. The core stream is akin to a turbojet and provides the hot thrust; however, the core turbines also provide power to compress the fan bypass stream.
The bypass stream bypasses the core components via the bypass duct, incurring a small total pressure loss. It then enters the cold nozzle. The total thrust is the sum of those from both the hot and cold nozzles. The purpose of the bypass stream is to generate additional thrust with a high mass flow rate, but low jet velocity, which improves specific fuel consumption (SFC) relative to a pure turbojet. However, this results in lower ratios of engine thrust to frontal area and weight.
Some turbofans have three spools, with an intermediate pressure (IP) spool as well as the HP and LP spools.
Mixed Turbofan with Afterburner (Figure 3–1[b])
This configuration is shown below the center line in Figure 3–1(b). Here, the two streams are combined in a mixer upstream of a common jet pipe with an afterburner and convergent-divergent nozzle to provide high jet velocities for supersonic flight. It often also is beneficial to mix the two streams for turbofans without afterburners.
Ramjet (Figure 3–1[c])
The ramjet is the simplest thrust engine configuration, employing no rotating turbomachinery. The ram air is diffused in a convergent-divergent intake then passed directly to the combustor. It is accelerated to supersonic jet velocity using a convergent-divergent nozzle. The ramjet is practical only for high supersonic flight regimes.
Simple-Cycle Single-Spool Shaft-Power Engine (Figure 3–2[a])
This engine configuration appears similar to a turbojet, apart from the intake and the exhaust. The main difference is that all the available pressure at entry to the turbine is expanded to ambient to produce shaft power, apart from a small total pressure loss in the exhaust. After diffusion in the exhaust duct, the gas exit velocity is negligible. This results in turbine power substantially greater than that required to drive the compressor; hence, excess power drives the load, such as a propeller (turboprop) or electrical generator (turboshaft). The gas temperature at the exhaust exit plane is typically 250–350°C hotter than ambient, which represents considerable waste heat for an industrial application.
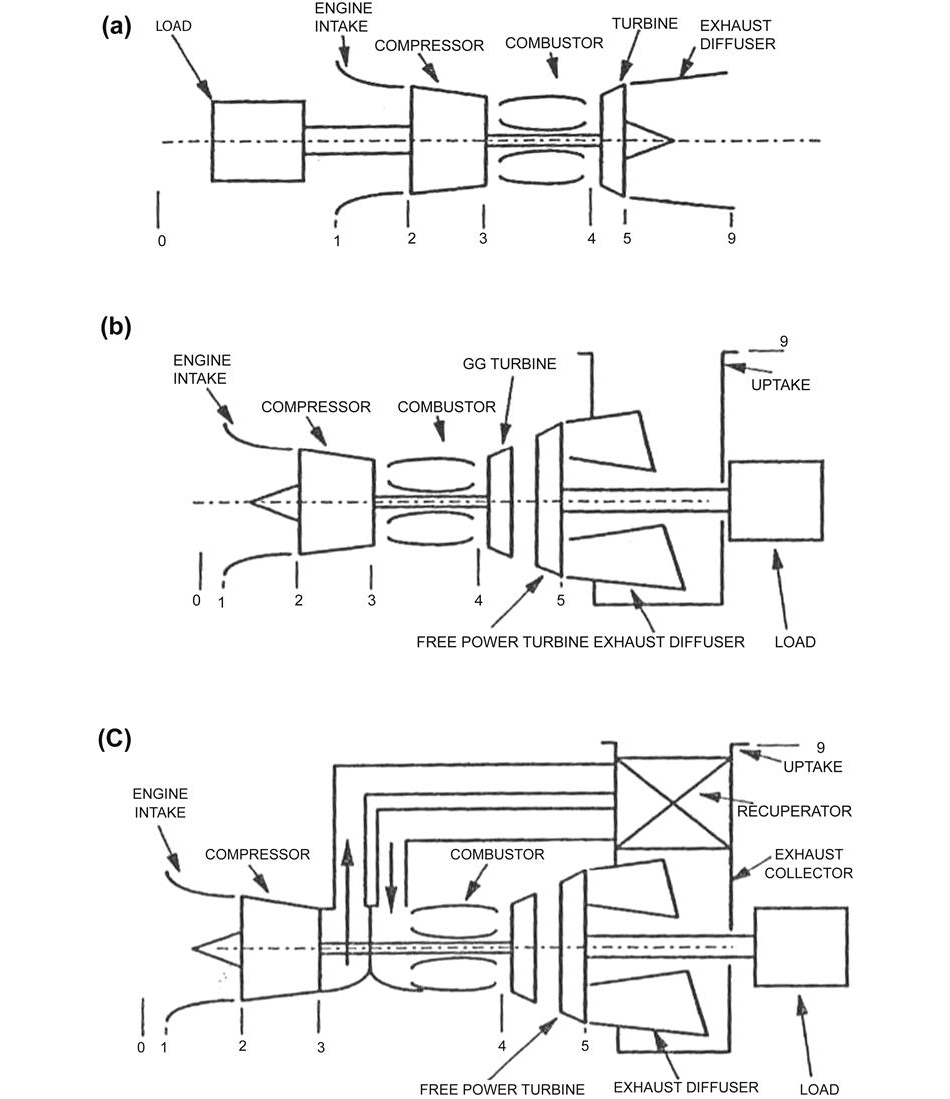
The style of the intake and exhaust varies greatly depending on the application, although fundamentally, the exhaust normally is a diverging, diffusing system as opposed to the jet pipe and nozzle employed by the turbojet for flow acceleration.
The term simple cycle is used to distinguish this configuration from the complex cycles described later, which utilize additional components such as heat exchangers or steam boilers.
Simple-Cycle Free-Power Turbine Engine (Figure 3–2[b])
Here, the load is driven by a free-power turbine separate from that driving the engine compressor. This has significant impact on off-design performance, allowing far greater flexibility in output speed at power.
Gas Generator
The term gas generator describes either the compressor and turbine combination providing the hot, high-pressure gas that enters the jet pipe and propelling nozzle for a turbojet or the free-power turbine for a turboshaft. It is common practice to use a given gas generator design for both a turbojet (or turbofan) and an aeroderivative free-power turbine engine. Here, the jet pipe and propelling nozzle are replaced by a power turbine and exhaust system; for turbofans, the fan and bypass duct are removed.
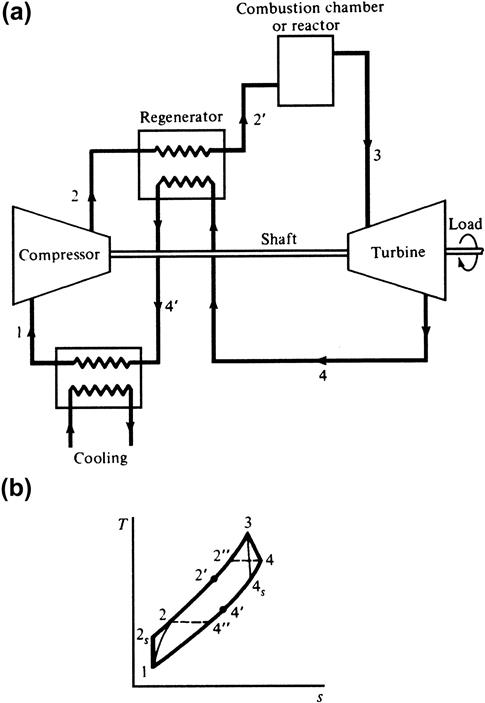
Recuperated Engine (Figure 3–2[c])
Here, some of the heat that would be lost in the exhaust of a simple cycle is returned to the engine. The heat exchanger used is either a recuperator or regenerator, depending on its configuration.
The compressor delivery air is ducted to the air side of the heat exchanger, where it receives heat from the exhaust gas passing through the gas side. The heated air then is ducted back to the combustor, where now less fuel is required to achieve the same turbine entry temperature, which improves specific fuel consumption. Pressure losses occur in the heat exchanger air and gas sides and the transfer ducts.
Intercooled Shaft-Power Engine (Figure 3–3[a])
Here, heat is extracted by an intercooler between the first and second compressors. As might be expected, rejecting heat normally worsens SFC, since more fuel must be burned to raise cooler compressor delivery air to any given turbine entry temperature. However, intercooling improves engine power output and, potentially, even SFC at high-pressure ratios via reduced power absorption in the second compressor. This is due to the lower inlet temperature reducing the work required for a given pressure ratio.
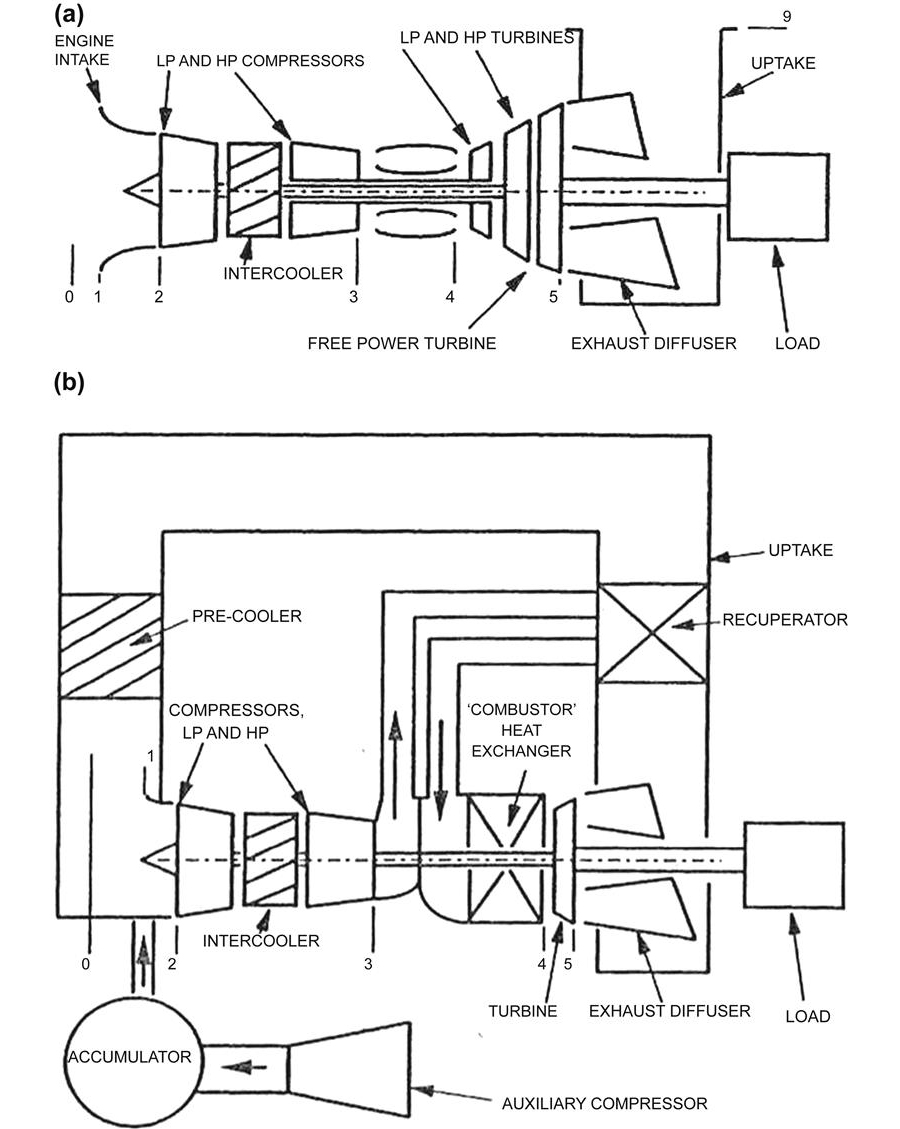
The intercooler rejects heat to an external medium such as seawater. The air side of the intercooler and any ducting impose total pressure losses.
Intercooled Recuperator Shaft-Power Engine (Figure 3–3[b])
Here, both an intercooler and recuperator are employed. The increase in power from intercooling is accompanied by an SFC improvement, as the heat extraction also results in increased heat recovery in the recuperator, due to the lower compressor delivery temperature.
Closed Cycle (Figure 3–3[b])
All the engine configurations just described are open cycle, in that air is drawn from the atmosphere and passes through the engine only once. In a closed cycle configuration, the working fluid is continuously recirculated. It may be air or another gas, such as helium.
Usually, the gas turbine is of an intercooled recuperated configuration, as shown in Figure 3–3(b). However, the combustor is replaced by a heat exchanger, as fuel cannot be burned directly. The heat source for the cycle may be a separate combustor burning normally unsuitable fuels, such as coal, or a nuclear reactor.
On leaving the recuperator, the working fluid must pass through a precooler, where heat is ejected to an external medium such as seawater to return it to the fixed inlet temperature, usually between 15°C and 30°C. The pressure at inlet to the gas turbine is maintained against leakage from the system by an auxiliary compressor supplying a large storage tank, called an accumulator. The high density of the working fluid at engine entry enables very high power output for a given size of plant, which is the main benefit of the closed cycle. Pressure at inlet to the gas turbine typically is around 20 times atmospheric. In addition, varying the pressure level allows power regulation without changing SFC.
Combined Cycle (Figure 3–4[a])
Figure 3–4(a) shows the simplest combined-cycle configuration. The gas turbine otherwise is of simple-cycle configuration, but with a significant portion of the waste heat recovered in an HRSG (heat recovery steam generator). This is a heat exchanger with the gas turbine exhaust on the hot side and pumped high-pressure water, which forms steam, on the cold side. The first part of the HRSG is the economizer, where the water is heated at constant pressure until it reaches its saturation temperature then vaporizes. Once the steam is fully vaporized, its temperature is increased further in the superheater.
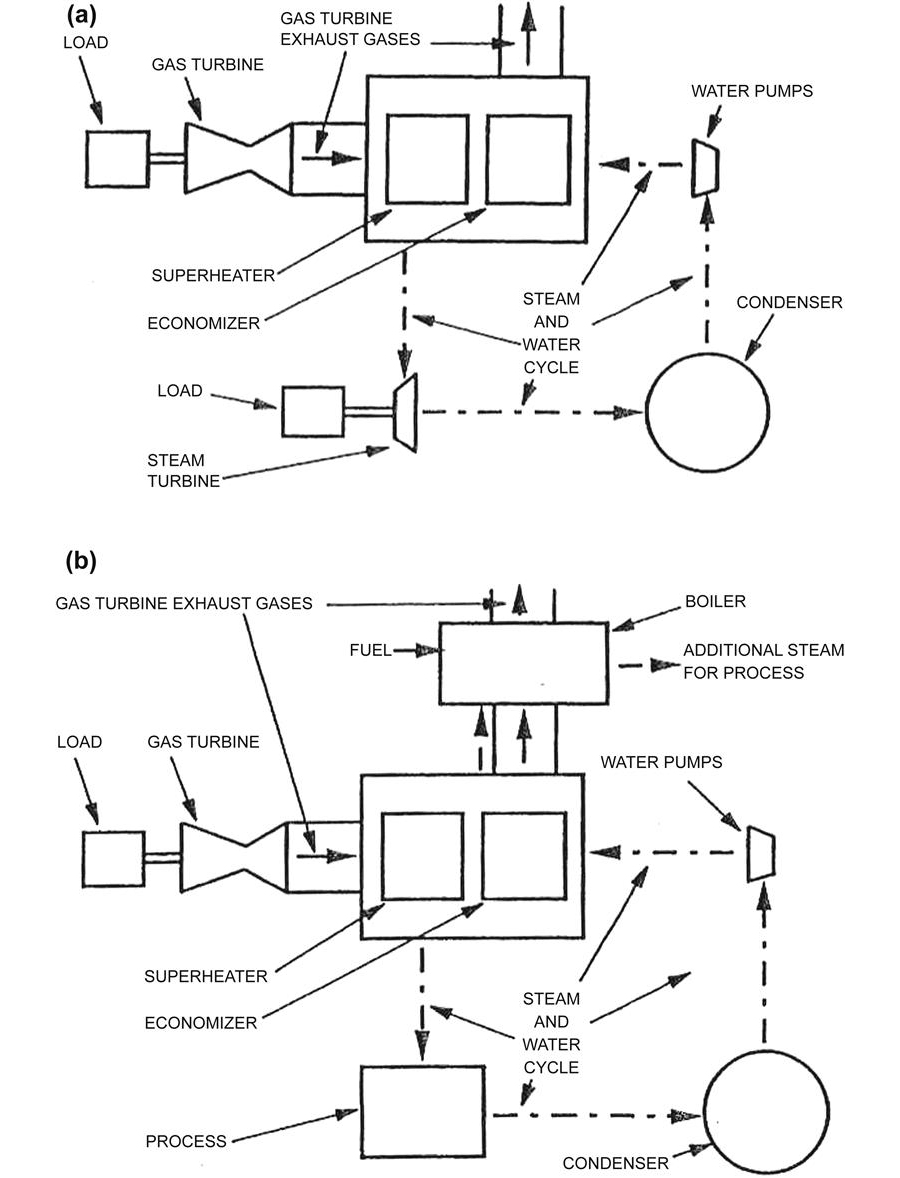
The high-pressure, high-temperature steam is then expanded across a steam turbine, which provides up to an extra 45% power in addition to that from the gas turbine. On leaving the steam turbine, the steam wetness fraction typically is 10%. The rest of the steam is then condensed in one of several possible ways. The most common method uses cooling towers, where heat is exchanged to cold water, usually pumped from a local source, such as a river. When all the steam is condensed, the water passes back to the pumps, ready to be circulated again. Hence, the steam plant is also a “closed cycle.”
Figure 3–4(a) presents a single-pressure steam cycle configuration. The most complex form of steam cycle used is the triple-pressure reheat, where steam expands through three turbines in series. In between successive turbines, it is returned to the HRSG and the temperature is raised again, usually to the same level as at entry to the first turbine. This cycle has the highest efficiency and specific power.
In the combined-cycle plant, the gas turbine often is referred to as the topping cycle, being the hotter one, and the steam plant as the bottoming cycle.
Combined Heat and Power (Figure 3–4[b])
Several forms of combined heat and power, or CHP (cogeneration), plants are described next, in order of increasing complexity.
In the simplest arrangements, the gas turbine waste heat is used directly in an industrial process, such as for drying in a paper mill or cement works.
Adding an HRSG downstream of the gas turbine allows conversion of the waste heat to steam, giving greater flexibility in the process for which it may be used, such as chemical manufacture or space heating in a hospital or factory.
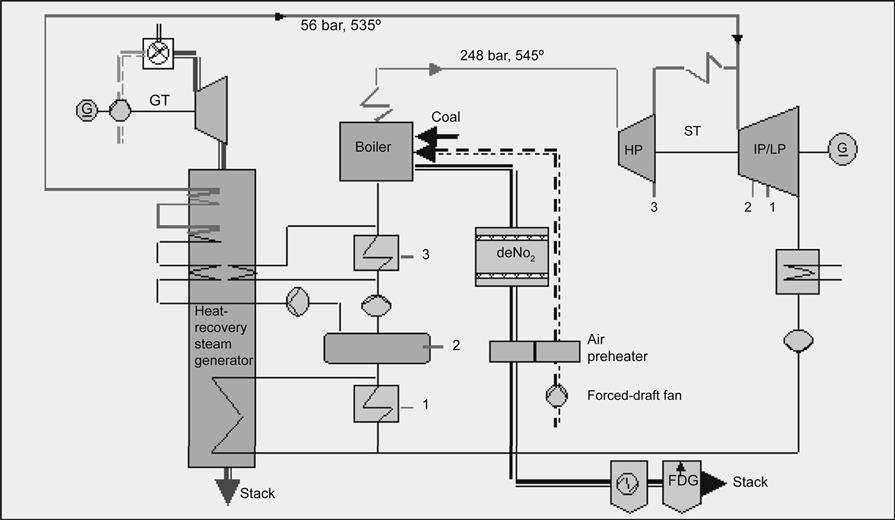
Finally, Figure 3–4(b) shows the most complex CHP configuration, which employs supplementary firing. Here, the simple-cycle gas turbine waste heat again is used to raise steam in an HRSG, which then passes to a boiler, where fuel is burned in the vitiated air to raise additional steam. The boiler provides flexibility in the ratio of heat to electrical power. Once the steam has lost all its useful heat, it passes to a condenser and pumps for recirculation.
Aeroderivative and Heavyweight Gas Turbines
Outside aero applications, gas turbines for producing shaft power fall into two main categories: aeroderivative and heavyweight (or industrial). As implied, the former are direct adaptations of aeroengines, with many common parts. The latter are designed with emphasis on low cost rather than low weight and, hence, may employ such features as solid rotors and thick casings.
Gas Turbine Cycles: Summarized Theory and Economics2,3
As we saw in the first chapter, the basic gas turbine cycle consists of four main processes. Optimizing that cycle frequently involves reducing fuel consumption. This reduction requires changes in the basic cycle that allow the same fuel to provide more power.
The power generation industry is the largest industry sector in the world and has a higher growth rate than any other industry. So the following pages cover cycle variations to the basic gas turbine cycle mainly for power generation applications. The variations in other industrial sectors, however, use much the same logic, and the technology may be essentially similar. For instance, in land-based power generation, the gas turbine’s waste gases are used to generate steam that then drives a steam turbine. This configuration is called a combined cycle. Another variation for this cycle is when the gas turbine’s exhaust gases (which are still rich in oxygen) have fuel added to their mix and the overall mixture is ignited. This is exactly the principle behind the aircraft engine afterburner.
Similarly, “active clearance controls” (ACC), a method for increasing the cooling to hot turbine blades, thus allowing the turbine to increase fuel flow (and therefore final delivered power), is used both in land-based and aircraft engine technology. Original engine manufacturers (OEMs) sometimes use the same terms, such as ACC, to describe systems that may differ considerably.
With ACC in land-based gas turbines in the combined cycle mode, the OEM has the opportunity to use steam as the cooling medium. Steam provides more cooling for a given application than air. Further, cooling steam can be injected back into the gas turbine for a boost in overall power generated due to steam injection.
In aircraft engine applications, however, normally no steam is available. The cooling medium is air.
Aircraft engines, however, may have larger fans than are found on land-based engines, allowing them to “swallow” more air, use more fuel to combine with it, and therefore increase power delivered.
So, as mentioned previously, we now look at basic cycle modifications for land-based gas turbines. Typically, these modifications occur more in power generation applications, although they also serve mechanical drive and marine (including offshore) applications. Ultimately, the decision to use any of these cycle modifications depends on weight allowance (much lower in aircraft engine and offshore platform applications), space available, and whether steam is available.
The success of these cycle modifications frequently is governed by the fuel used in the application. Gas turbine designers get increasingly better at burning “low-Btu” fuels and waste fuels (such as paper liquor and steel mill flue gas) of all kinds. Fuels are discussed in further detail in Chapter 7.
Additional cycle modifications tailored to specific applications are discussed at various points throughout this book, for instance, Chapter 10 on performance optimization, so the material in this chapter merely lays the groundwork.
As we saw earlier, the primary applications of gas turbines are:
• Aircraft engines—large turbo fan (ramjet), helicopter (power via transmission to rotor)
• Direct drive, land-based—power generation
• Mechanical drive—driving compressors, pumps, blowers (generally via gearbox)
• Marine service—power generation on board or for propulsion
In land and marine applications, the main advantages of gas turbine plants versus steam turbine plants include:
• Small in size, mass, and purchase cost per unit of power
• Quick installation; delivery time may be better
• Quick starting (start to full speed is ∼10 sec); can be started remotely
• Capacity factor (running time at full power) of 96–98%
• Can run on a wide variety of fuels, including gasified coal, flue gas from steel mills, liquor from paper waste, biomass, residual
• Environmental considerations and restrictions can be more economical to manage (consider precipitators and flue gas desulfurization)
Power Generation Gas Turbine, Simple and Combined Cycles
Figures 3–5, 3–6, and 3–7 describe the gas turbine simple cycle. The gas turbine simple cycle consists of the following:
• Air intake is at atmospheric pressure.
• The compressor pressure ratio (PR) typically is 15–25 for most land-based gas turbines (higher in the case of some aeroengines); the temperature increases to typically 750–850°F (400–465°C).
• The combustion zone typically is 2500–2600°F (1370–1427°C) for land-based gas turbines. Flame temperatures may exceed 2000°C in some aircraft engines.
• First-stage turbine inlet nozzles (1st stage NGVs) convert high-enthalpy gas to high-velocity gas.
• High-velocity gas turns the turbine rotor blades and buckets.
• The turbine exhaust temperature is typically 900–1180°F (482–638°C). For every 100°F (56°C) increase in the turbo inlet temperature (TIT), typically a 1.5% efficiency increase can result. Work output can increase by 10%.
All of these parameters modify with cycle adaptations. Regeneration lowers the heat rate (involves the heat recovery of turbine exhaust gases and adds between 15 and 20% efficiency; see Figure 3–8). The optimum PR for a regenerative cycle is about 7; for a simple cycle, it is about 18 (see Figures 3–6 and 3–8).
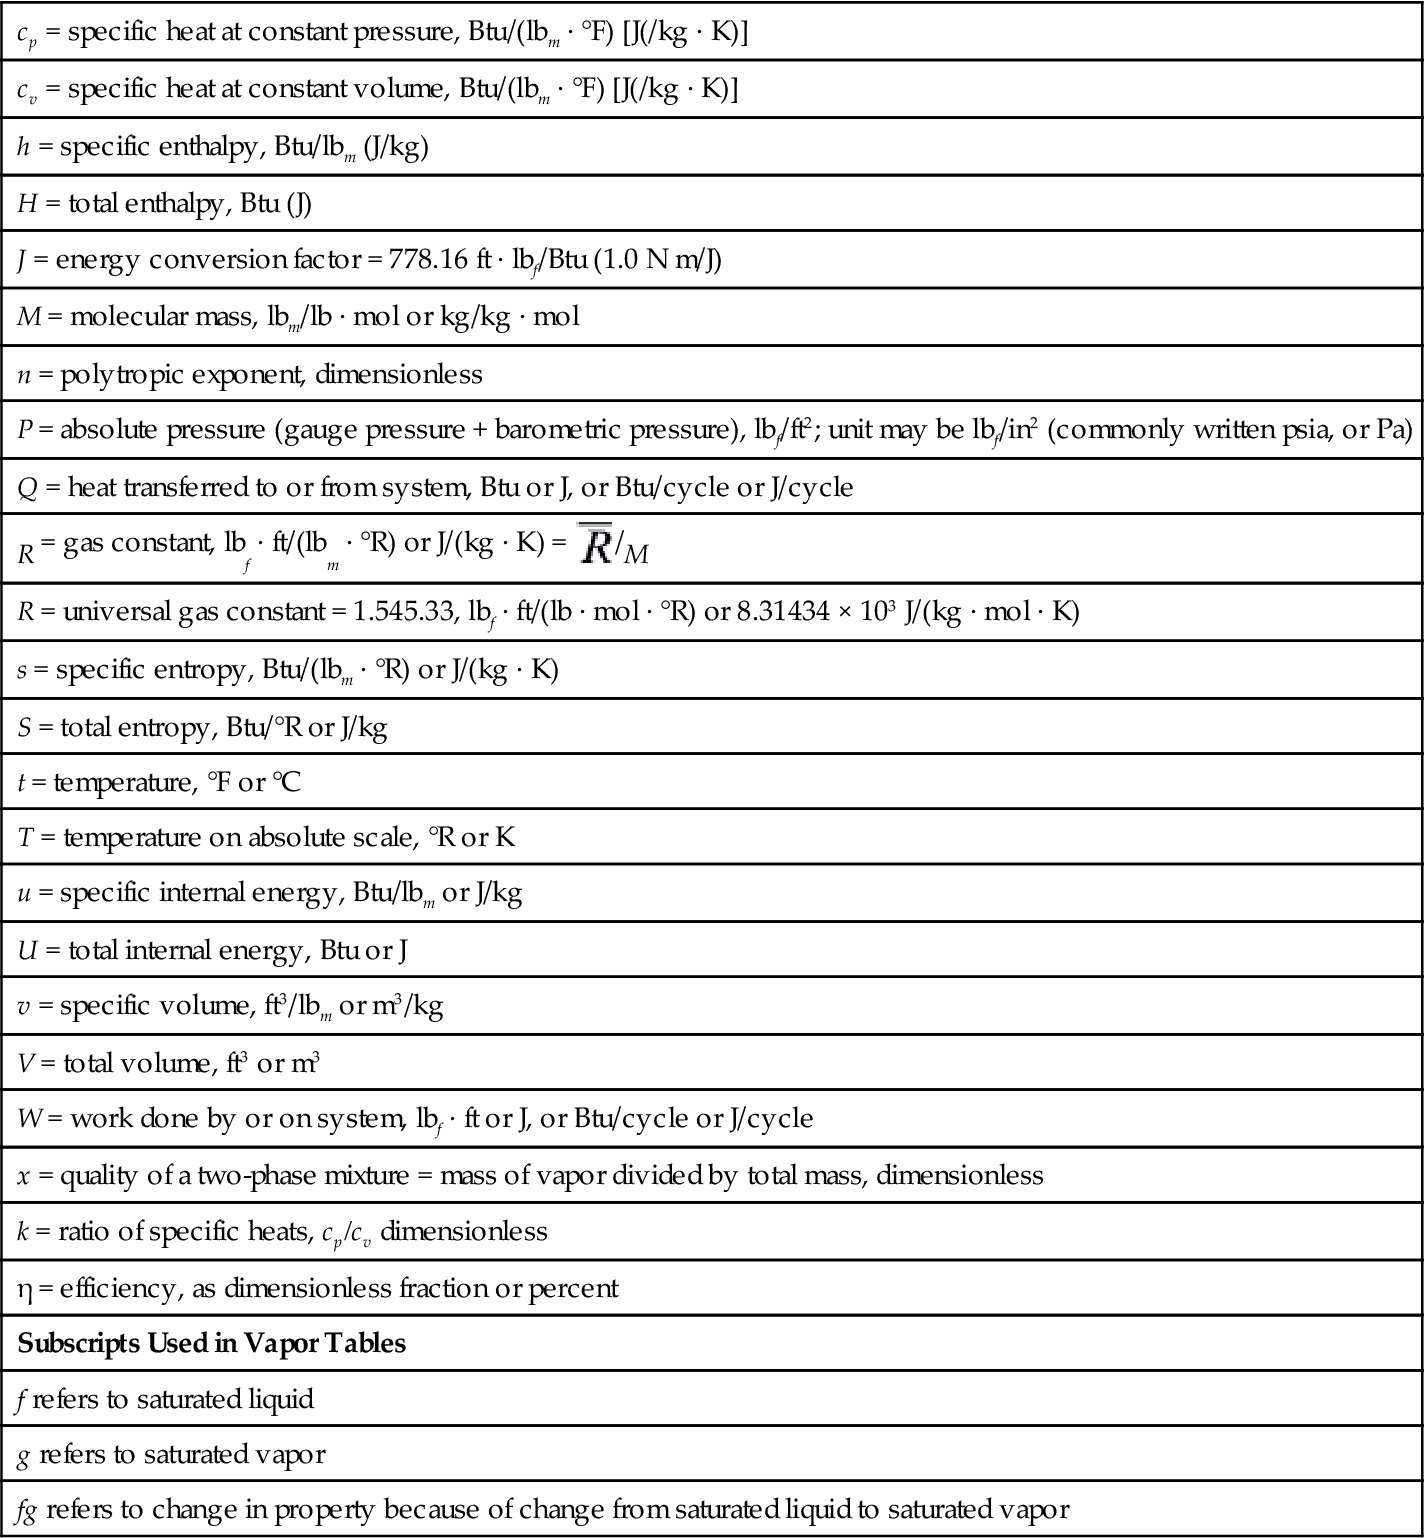
As steam turbines form such a beneficial partnership with gas turbines in combined cycle applications, we consider at a brief summary of steam turbine theory as it applies to gas turbine combined cycle operation, and steam turbine (solo) operation, both primarily in power generation service. This material on steam turbines is covered in Appendix 3A. (For this section, see Table 3–1 for the symbols used.)4 We now continue the discussion of combined cycle and other gas turbine cycle modifications.
TABLE 3–1
| cp = specific heat at constant pressure, Btu/(lbm · °F) [J(/kg · K)] |
| cv = specific heat at constant volume, Btu/(lbm · °F) [J(/kg · K)] |
| h = specific enthalpy, Btu/lbm (J/kg) |
| H = total enthalpy, Btu (J) |
| J = energy conversion factor = 778.16 ft · lbf/Btu (1.0 N m/J) |
| M = molecular mass, lbm/lb · mol or kg/kg · mol |
| n = polytropic exponent, dimensionless |
| P = absolute pressure (gauge pressure + barometric pressure), lbf/ft2; unit may be lbf/in2 (commonly written psia, or Pa) |
| Q = heat transferred to or from system, Btu or J, or Btu/cycle or J/cycle |
| R = gas constant, lbf · ft/(lbm · °R) or J/(kg · K) = |
| R = universal gas constant = 1.545.33, lbf · ft/(lb · mol · °R) or 8.31434 × 10³ J/(kg · mol · K) |
| s = specific entropy, Btu/(lbm · °R) or J/(kg · K) |
| S = total entropy, Btu/°R or J/kg |
| t = temperature, °F or °C |
| T = temperature on absolute scale, °R or K |
| u = specific internal energy, Btu/lbm or J/kg |
| U = total internal energy, Btu or J |
| v = specific volume, ft3/lbm or m3/kg |
| V = total volume, ft3 or m3 |
| W = work done by or on system, lbf · ft or J, or Btu/cycle or J/cycle |
| x = quality of a two-phase mixture = mass of vapor divided by total mass, dimensionless |
| k = ratio of specific heats, cp/cv dimensionless |
| η = efficiency, as dimensionless fraction or percent |
| Subscripts Used in Vapor Tables |
| f refers to saturated liquid |
| g refers to saturated vapor |
| fg refers to change in property because of change from saturated liquid to saturated vapor |
In the first edition, the steam turbine theory was not in an appendix. The content of the original steam turbine material remains unchanged, however. Also, consider that the Benson boiler design that is prevalent on gas turbine combined cycles is also used in steam turbine installations. The boiler size may vary, but the working principle does not.5
Combined Cycles and Other GT Cycle Modifications
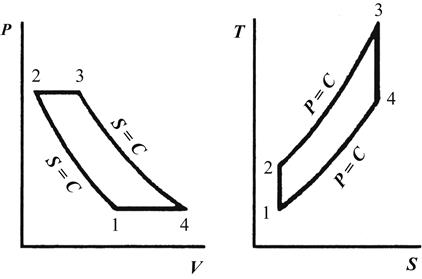
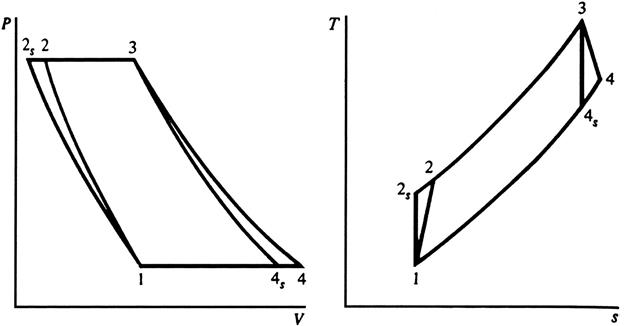
A Brayton cycle, P-v and T-s diagrams are illustrated in Figure 3–9 (= 1234).
Compressor polytropic efficiency, ![]()
Assume constant specific heats
And
Turbine polytropic efficiency, ![]()
Assume constant specific heats
For constant specific heats:
Or
In terms of
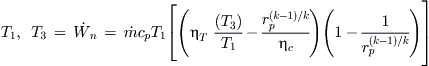
The second bracketed term is ideal cycle efficiency.
Specific power of the non-ideal cycle is:
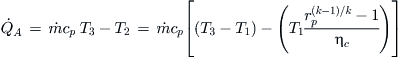
Heat added in the cycle:
Note many losses/irreversibilities have not been allowed for, including piping losses, pressure drop between 2 and 3, and pressure difference between 4 and 1, to name a few.
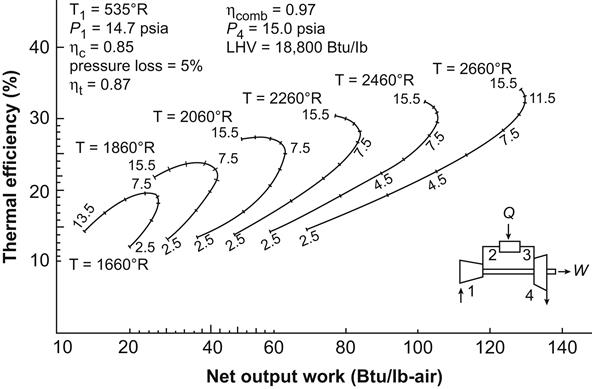
See Figure 3–10 for an illustration of a simple cycle and a regenerative cycle (dashed lines).
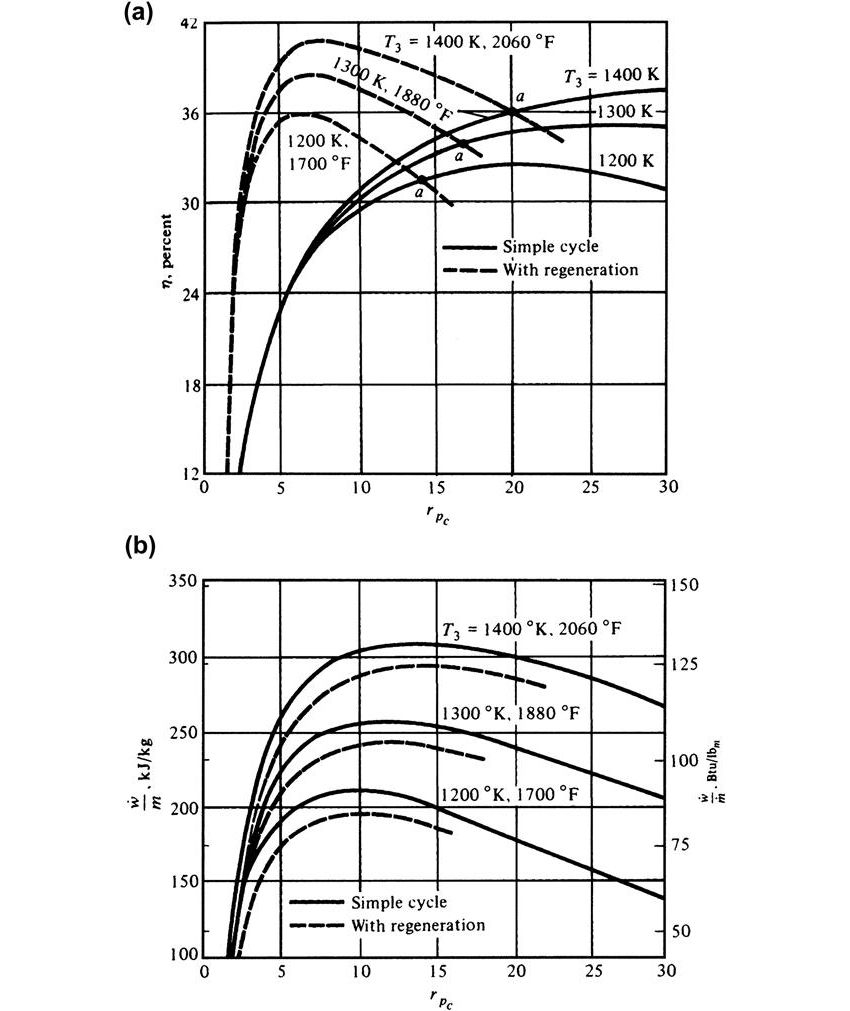
Data used for the simple cycle was:
Ti = 15°C = 59°F = constant
P1 = 1.013 bar = 1 atm = constant
ηc = 90% and ηT = 87%
Mechanical losses = 1%
Combustion chamber losses = 2%
Air bypass = 3%
Efficiency and specific work depend heavily on the max. temperature reached (“TIT” = turbine inlet temperature).
Cycle Modifications
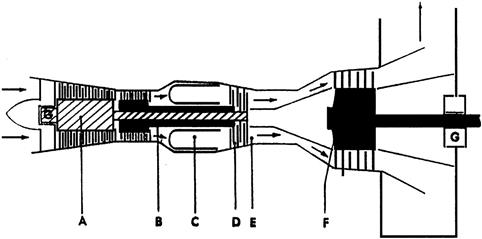
The most common cycle modifications are:
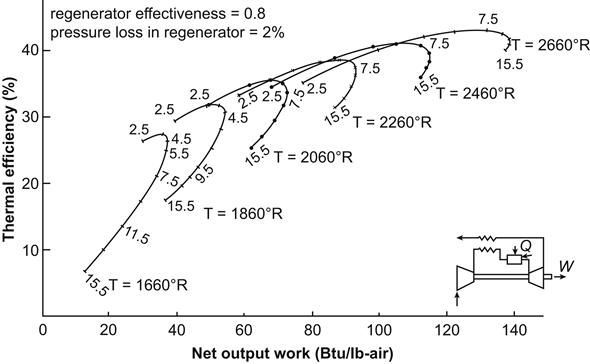
Regeneration ⇒ internal exchange of heat within the cycle. Note the regenerator or recuperator in Figure 3–11. Regenerator effectiveness or efficiency is less than 100%. If the compressor outlet is heated to T2′, then regenerator effectiveness is:
Let’s say that = 75%.
The rise in efficiency is notes in Figure 3–10. However, the optimum pressure ratio for an efficiency value drops,
Cycle heat input drops further.
At some point, the temperature of exhaust gases < post-compression air, or the regenerator is ineffective.
Intercooling involves taking compressed air at a given stage of compression, cooling it (which increases its density and therefore the mass of air that can be compressed) and leading the cooled air back to the next stage of compression. There may be more than one stage of intercooling (see Figure 3–12).
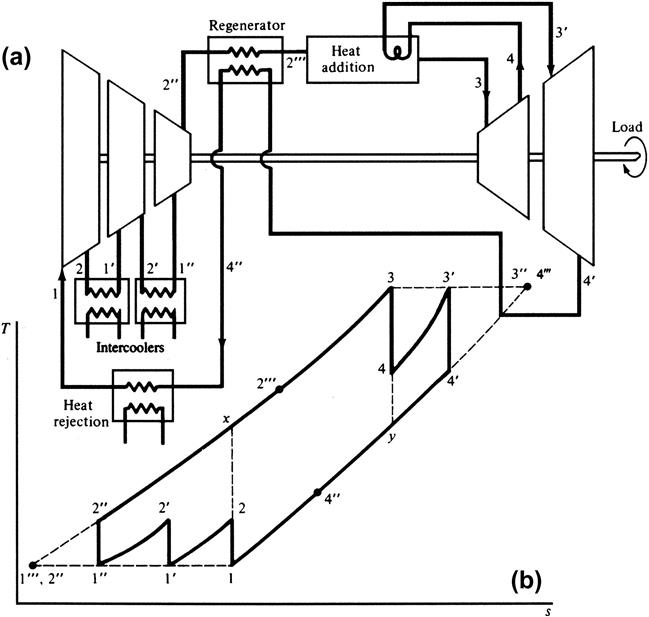
In Figure 3–12, the increase of work provided by intercooling is 21′2′1′2′ × 2. More heat had to be added to get this work increase. Per unit mass that additional heat is:
However, a net efficiency increases results.
Reheat involves taking gas from an interim stage in the turbine, adding heat to the gas and then leading it back to the turbine (see Figure 3–12). One stage of reheat is shown.
• The increase in cycle work is 43′4′ y.
• Additional heat required to get this is: H3′ – H4
• However, net work and efficiency rise.
• Efficiency rises with the number of stages of intercooling and reheat, but so does plant capital cost.
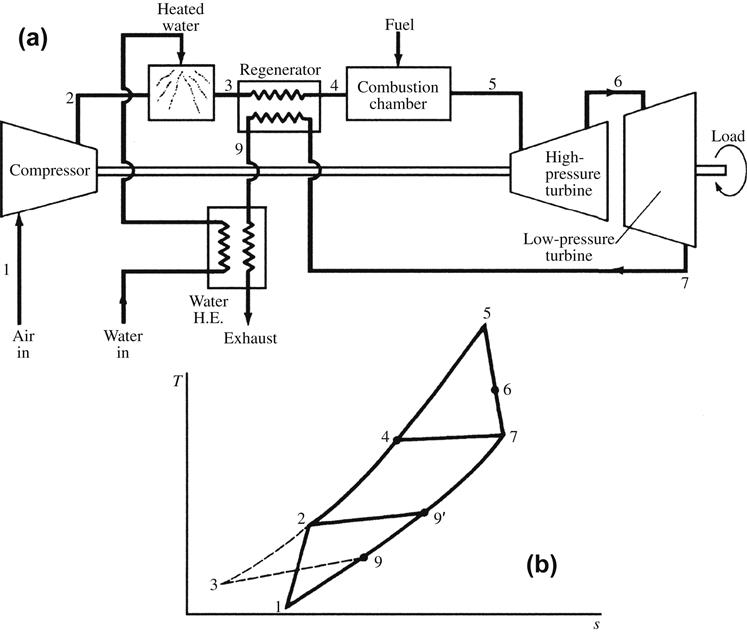
Water injection increases power output significantly and efficiency slightly. Water is injected into the compressor and vaporizes as the air temperature increases. The heat of vaporization reduces the compressed air temperature. This lowers compressor work (see Figure 3–13).
• 124579′1 is the cycle with no water injection.
• 9′ is exhaust gas from the regenerator.
• 3 represents the evaporating water.
• With water injection, compressor air cools from 2 to 3.
• The regenerator preheats the air from 3 to 4. The heat required to raise temperature from 3 to 2 comes from exhaust gas from 9′ to 9.
• T3 is saturation temperature for air.
• Further increase in water vapor increases net work required and reduces efficiency.
Combined Cycles
Figure 3–14 illustrates the first kind (HRB).

To increase output through limited duration peaks, SF (supplementary fuel) is used.
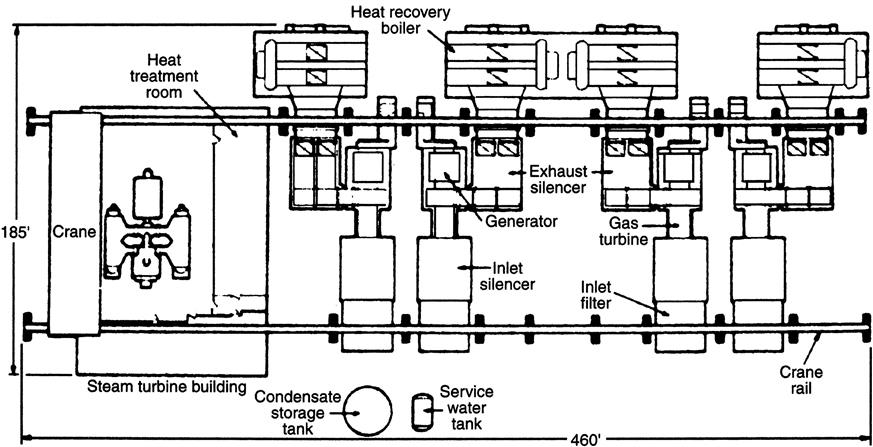
STAG CC
In Figure 3–15, 4 GE Frame 7s exhaust to air or produce steam in 4 HRBs that send steam to one ST. The combination can provide 600, 800, 1000, or 1250 psi steam.
CC with Multipressure Steam
In Figure 3–16, the HRB has two steam circuits:
• A high-pressure circuit, feeding the ST inlet
• A low-pressure circuit, feeding an intermediate stage of the ST
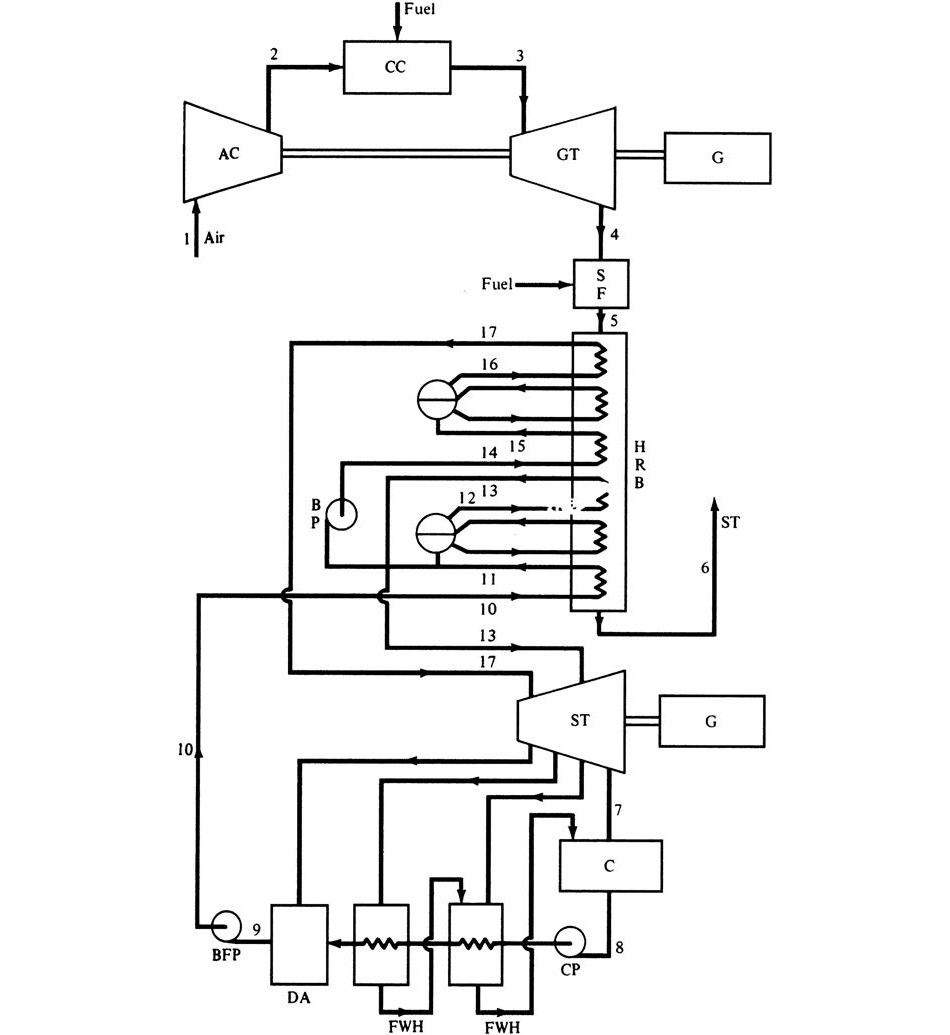
In Figure 3–17,
• 10–11 = feedwater heating in the economizer
• Water is pumped by a booster pump (BP) from the low-pressure steam drum at 11 to 14.
• Note the single HP circuit is 10′15 – 16 – 17, with gas leaving the stack at 6′.
• With the low circuit, the gas leaves at 6.
• As 6 is lower than 6′, this ⇒ that more energy has been extracted, so efficiency is higher.

Combined-Cycle Economics6
Within the field of power generation, the combined cycle is seen as a major step towards fuel economy and lessening GHG (greenhouse gas) emissions. Combined-cycle plant efficiencies now typically are up to between 58 and 60%.
Gas flapper valves allow the gas turbine exhaust to bypass the heat recovery boiler (HRSG), allowing the gas turbine to operate if the steam unit is down for maintenance. In earlier designs, supplementary oil or gas firing was included to permit steam unit operation with the gas turbine down. This is not generally included in contemporary combined-cycle designs, as it adds to capital cost, complicates the control system, and reduces efficiency.
Sometimes as many as four (but most frequently two) gas turbines, each with individual boilers, may be associated with a single steam turbine. As stated previously, the gas turbine, steam turbine, and generator may be arranged as a single-shaft design. A multi-shaft arrangement can also be used: Each gas turbine drives a generator and has its own HRSG and steam turbine, which in turn may also add power to the generator.
In areas such as Scandinavia, additional criteria such as cogeneration in combined heat and power (CHP) plants or district heating, as well as demanding conditions (e.g., available space, emissions, noise level, architecture, environmental permits) associated with existing sites and available infrastructure, must be considered. A customer’s preferences regarding fuel selection, personnel training level required, and service requirements also must be accommodated.
A major portion of the economic considerations that make up an end-user’s selection of gas turbine packages has to do with the candidate OEMs' “state of proven technology.” This means that as OEMs continue to develop newer gas turbine technologies, they need to test customized packages ordered by the end-user. At some point this needs to be a full load test and depending on which OEM is the supplier, this full load test may be done in the OEM’s test facility or on-site. In other words, the end-user can contract with the OEM for financial consideration if the gas turbine package does not perform as specified in the sales contract. This chapter ends with a case study from an EPC (engineering, procurement, and construction) contractor that has dealt with gas turbine packages involving the OEM’s latest technology and notes the various delays that may arise when one is commissioning models that are not yet mature in the market.
Combined-Cycle Module Flexibility7
With combined cycles, capacity can be installed in modules or module stages. Gas turbines (GTs) can be commissioned initially (one- to two-year project construction) and then the HRSG(s) and steam turbine(s) (ST) (an additional six months to one year).
For instance, an Alstom 13E2 CC module can consist of two 13E2 gas turbines with heat recovery steam generation and one steam turbine, as in their Kuala Langat, Malaysia, plant. In this way, combined-cycle capacity can be installed in segments. This further assists generation dispatching, as each gas turbine can be operated with or without the steam turbine. This then provides better efficiency at partial load than operating one large machine with the total capacity equal to the gas turbine(s) and the steam turbine.
Another case8 illustrating application of the two GT and one ST module is Alstom’s contract for the Sohar Aluminum Company to do the turnkey construction of a 1000 MW gas-fired combined-cycle power plant in Oman. The power plant, which will supply electricity to power a new aluminum smelter, will include four 13E2s, four heat recovery steam generators, two steam turbines, and six generators. The size of the modules then provides the option for Sohar to add an additional 500 MW of capacity in the future (two GT13E2 gas turbines, two heat recovery steam generators, a steam turbine, and three generators).
Gas turbine or combined-cycle (CC) construction cost per kilowatt does not increase much for smaller turbines. With steam turbines, it would to a far greater extent, because of the high additional construction work that comes with a steam turbine plant. A CC unit typically can be installed in two to three years; and a steam plant often takes four to five years, with no incremental power available until the complete plant is commissioned. An application case that illustrates the availability of power in increments is an Alstom recent project9 from an Australian energy company, Alinta Ltd, to supply two 172 MW GT13E2 gas turbines for the first stage of a major cogeneration facility at Alcoa’s Wagerup alumina refinery in Australia. That power plant also will provide reserve capacity to the new wholesale electricity market in the state of Western Australia. The Alstom turbines initially will operate in open cycle (Wagerup Stage 1). At a later stage (Wagerup Stage 2), the turbines will be part of a cogeneration plant, operating as a baseload power station providing both steam and electricity.
A project database (developed by Siemens KWU) was used to analyze all combined, open cycle, and steam power plants globally with respect to capacity (MW), fuel requirements, power system frequency, and regional location. The database lists projected orders through 2005.
In terms of overall plant size, 300–600 MW combined-cycle plants are the most favored plant size in both the 50 and 60 Hz markets (Figure 3–18). A combination of more than one block improves economics, and 300–600 MW fits well with the demand curve of most power grids in well-developed countries. Financiers also are familiar with these economies of scale.
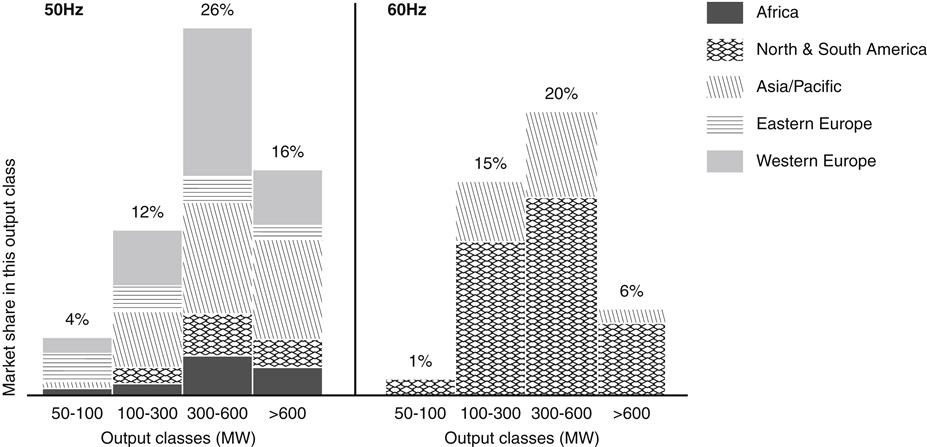
Countries with large grids and high power demand growth prefer combined-cycle plants in the range of 600–2500 MW. For this combination, two to six parallel units (single-shaft or multi-shaft) suffice.
Power systems in countries with relatively small generating capacity, which require smaller capacity additions, need combined-cycle power plants in the range of 100–300 MW. A large gas turbine and a steam turbine located on a single shaft can deliver this range.
Countries with smaller or specialized grids buy multi-shaft combined-cycle plants with several smaller gas turbines and one or more steam turbines. Dirty fuels, for instance, or residuals, promote requests for stolid, highly reliable trains that may run derated, over higher-efficiency turbines.
For peaking power or power systems with very low-cost fuels, gas turbines in an open cycle system serve the power range between 50 and 300 MW.
New order forecasts show the market evenly divided between 50 Hz and 60 Hz customers. Rising gas and oil prices everywhere, including the United States, mean renewed strength in technologies that use alternative fuels, such as pulverized coal, paper liquor waste, and steel mill flue gas.
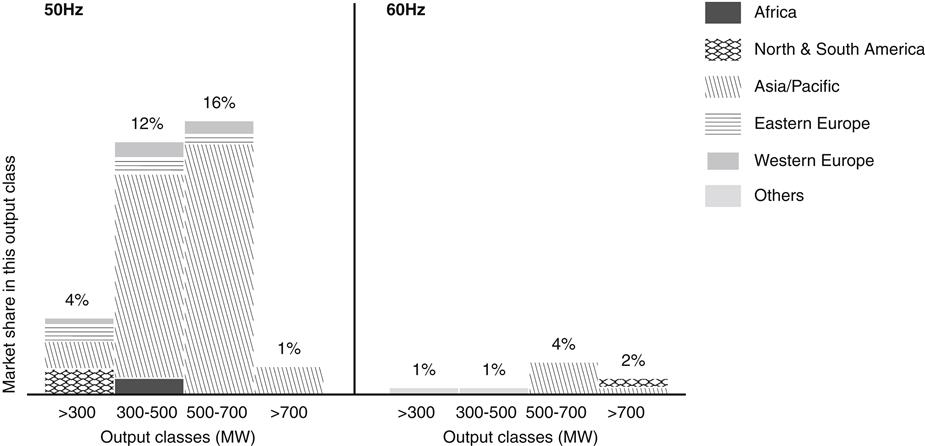
Steam-Only (Coal-Fired) Power Plants
The forecast projects 10% of the new orders will be steam power plants in 60 Hz market from 1999 to 2003 (Figure 3–19). In the 50 Hz market, the key ranges are 300–500 MW and 500–700 MW. Above 700 MW, supercritical technology represents a small but growing market share.
OEM Modular Strategy
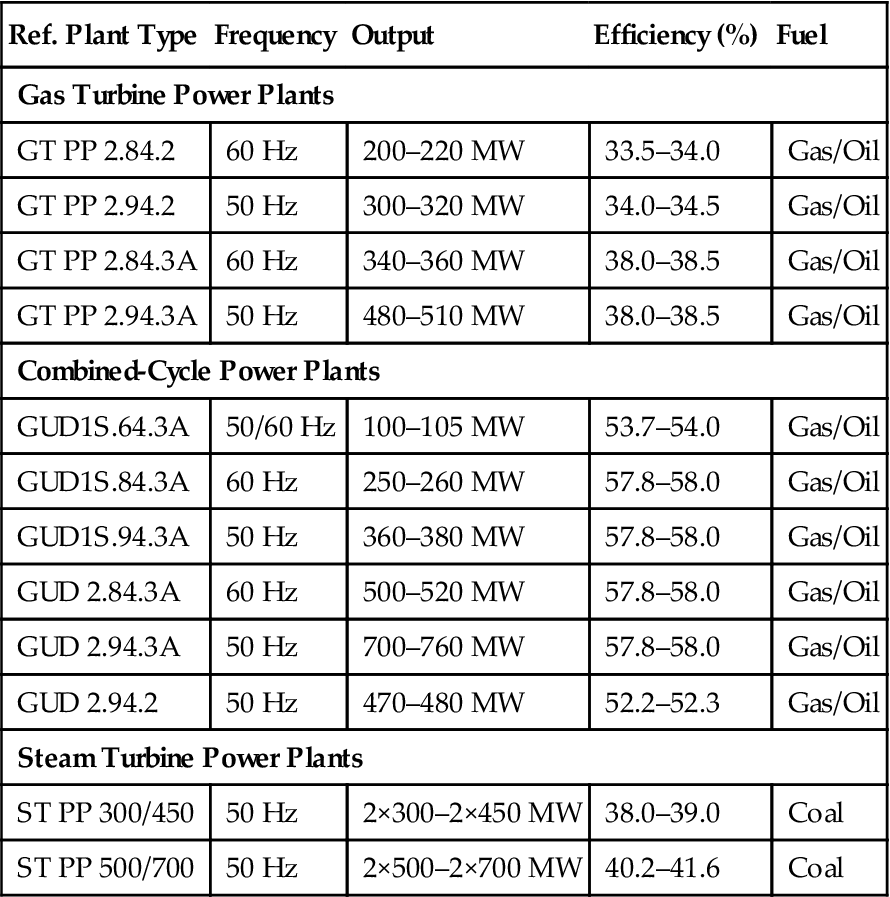
As previously discussed, to save on costs to both OEMs and end-users, OEMs developed modular plants. Siemens has 12 basic power plant combinations (Table 3–2): four for open cycle gas turbine plants, six for combined-cycle plants, and two for coal-fired steam power plants (with sub- and supercritical technology). Each combination covers a specific power range, efficiency, and fuel specification, with allowance for cogeneration system additions.
TABLE 3–2
Reference Power Plant Data [3-4]
| Ref. Plant Type | Frequency | Output | Efficiency (%) | Fuel |
| Gas Turbine Power Plants | ||||
| GT PP 2.84.2 | 60 Hz | 200–220 MW | 33.5–34.0 | Gas/Oil |
| GT PP 2.94.2 | 50 Hz | 300–320 MW | 34.0–34.5 | Gas/Oil |
| GT PP 2.84.3A | 60 Hz | 340–360 MW | 38.0–38.5 | Gas/Oil |
| GT PP 2.94.3A | 50 Hz | 480–510 MW | 38.0–38.5 | Gas/Oil |
| Combined-Cycle Power Plants | ||||
| GUD1S.64.3A | 50/60 Hz | 100–105 MW | 53.7–54.0 | Gas/Oil |
| GUD1S.84.3A | 60 Hz | 250–260 MW | 57.8–58.0 | Gas/Oil |
| GUD1S.94.3A | 50 Hz | 360–380 MW | 57.8–58.0 | Gas/Oil |
| GUD 2.84.3A | 60 Hz | 500–520 MW | 57.8–58.0 | Gas/Oil |
| GUD 2.94.3A | 50 Hz | 700–760 MW | 57.8–58.0 | Gas/Oil |
| GUD 2.94.2 | 50 Hz | 470–480 MW | 52.2–52.3 | Gas/Oil |
| Steam Turbine Power Plants | ||||
| ST PP 300/450 | 50 Hz | 2×300–2×450 MW | 38.0–39.0 | Coal |
| ST PP 500/700 | 50 Hz | 2×500–2×700 MW | 40.2–41.6 | Coal |
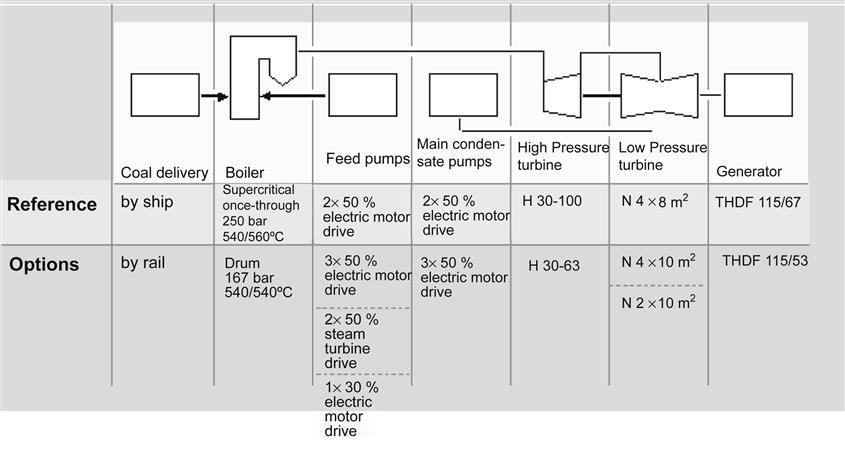
For design flexibility, options to the reference version for each major functional unit (Figure 3–20) are provided. For example, via ship is the reference for the functional unit coal supply with delivery via rail as an option. Flexible design requires breaking down the power plant into functional units, each of which directly affects only one or two other modules. For a combined-cycle plant, the functional units are arranged around the gas turbine and steam turbine. With the gas turbine, as we saw earlier, OEMs strive to maintain core feature commonalities.
Fuels for Combined Cycles
Gas turbine operators prefer to burn natural gas and light oil (diesel, No. 2). As we saw previously, crude oil, residuals, and “bunker” fuel contain corrosive components. They require fuel treatment equipment. Also, ash deposits from these fuels can result in gas turbine derating of up to 15%. As we also saw previously (in the case of the Shunde plant in south China), they still may be economically attractive fuels, particularly in combined-cycle plants.
Sodium and potassium are removed from residual, crude, and heavy distillates by a water-washing procedure. A simpler and less-expensive purification system does the same job for light crude and light distillates. A magnesium additive system reduces vanadium.
Note that reduced availability results, due to water cleaning shutdowns to remove blade deposits, as online washing, even at reduced speeds, is not effective. A shutdown with a crank soak every 100–120 hours is required. Reduced component life due to hot gas path corrosion caused by vanadium deposits and other corrosion is another factor to consider.
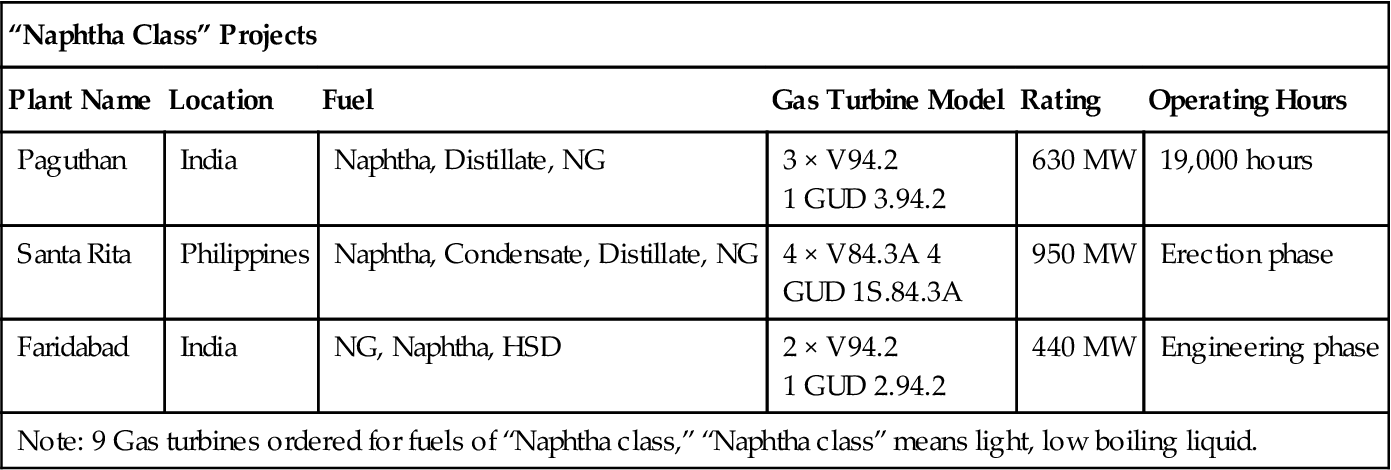
Table 3–3 provides a sample of naphtha- and heavy oil-fired power plants in operation and in the planning stage. As this table shows, some plants (e.g., Kot Addu and Valladolid) accumulated 30–60,000 hrs of successful operation over their first five years plus.
TABLE 3–3
Operation Experience with Naphtha- and Heavy Oil-Fired CC Plants
| “Naphtha Class” Projects | |||||
| Plant Name | Location | Fuel | Gas Turbine Model | Rating | Operating Hours |
| Paguthan | India | Naphtha, Distillate, NG | 3 × V94.2 1 GUD 3.94.2 |
630 MW | 19,000 hours |
| Santa Rita | Philippines | Naphtha, Condensate, Distillate, NG | 4 × V84.3A 4 GUD 1S.84.3A |
950 MW | Erection phase |
| Faridabad | India | NG, Naphtha, HSD | 2 × V94.2 1 GUD 2.94.2 |
440 MW | Engineering phase |
| Note: 9 Gas turbines ordered for fuels of “Naphtha class,” “Naphtha class” means light, low boiling liquid. | |||||
| Latest Plants Ash-Forming Fuels | |||||
| Plant Name | Location | Fuel | Gas Turbine Model | Rating | OperatingHours |
| Valladolid | Mexico | Residual oil | 2 × V84.2 1 GUD 2.84.2 | 220 MW | 24,000 hrs |
| Kot Addu | Pakistan | Furnace oil (Heavy oil) | 4 × V94.2 2 GUD 2.94.2 | 820 MW | 60,000 hrs |
| Rousch | Pakistan | Heavy oil | 2 × V94.2 1 GUD 2.94.2 | 390 MW | Commissioning phase |
Note: 34 Gas turbines delivered for ash-forming fuels in total accumulated operating hours (approx. 140,000 hours).
Design and operation of these plants requires more attention than natural gas-fired plants, particularly in relation to fuel variables such as calorific content, density, composition, concentration of contaminants and emissions, as well as different burning behaviors (e.g., ignitability, flame velocity, and stability).
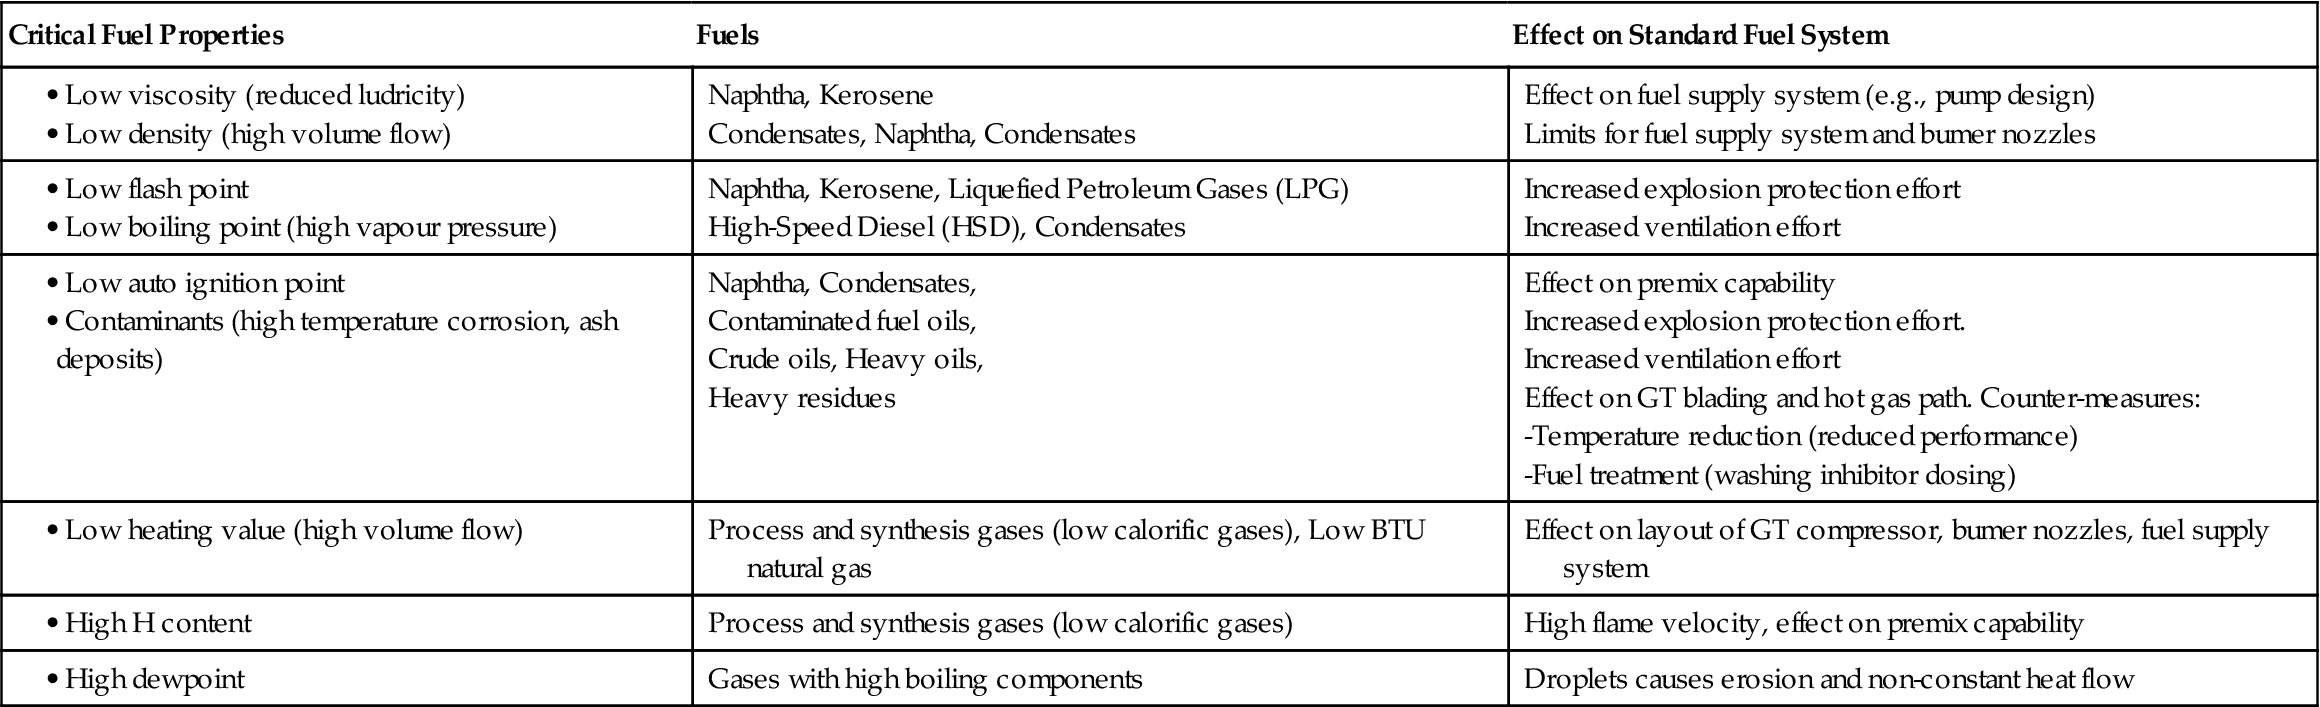
To overcome these difficult fuel properties, technological adaptation, additional equipment, and operational requirements are necessary. These include GT layout (compressor, turbine) for the changed mass flows, different burner technology (burner design, burner nozzles), and additional startup/shutdown fuel system and safety measures. Performance, availability, and operation and maintenance (O&M) expenses can be affected. To illustrate this, Table 3–4 shows some key non-standard fuels and their effect on a standard fuel system.
TABLE 3–4
Gas Turbines for Non-Standard Fuels, Critical Fuel Properties [3-4]
An example of a gas turbine combined-cycle plant burning a nonconventional fuel is the 220 MW Valladolid plant in Mexico. This plant, commissioned in 1994, burns heavily contaminated fuel oil, containing 4.2% sodium and up to 300 ppm vanadium. Fuel impurities (sodium, potassium, and vanadium) tend to form ash particles in the combustion process, form deposits, and corrode the gas turbine blades. In the case of the Valladolid plant, “Epsom salts,” consisting mainly of magnesium sulfate (MgSO4 7H2O), are dissolved in water injected into the gas turbine combustor through special orifices. This converts the vanadium into a stable water-soluble product (magnesium vanadate), which is deposited downstream of the combustor on the gas turbine blades, and causes only minor blade corrosion. To prevent major performance loss with salt buildup (as with the Shunde, China, plant that we read about previously), washing every 150 hours was necessary to restore aerodynamic performance and plant efficiency. Good manhole access was a critical success factor for this project, as servicing and maintenance during turbine washing shutdowns are simplified. (The plan is to eventually convert the Valladolid plant to natural gas operation.)
Factors that Affect Costs per Fired Hour
Fuel type and mode of operation (steady load/partial load) determine the maintenance intervals and work items required. Some estimate that burning residual or crude oil increases maintenance costs by a factor of 3 (assuming a base of 1 for natural gas and by a factor of 1.5 for distillate fuel) and those costs are three times higher for the same number of fired hours if the unit is started every fired hour, instead of starting once very 1000 fired hours. “Peaking” at a 110% rating increases maintenance costs by a factor of 3 relative to base-load operation at rated capacity, for any given period.
The control system on combined-cycle units is automatic. When an operator starts the unit, it accelerates, synchronizes, and loads “by itself.” Fewer operators are required than in a steam plant.
Trends in Global Combined-Cycle Installations
A few hundred power generation plants are ordered from about a dozen OEMs every year. This means the market is exceptionally competitive. Given that most of the new plants are going into newly developing countries, the biggest factor in determining the winner of each project (bid on by several OEMs or not) is the financial deal the OEM can put together for the end-user.
As one might expect, maintenance costs are higher for any type of plant in countries that have not had as much exposure to the OEMs’ technology. As a significant extension of their revenue, OEMs offer overall “power by the hour” maintenance contracts. These costs vary, even for the same basic modular configuration and mechanical design, depending on the location’s demographics. So then will the actual and contractually set “cost per fired hour” figures. There is a significant difference between what actual operational costs are for the same OEM’s CC block in a well-developed area of the United States and a remote area in Azerbaijan, for instance. Demographics also alter construction costs. (As an illustration, in 1990s figures, costs varied from $592/kW for a new 1080 MW combined-cycle plant in Egypt to $875/kW for a steam addition to convert four gas turbines in Pakistan to a combined-cycle plant, according to World Bank data.) OEMs are aware that end-users compare cost data at various meetings and forums and that price variations are a sore and much negotiated point. Therefore, OEMs continually strive to optimize designs and assembly methods to minimize the steepness of new operators’ learning curve.
“Modularization” (for instance, the Siemens Westinghouse GUD block, which is two V94.3 gas turbines, their HRSG boiler capacity, and a steam turbine) reduces construction costs. Compared with the customized design and construction, modularization can reduce project costs of detailed engineering, material price contingencies, and financial loan interest during construction.
Downsizing power delivery (to the grid) requirements changes overall operational cost figures. “Repowering” changes operational statistics significantly. Repowering is a term used to define the reconfiguration of a power station. It may mean replacing a steam turbine with a gas turbine or combined-cycle unit. One example of a repowering option offered by an OEM is Alstom combining its 181 MW GT24 gas turbine with a dual pressure reheat cycle consisting of a 70 MW LP/IP steam turbine and a 20 MW HP steam turbine, to generate a total of 270 MW.
The most common configuration (Figure 3–21) is called parallel powering, where the gas turbine exhausts are used in the existing steam cycle. This is achieved by feeding the exhausts into a heat-recovery steam generator, which provides additional steam to the existing steam turbine. Typically, parallel powering requires the addition of a gas turbine, associated electrical and instrumentation and control equipment, civil engineering, HRSG, additional piping, and pumps, as well upgrading the steam turbine. Generally, parallel powering can be undertaken separately from the existing part of the plant, with a final integration phase and a plant downtime of 1.5–2 months. The typical cost range is $300–500/kW.
In some cases, national or international markets alter a power plant’s budget by changing available fuels. An example would be the United Kingdom’s temporary moratorium on their indigenous natural gas (which promoted coal for that period). When the decision was made to allow North Sea petrochemical liquid deposits to vaporize and be delivered as gas instead, that move created operational ripples in all industries that used petrochemical fuel, including power generation.
Since the late 1980s, market growth in plant additions and optimization technology retrofits has shifted, in part, from Europe, North America, and Japan to newly industrializing countries in Asia and Latin America. Financial means keep many of the end-users in these regions from using newer technologies that would extend their power generation capacity and reduce their costs per fired hour. Nevertheless, they are becoming increasingly aware of these design developments and seek to incorporate them where and when possible.
For the OEM, the main challenges are minimizing project cost, construction time, and risk guarantees (Figure 3–22). Between the 1980s and 2000, project cost and construction time of coal- and gas-fired units dropped by 50%. However, to compete, OEMs must offer better warranty packages. So the standardization of core design to minimize spare costs and make factory assembly methods and repair and overhaul methods “foolproof” increases in importance.
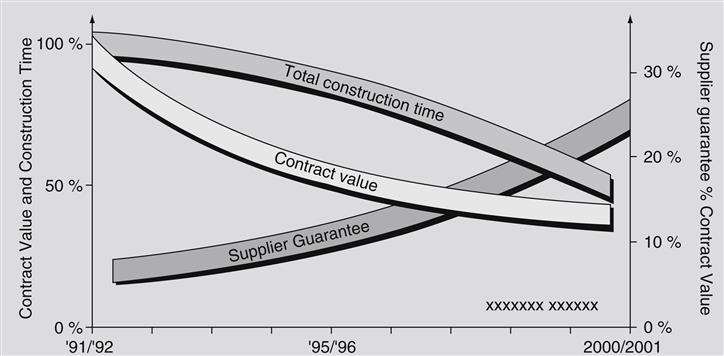
Table 3–5 shows the cost breakdown for combined-cycle plants (350–700 MW capacity) based on Siemens experience in the following categories: integrated services (project management or subcontracting; plant and project engineering or project management software, plant erection, commissioning, and training; transport and insurance) and lots (civil works, gas- and steam-turbine and generator sets, balance of plant, electrical systems, instrumentation and control systems, and the boiler island).
TABLE 3–5
Cost Breakdown for CC Power Plants
| Integrated Services | 4% | Project Management/Subcontracting | |||||
| 2% | Plant and Project Engineering/Software | ||||||
| 8% | Plant Erection/Commissions/Training | ||||||
| 1% | Transport, Insurance | ||||||
| Σ15% | |||||||
| Lots | Civil Works | Gas- and Steam Turbine Set | Balance of Plants | Electrical Systems | Instrumental and Control | Boiler Island | |
| Σ85% | 15% | 32% | 16% | 7% | 4% | 11% | |
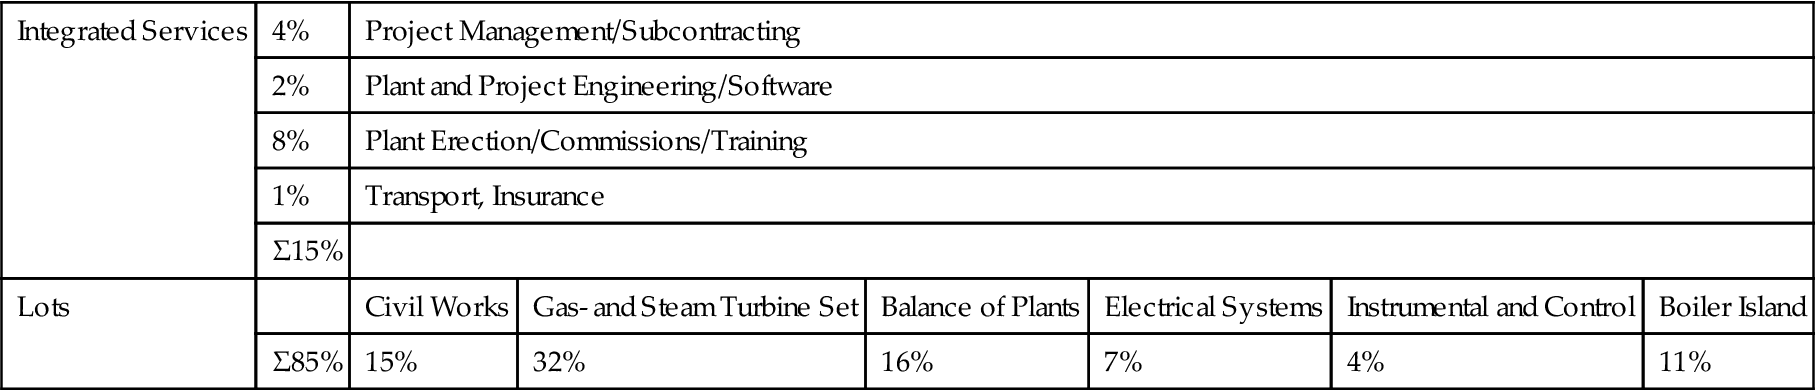
Basis: 350/700 MW CC Plant with a V94.3A Gas Turbine.
(Adapted from [3-4].)
Trends in the Power Generation Market
From 1994 to 1999, power plant contract awards for fossil fuel-fired power plants (above 50 MW) averaged 63 GW per year. In 1999, sales were forecasted to average about 67 GW per year over the period 1999–2004. The market in the Asia Pacific Basin was declining, while showing a moderate growth in Europe and (starting from a low level) strong growth in North America.
In comparison with coal-fueled power plants, open and closed cycle power plants are characterized by lower investment costs. However, US fuel-related costs (i.e., fuel price and plant efficiency) have changed with the rise in oil and gas prices in the United States, which was precipitated by the Iraq War and Hurricane Katrina. At the turn of the century, gas prices ranged from about US$2.0/GJ to US$4.5/GJ, with the North American prices being at the lower end of the range.
The only fact that anyone can attest to, in terms of oil and gas prices in 2006, is that they will go up. One Canadian forecast agency suggests that gas prices in 2006 in Canada will stay at about C$8/GJ. This then means that the fierce inter-OEM rivalry with respect to fuel efficiency will escalate.
Three major infrastructure changes continue to drastically alter the face of the power generation industry and directly or indirectly promote technological innovation. They are:
• Deregulation. This means that independent power producers (IPPs), and some of them small power producers (SPPs), help make large plant new construction or expansion unnecessary. Consider the earlier examples of the PCS company’s use of what were Alstom Power GT10s (this model was part of the Siemens' acquisition of Alstom’s smaller engine divisions) in combined-cycle operation. The waste hydrocarbon fluids they used as fuel helped further develop the low-Btu fuel technology experience. Many SPPs can sell their excess power back to the utility grid.
• Oil companies as IPPs. Shell in the United Kingdom is a good example of a growing trend. As IPPs, oil companies can be their own customer for their oil and gas. This then short circuits much of the fuel purchase agreement contractual formalities that other IPPs have to negotiate.
Integrated Gasification Combined-Cycle (IGCC) Plants Integrated gasification combined-cycle (IGCC) plants consist of three main sections:
• The “gas island” for conversion of coal or refinery residues (such as heavy fuel oil, vacuum residues, or petroleum coke). This includes gasification and downstream gas purification (removal of sulfur and heavy metal compounds in accord with required emissions levels).
• The combined-cycle plant. The modular design (gas generation, gas turbine system, HRSG, and the steam turbine system) allows phased construction as well as retrofitting of the CC plant with a gasification plant. This replaces the “standard” gas turbine fuels (natural gas or fuel oil) by syngas produced from coal or refinery residues.
IGCC is a combination of two proven technologies; however, proper integration depends on using the lessons learned from several demonstration projects in Europe and the United States. Currently, more than 350 gasifiers are operating commercially worldwide and there are at least seven technology suppliers. About 100 CC unit plants are ordered per year, but there is limited experience in IGCC commercial operation. Currently, we refer to operating experience at five IGCC plants: the 261 MW Wabash River plant, the 248.5 MW Tampa plant, the 253 MW Buggenum plant, the 99.7 MW Pinon Pine plant, and the 318 to 300 MW Puertollano plant. IGCC will see commercial application in developed countries, such as Italy, for residual refinery fuels and gasified coal. However, great care needs to be taken in implementing a commercialization strategy for developing countries.
Through 2015, the potential for refinery-based integrated coal gasification combined-cycle plants is estimated to be 135 GW. Currently, over 6 GW of coal- and refinery residue-based IGCC projects are either under construction or planned.
Technology, Performance, Environment, and Demand Trends
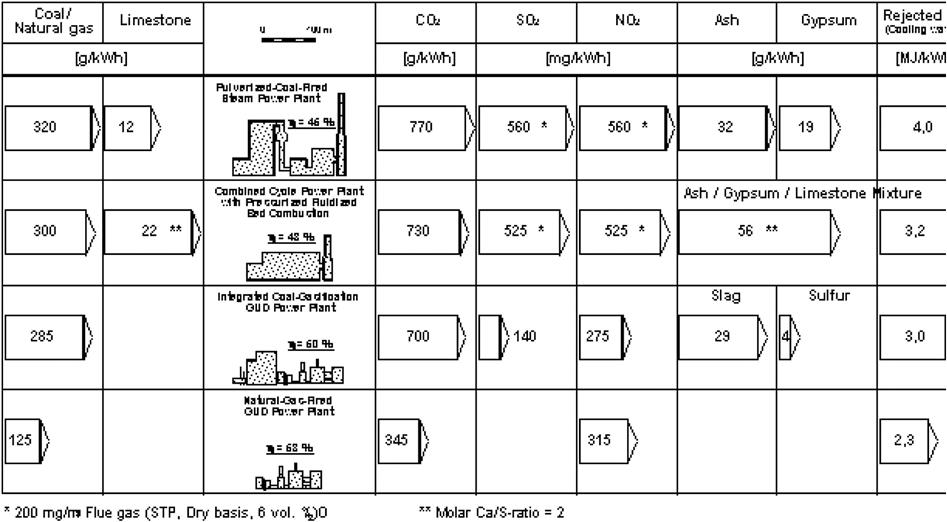
Figure 3–23 compares the supply flows, emissions, and by-products of different 600 MW-class plants. With environmental emissions (including greenhouse gases, GHG), IGCC plants compare well with pulverized coal-fired steam power plants.
Depending on the degree of integration between the gas turbine and the air separation unit (ASU), either standard gas turbine or compressor configurations can be applied. If not, the mismatch between turbine and compressor mass flows, which results from the application of gases with low heating values, requires limited modifications to compensate.
Three options are available. The selection of the appropriate air and nitrogen integration concept depends on a number of factors, to be considered on a case-by-case basis. A summary of the important criteria is provided in Figures 3–24 and 3–25.
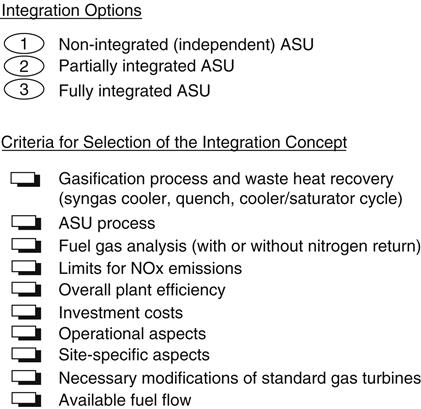
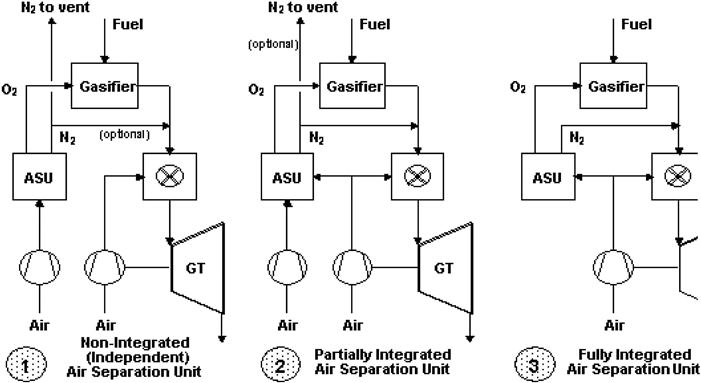
Figure 3–23 sets out the principal criteria for selection of the different IGCC integration concepts. The “fully integrated approach” (selected for the European coal-based demonstration plants) results in the highest efficiency potential, but it can prove more difficult to operate. Nevertheless, after some initial operational problems, the Buggenum IGCC facility demonstrated that the design can provide good availability.
The nonintegrated concept with a completely independent ASU is simpler in terms of plant operation and possibly in achievable availability. However, the loss in overall IGCC net plant efficiency compared with the fully integrated concept is 1.5–2.5%. So this concept is of interest for applications where efficiency is not the key factor (e.g., for the gasification of refinery residues).
The concept with partial air-side integration is a compromise, with only a moderate loss in efficiency but improved plant flexibility, when compared with the fully integrated concept.
What follows are some examples of gas turbines that can be incorporated into combined-cycle packages. The Siemens SGT6-5000F (198 MW, 60 Hz) operates under simple cycle, combined-cycle, and other cogeneration applications. The SGT6-5000F gas turbine has more than 1 million hours of fleet operation. It can be used in either simple cycle or heat recovery applications, including cogeneration, combined cycle, and repowering.
The SGT6-5000F provides online generation for peaking duty, intermediate operation, or continuous service.
The SGT6 5000F’s technical features include:
• A 16 can-type combustors in a circular array
• A 16-stage axial-flow compressor with advanced 3D design technology
• Optional multiple fuels capability
The Siemens SGT5-2000E (163 MW, 50 Hz) operates under simple or combined cycle and other cogeneration applications. The SGT5-2000E is used for simple or combined-cycle processes with or without combined heat and power and for all load ranges, particularly peak-load operation. For integrated coal gasification combined-cycle applications, Siemens provides the SGT5-2000E (LCG) machine, a 2-type machine with modified compressor. The SGT5-2000E has more than 120 units in operation, accounting for approximately 70,000 starts and more than 4 million operating hours.
The SGT5 2000E’s technical features include:
• Two walk-in combustion chambers for hot-gas-path inspection without cover lift
• Combustion chambers lined with individually replaceable ceramic tiles
• A 16-stage axial-flow compressor with variable-pitch inlet guide vanes
• Optional fast inlet guide vanes for peak-load operation and frequency stabilization
• All blades removable with rotor in place
• Hybrid burners for premix and diffusion mode operation with natural gas, fuel oil, and special fuels, such as heavy oil and refinery residue
Case Study 1: An End-User/EPC Contractor’s Experience with Some of the OEMs’ Latest Gas Turbine Models in Power Generation Service10
The writers cover EPC experience gained using “FX” (a generic term for advanced “F” technology) and “G” class GTs. This equipment was provided by major GT suppliers, such as General Electric (GE) (7FA, 7FB, 9FA), Alstom (GT26), and Siemens-Westinghouse (501FD, 501G, V94.3A2). This case illustrates the potential economic implications of using gas turbine technology that is still relatively new.
Revolutionary (“Grassroots” New) versus Evolutionary (Based on a Known Core) GT Changes
Brand New Models
In recent years, the heavy-duty GT industry made important technical strides to cater to the all-important combined-cycle power plants market. The introduction of the “G” and “H” technologies, offered currently by manufacturers, creates an inseparable thermodynamic and physical link between the primary and secondary power generation systems by using steam (in lieu of air) in a closed loop to perform most, if not all, GT cooling.
These new GT designs rely on an evolutionary process using a proven existing design base and manufacturers’ accumulated expertise. However, to achieve substantial performance improvements and meet stringent low-emissions requirements, major design changes or even new designs must be implemented.
Note the “cross pollination” between stationary and aeroengine designs. The aeroengine manufacturers, such as Pratt & Whitney and Rolls Royce, entered into commercial agreements with heavy-duty GT manufacturers, such as Siemens-Westinghouse and Alstom. The GE R&D group and Aero-Engine Division likewise played an important role in GE Power Systems’ heavy-duty GT development. Compressor and turbine aero-design, air and steam cooling, combustors, and intake and exhaust systems are just a few examples of this type of technology transfer.
The development process requires individual component testing for all major GT features, including the compressor, combustion system, and turbine. Despite extensive multiphase validation and integration programs, all new GTs have exhibited many “first of a kind” technical challenges in the field. Table 3–6 summarizes some of the issues publicly acknowledged by the manufacturers. OEMs, EPC contractors, and insurance carriers all paid a hefty price to correct these problems in the field.
TABLE 3–6
Partial List of Gas Turbine Problems Experienced at Introduction Phase [3-6]
| Component | Problem | Equipment Type |
| Compressor | Tip rubbing | MHI-M501G |
| Second stage stator—high cycle fatigue cracks | SWPC-W501G | |
| Vibrations | SWPC-501G | |
| Combustor | High metal temperature—transition piece inlet |
MHI-M501G |
| Flashback | MHI-M501G, Siemens V84.3A, Alstom GT24/26 | |
| Cracks in transition panel or transition piece outlet | MHI M501G, SWPC W501G | |
| Combustion oscillations | SWPC W501G, Siemens V94.3A2, GE 7FA, Alstom GT24/GT26 | |
| Liner overheating | Alstom GT24/GT26 | |
| Turbine | Shorter useful life of nozzles and blades | All |
| TBC problems | All | |
| LPT first row cooling | GT24/GT26 | |
| LPT second row shroud | GT24/GT26 |
Manufacturers (including Alstom, Siemens, and MHI) established their own in-house (load) test facilities to evaluate equipment performance in a completely controlled environment and identify potential problems earlier. Others selected the alternative approach of using power plants as validation sites, where plant owner(s) allow the OEM to conduct tests using additional instrumentation and to implement changes in exchange for special commercial arrangement. Table 3–7 lists test facilities for major manufacturers.
TABLE 3–7
Testing Facilities for Advanced Gas Turbines [3-6]
| Manufacturer | Location | Type of Gas Turbine | Remarks |
| Alstom | Birr, Switzerland | GT26 | In-house test facility with generator |
| Siemens-Westinghouse | Berlin, Germany | V84.3A2 501 FD | In-house test facility with water brake |
| Siemens-Westinghouse | Lakeland, FL US | 501G | First installation—validation site |
| Siemens | Cottam, United Kingdom | V94.3A2 | Demonstration site |
| MHI | Takasago, Japan | M501G, M501H | In-house verification plant with generator |
| GE | Baglan Bay, United Kingdom | 109H | “H” system—validation site |
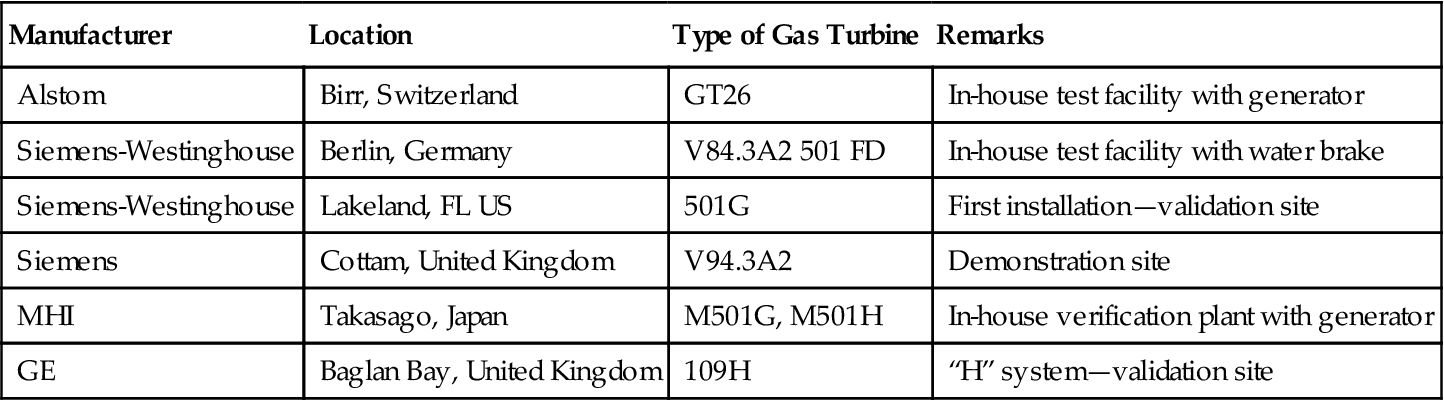
The testing of the equipment at these facilities is useful in identifying short-term issues for validating compatibility of various components and optimizing performance. Many solutions for the dry low-NOx (DLN) combustor problems were worked out at these sites, where complete combustion systems could be tested.
Testing of the complete GT (compressor, combustor, and turbine) is necessary to validate the combustion system design, since rig tests alone are not sufficient to determine the interaction between individual components. Note that the test facility cannot replicate the actual operating condition(s) (fuel variability, load following requirements, and extreme ambience) of other locations and the machine’s long-term behavior.
Existing Model Upgrades
It is typical of OEMs to upgrade and improve the thermal or mechanical performance of their existing models. This, however, poses a very interesting question—should these upgrades be treated as “tweaks” or as brand new models? A good example involves the GE 7FB and Siemens-Westinghouse 501 FD models, which provide thermal performance far superior to that of the original “F” models.
The evolutionary process for the GE “F” technology class is illustrated in Figure 3–26. The power output increased from 150 MW to 174 MW and the heat rate improved by about 7% over a period of 10 years. The major changes include increased airflow and pressure through the compressor and higher firing temperature resulting from use of better materials for the turbine blades and nozzles (single crystal).
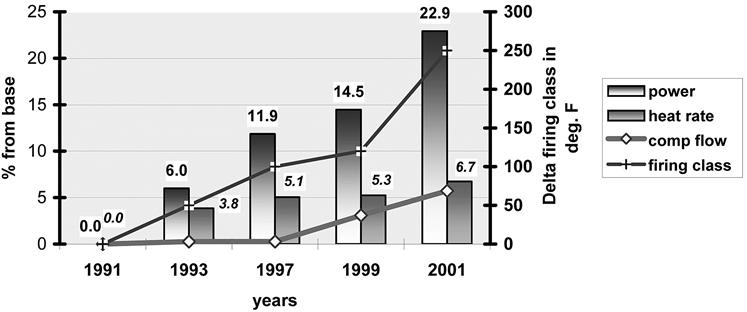
The two tracks of performance betterment—brand new models and existing model upgrades—interact. Many of the improvements from the “H” class of GT are flowing back to the “F” and “G” class equipment.
The most recent examples include the GE 9FB’s implementation of many GE “H” system features, and the MHI M701G2’s superior performance over that of the original M701G GT, based on M501H technological enhancements.
When GT development work had to be carried out in the field, the manufacturers stood behind their products and provided the needed support until the issues were solved. Performance shortfalls and schedule were dealt with through the contractual commercial agreements.
Role of the EPC Contractor
Equipment Selection
An experienced EPC contractor remains technology neutral but proactive in identifying the best available technology meeting owner requirements. Therefore, before selecting the equipment, the EPC contractor must understand the owner’s pro forma objectives for plant output, heat rate, reliability, availability, and emissions requirements.
The process entails a comprehensive technology assessment with the supplier and other previous users of this technology. The performance offered by the OEMs for a specific project must be normalized and correlated with the performance of the same GT, achieved at other executed projects. The analysis should also include a comparison with other OEMs’ competitive products.
The EPC contractor creates an in-house database for field test data. Figure 3–27 summarizes test data from 29 units recently completed by Bechtel and includes all major manufacturers.

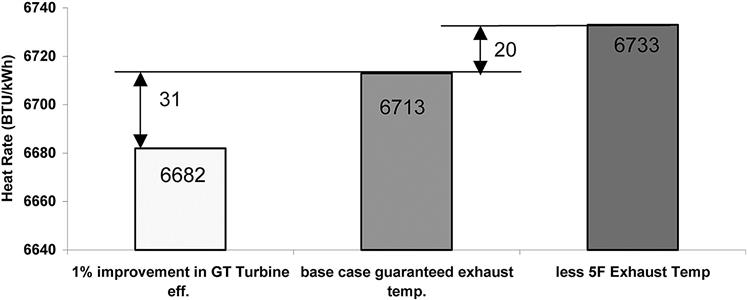
In addition to the power output and heat rate, the major issue related to evaluation of GT performance in combined-cycle applications is quantification of the GT exhaust flow and temperature. All four of these parameters for a GT are heavily interdependent. For example, a GT that exceeds the guaranteed power output usually has a better-than-expected component efficiency, particularly for the turbine section. As a result, the exhaust temperature is lower. A lower turbine exhaust temperature has a negative impact on the heat recovery steam generator’s steam production and steam turbine output. Conversely, higher GT exhaust energy has a positive impact on ST output.
No GT meets all four guarantees concurrently. When establishing the HRSG and ST design conditions, it is good engineering practice to allow for some variability of GT exhaust flow and temperature. This way, the design could accommodate either shortfalls or better-than-guaranteed exhaust energy (flow and temperature) of the GT.
Figure 3–28 quantifies the effect on the combined-cycle heat rate, due to a 5°F lower exhaust temperature and a 1% better turbine section efficiency. Figure 3–28 also shows that, for the same firing temperature, a 1% improvement in GT performance overcomes the performance loss due to a 5°F shortfall in exhaust temperature and still results in 11 Btu/kWh (0.16%) improvement in combined cycle heat rate. These numbers may vary for different GT makes and models.
To properly assess the impact, owners or operators need to either hire an EPC contractor experienced in purchase, have a reservation agreement for a GT or power island (PI), or have the appropriate skills secured from a different source. The EPC contractor can verify:
• That terms and conditions essential to managing project design, construction, and commissioning are adequately covered in these agreements.
• That the scope is complete and all interfaces are well defined.
• Assuring adequate coverage of performance test tolerances and measurement uncertainty.
• Addressing the impact of GT performance offsets (between power output and exhaust energy) on HRSG and ST sizing.
• Ensuring consistency in pollutant levels and units included in the plant permits and those guaranteed by GT suppliers.
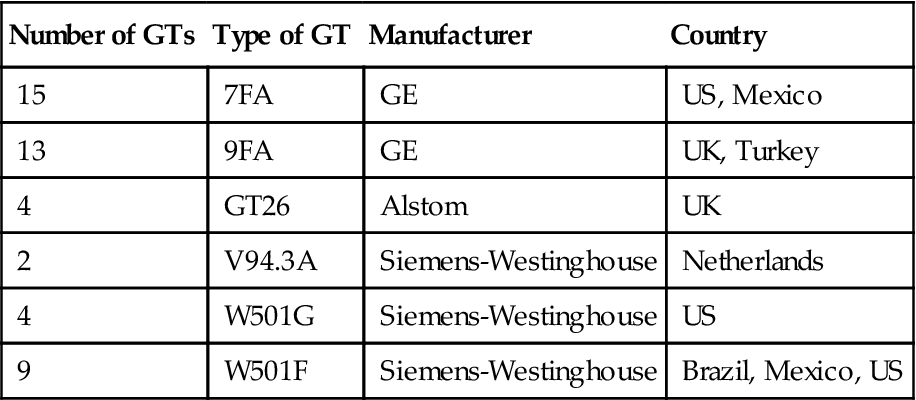
Table 3–8 lists technologies and locations for various projects around the globe involving GTs from three major suppliers.
TABLE 3–8
List of Projects with Three Major OEMs and Bechtel Participation [3-6]
| Number of GTs | Type of GT | Manufacturer | Country |
| 15 | 7FA | GE | US, Mexico |
| 13 | 9FA | GE | UK, Turkey |
| 4 | GT26 | Alstom | UK |
| 2 | V94.3A | Siemens-Westinghouse | Netherlands |
| 4 | W501G | Siemens-Westinghouse | US |
| 9 | W501F | Siemens-Westinghouse | Brazil, Mexico, US |
Power Plant Configuration
The most common configurations (as noted in Chapter 10 on performance) include:
Some of the advantages of the 1 × 1 configuration are pointed out in the chapter on performance as well and include:
Design Challenges
Emissions
GT designers have to balance two contradictory requirements: better performance and lower plant emissions. On the one hand, to achieve higher output and better heat rate, OEMs have to increase the firing temperature or the airflow through the machine, thus leading to higher amounts of pollutants. On the other hand, regulatory agencies in the United States require ultra-low emissions of less than 2.5 ppm for NOx, CO, and ammonia slip.
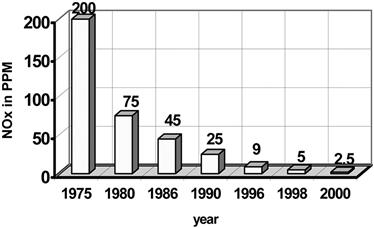
Power plants based on either “F” or “G” technology cannot meet the ultra-low emission level without postcombustion emissions control methods. Figure 3–29 depicts the history of tightening NOx emissions requirements at the stack in the United States.
Post-combustion devices, such as selective catalytic reduction (SCR) for NOx and CO oxidizer for CO and volatile organic compounds (VOCs), are commonly used. They add complexity and cost and lengthen the startup schedule. In some “G” class machines, the effectiveness of the SCR must be over 90% to meet the 2.5 ppm NOx stack emissions limit.
Fuel
Due to the higher cycle pressure ratio, the “G” GT needs higher fuel pressure at the GT interface flange. Because the gas pipeline pressure typically is lower, a suitable fuel compression system with associated interfacing controls is required. A filtration and purification system also is necessary to avoid entraining droplets of liquid lubrication oil (heavy hydrocarbons) in the gas. Premix combustion systems are very sensitive to the presence of heavy hydrocarbons in the fuel, causing premature ignition “flashback.” From a reliability viewpoint, fuel system redundancy is an important consideration in selecting the fuel gas compressors.
In combined-cycle applications, it is common to preheat the fuel with hot water or steam to improve the plant heat rate. However, the fuel preheating system has been an issue for some new GTs, mainly due to combustion oscillations.
Cooling Steam Quality and Blowdown Design
In “G” technology, intermediate pressure steam cools combustion transition ducts. The use of steam as a cooling medium calls for special attention to achieving and maintaining the specified steam quality. While the steam quality requirements (silica, sodium, chlorides, and total organic compounds, or TOCs) for advanced GTs using steam cooling are no more stringent than the normal steam quality requirements of a combined cycle, deviations or excursions from the requirements can lead to serious consequences.
To avoid such situations, state-of-the-art reverse osmosis or electrodialysis ion exchange demineralizer water treatment systems have been used. Special attention should be given to the transient conditions during startup and power ramping. In these modes of operation, drum water characteristics, especially pH, are difficult to control.
As a result, passivity films can be removed, corrosion products can be displaced, internal treatment chemicals can be over- or underfed, and finally, steam purity can be compromised. Exceeding equipment manufacturers’ limits poses a significant risk to the owner-operator.
Balance of Plant Issues
Proper system integration is vital to achieving guaranteed performance. System integration via balance of plant (BOP) equipment and interconnecting or support systems is the key that enables the GT, HRSG, and ST to operate smoothly and efficiently at all design loads and configurations.
While the BOP requirements for the new generation of GTs are no different than earlier GT designs, the larger size of BOP systems (amount of circulating water, steam, air, and fuel) warrants careful attention.
In several GT models, the cooling air circuits include external heat exchangers. This process increases the overall efficiency of the plant by utilizing the rejected heat in the steam cycle rather than dissipating it in the atmosphere. However, the mechanical layout design and control of the associated piping for air and steam are challenging tasks.
A majority of the recently completed plants using advanced GTs are merchant plants (MPPs) and dispatch only when competitive. Accordingly, the BOP design should respond to cycling operation requirements.
The selection of an optimum heat sink is site specific, since it is based on many variables, such as site configuration, water availability, water disposal, ambient conditions, level of target power output, anticipated hours of operation, the power purchase agreement structure, and the owner’s economic evaluation factors. Table 3–9 lists the heat sinks selected by Bechtel for some recent projects.
TABLE 3–9
Types of Heat Sink Used for Various Projects [3-6]
| Number of GTs | GT Type | Heat Sink Type |
| 1 | 9FA | Once-through seawater |
| 2 | 9FA | Cooling tower |
| 5 | 9FA | Indirect dry cooling—Heller type |
| 2 | 9FA | Air-cooled condenser |
| 4 | GT26 | Air-cooled condenser |
| 1 | W501G | Cooling tower |
| 3 | W501G | Air-cooled condenser |
| 7 | W501FD | Cooling tower |
Construction and Field Problems
Startup
EPC contractors generally are responsible for plant startup. Significant penalties are assigned if timely operation is not achieved.
Dual-Fuel Operation
Typically, advanced GTs use natural gas as the primary fuel. Duel-fuel capability, using distillate oil, is attractive to many customers with interruptible gas supply contracts. However, dual-fuel capability adds complexity to already very complicated combustion systems and controls. A difficult challenge is to achieve switchover from one fuel to another at a reasonably high GT power level.
Implementation of Modifications in the Field
One of the most critical challenges to erection of advanced GTs has been implementation of field modifications. On many occasions, the OEMs used unscheduled outages, not only to correct a problem but also to implement a number of design changes based on lessons learned on other sites. This process created a “ripple effect” requiring additional changes in the plant control software and start sequences.
Combustion System Commissioning and Tuning
To meet strict emissions requirements, all advanced GT combustion systems operate with DLN combustion systems. The combustion process between 70% and 100% load takes place in premix mode with a lean equivalence ratio, which creates a lower localized flame temperature and therefore lower NOx.
The premix combustion operation, in which fuel and air are mixed in advance of the combustion process, is less stable than diffusion flame. It is common practice to use a pilot operating in diffusion mode to provide stability and inhibit the excessive combustion-related pressure fluctuations inherent in the lean premix operation.
The combustion system operation from diffusion mode at low loads to full premix mode at base load takes place in several complicated steps and stages, requiring very close control of fuel flow and exhaust temperature. The process is sensitive to ambient conditions, combustion-associated instabilities, and even physical combustor dimensions, due to manufacturing or assembly tolerances.
Currently, each GT is individually adjusted to meet the performance guarantees and emissions requirements without combustion oscillations. This practice has become a standard feature of the GT commissioning. However, this activity has an adverse impact on the EPC contractor.
The execution schedule is extended to perform a water wash of the compressor prior to the tuning process and to install and remove temporary instrumentation for full-blown GT performance testing. Because emissions limits must be met at all ambient conditions, adjustments made in the field might modify the performance correction curves for ambient temperature.
Low Load Flexibility
Gas turbines tend to run best at peak load. Frequently, however, operating conditions dictate that load varies. Examples include gas turbines used in gas and oil production facilities. Gas turbines driving pumps that extract seawater (from an underground mix of oil, gas and seawater) may not always have the same amount of seawater to move. Similarly, gas turbine driven compressors delivering production gas from a mixed field may not always have the same amount of gas supplied at their inlet and the gas may not always be the same molecular weight either. The implications for load and efficiency of driver and driven units is obvious.
To some degree, loads will also vary on gas turbines in marine service and aeroengines, especially those that drive a propeller. In today’s power generation market, load conditions may also vary.
Due to its broad potential applicability to the global gas turbine fleet, the engineering and testing described in the following case study must be thoroughly validated in the event of wanting to confirm any gas turbine will run at low load.
Case Study 2: An OEM's Development of a Gas Turbine The SGT6-5000F11 (Formerly Known as W501F) Engine
Introduction
The SGT6-5000F (formerly known as W501F) engine has demonstrated an exceptional operational record over the 16-year, 5.7 million fleet hour operational history. Since its introduction in 1993, this F-class gas turbine has undergone continuous development to improve performance, reliability, and operational flexibility and to reduce emissions and life cycle costs. This gas turbine, which was designed for both simple-cycle and combined-cycle (CC) power generation in utility and industrial applications, represented the next model in the successful W501 family. Its design was based on fundamental, time-proven design concepts as well as new concepts and technologies incorporated to increase efficiency, reduce NOx and CO emissions, and enhance reliability. It was designed to operate on all conventional fuels, as well as coal-derived low Btu gas. New technologies were validated for engine application by extensive rig and two full-load engine shop tests, as well as field tests in the initial installation.
Figure 3–30 shows the latest evolution of the SGT6-5000F(4) engine. The 13-stage compressor is connected to the 4-stage turbine by a single tie bolt, and the Ultra Low NOx combustion system employs 16 can-annular baskets. The 213 SGT6-5000F engines currently in service are employed in peaking, intermediate, and continuous duty operation. The fleet has amassed more than 5.7 million operating hours and has demonstrated excellent reliability, availability, and starting reliability.
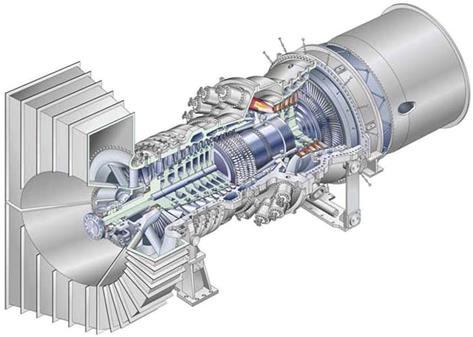
Due to design enhancements, development efforts and technology cross-flow from other Siemens’ advanced gas turbines, the rated simple cycle output has increased from 150 MW to 208 MW and its rated efficiency from 35% to 38+%. In 1×1 CC applications, the rated net plant output and efficiency can now be more than 300 MW and 57.5%, respectively.
The W501G (also known as SGT6-6000G) gas turbine (Figure 3–31) design concept was driven by the changing power market. Between 1993 and 1995, the power market was moving toward deregulation and replacement of aging base load plants, such as coal-based power plants. The market was demanding clean and highly efficient combined cycle plants. Expectations of deregulation in the North American electricity market caused prospective plant buyers to turn to cleaner plants with shorter installation and commissioning times compared to traditional coal plants which had a six year (or more) lead time to permit and build. The belief, expressed by many of them, at that time was that the new high-efficiency, low emissions, clean fuel plants would be the economic and environmental choice and displace coal plants. Because the W501G had a high rated efficiency, it was intended to be operated primarily at base load.
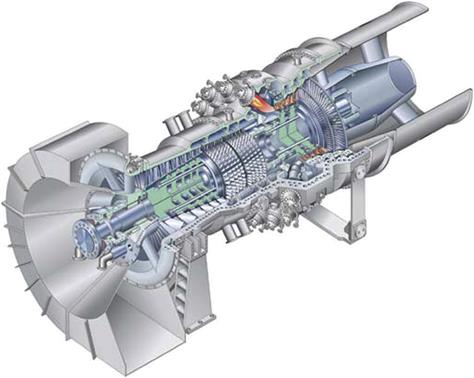
In the late 1990s there was an increased demand for electric power and a relatively low price for natural gas, at one point about $2.50/MMBtu, causing an increased demand for gas turbines for simple- and combined-cycle operation. By 2002, the demand for power was subsiding and some areas were over capacity. Natural gas had increased to above $6/MMBtu and the price for electricity had decreased causing gas turbine combined cycle plants to be operated on the average (based on reported information) at only 30% capacity (higher utilization was reported for advanced frames including the Siemens F & G fleet). The increased natural gas price caused some combined-cycle plants to move lower in the dispatch order causing them to operate in cycling duty mode. In this context, the amount of time some merchant plants can operate profitably may be significantly reduced. In response to the change in market demand for more cyclic operation, design changes and improvements are regularly being incorporated into the SGT6-5000F and the W501G engines.
Market Drivers for Low Load Operational Flexibility
Since the beginning of the power market’s liberalization in the mid-1990s, the power plant business has been changing. Today, many power plant operators can find themselves in a more challenging market situation with the presence of strong competition, higher fluctuation of fuel prices, and in some cases without long-term power purchase agreements. Despite these new challenges, the market liberalization also presents new business opportunities such as the utilization of market price fluctuations for operation and maintenance optimization, participation in ancillary service markets and short-term trading. All of these opportunities can contribute to significantly improve operating margins. By knowing how to approach these opportunities, an operator can in some cases achieve higher profits when compared to operation under a long-term power purchase agreement.
The changed market conditions can have an influence on the operating profile of virtually every power plant. Combined-cycle power plants often do not operate in a base load regime running 8000 hours per year. Many units are operating in a daily start-stop regime with some units starting up twice a day. In this market environment, an economic model that incorporates only a certain amount of base load hours with fixed power revenues will not describe the full picture. Additional earnings from the above-mentioned market opportunities would not be considered. To be more accurate, an extended approach for evaluating a cycling plant with high flexibility is necessary. Key parameters for operational flexibility are, for example, startup time, standby operation, and shutdown time.
From the mid-1990s to 2000, published reports indicated that there was a steady reduction in the US electric power reserve margins. It was believed by some that deregulation and cleaner, more efficient combined-cycle plants would replace aging base load generation stations, such as nuclear and coal-based plants. Increasing demand for electricity and high electricity prices caused a surge in new orders for both simple-cycle and combined-cycle plants. The result was an increase in total generated electricity capacity and reserve margins in all US regions, as well as a decrease in CC capacity factor (defined as the ratio of actual generation to the total possible generation over a time period). The capacity factor reduction led operators to operate in peaking and intermediate modes rather than in the planned base load, thus increasing demand for cyclic operation capability.
Demand growth, economic dispatchability, and operational flexibility are key factors that influence the electricity-generating plant’s ability to improve its dispatch rate (i.e., the order in which it is dispatched as demand for electric power increases during the day). Due to the reported current overcapacity and the increase in reserve margins, the units that excel in economic dispatchability and operational flexibility will dispatch before other competing units. The dispatch order is determined by the unit’s variable production cost (VPC). Fuel cost and variable operation and maintenance (O&M) cost are used to calculate VPC. Small changes in VPC can significantly affect the unit’s dispatch ranking. Fuel cost is directly impacted by the gas turbine’s efficiency, thus increased efficiency improves not only the revenue per megawatt hour but also the unit’s total dispatch hours. Reduced O&M costs will also lower VPC, improve dispatchability, and increase net cash flow. Units that are operationally flexible and can load follow, cycle on and off more economically, which will allow improved dispatchability and a competitive advantage in the current market. Design improvements made in the Siemens fleet of SGT6-5000Fs and W501Gs are intended to help enhance the units’ dispatchability, increase efficiency and lower life cycle costs (hence reduced VPC), and improve operational flexibility.
Design and Implementation
A key issue in operating at lower loads is an increase in carbon monoxide (CO) emissions. When the engines are base loaded, the combustion system operates at a higher firing temperature and most of the CO is oxidized to carbon dioxide (CO2). However, at part loads, the firing temperature is lower and the CO-to-CO2 oxidation reaction is quenched by the cool regions near the walls of the combustion liner. This can result in increased CO emissions at low loads. Hence, these engines were likely operating between 70% and 100% of GT base load. To address this, Siemens has developed a modification to the engine designed to allow the gas turbine to continue to operate at lower loads while maintaining emissions at set levels.
The “low load turndown” design is based on a combination of reducing the compressor airflow and bypassing air around the combustor to achieve higher firing temperature at part loads. Compressed air is bypassed around the combustor into the turbine to increase the fuel-to-air ratio inside the combustor. This along with a combination of inlet guide vane (IGV) and secondary air system controls allows the combustor to operate at higher primary zone temperatures (as compared to non-LLCO configuration) at lower loads thus resulting in improved CO-to-CO2 conversion.
Figure 3–32a is a conceptual schematic for the additional LLCO-specific bleed air bypass system for the G-class engine. It illustrates how—during low load operation—extra bleed air is bypassed from the combustor shell and compressor bleeds into the turbine stages. The approach for the F-class design is also similar with some modifications (additional bleed into the exhaust) as needed for the operating conditions for the F-class engines (Figure 3–32b). Some of the instrumentation (thermocouples, annubars, etc.) that was used during the test to verify operation is also illustrated in Figure 3–32a and 3–32b.
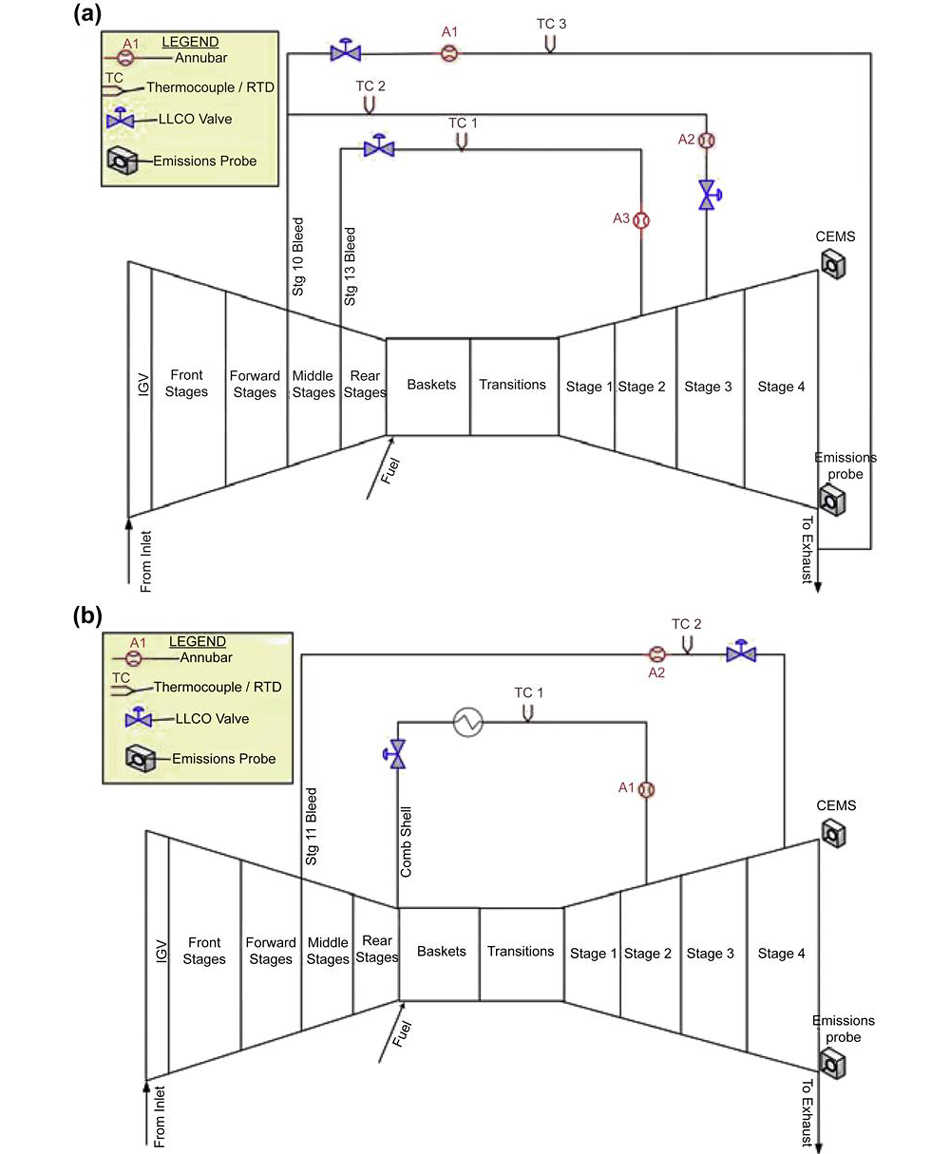
This low load turndown design (also referred to as LLCO for brevity due to improved low load carbon monoxide emissions) was first installed in one of the operating engines of the Siemens G-class gas turbine fleet in October 2007. Subsequently, a slight variation of the design (tuned for frame operating conditions) was installed on an SGT6-5000F operating engine in April 2008.
The installations included modification to the cooling air piping and installation of additional valves (Figure 3–33). Changes were made to the control logic to accommodate the changes to the operation of the gas turbine. Several sections of the gas turbine were instrumented to record the impact of the LLCO product. The same test was conducted on the unit before and after LLCO was implemented in order to obtain a direct comparison of the engine response between the baseline and LLCO operation. A combined cycle emissions and performance test was also conducted in order to measure the differences in emissions and performance between the baseline and LLCO operation.
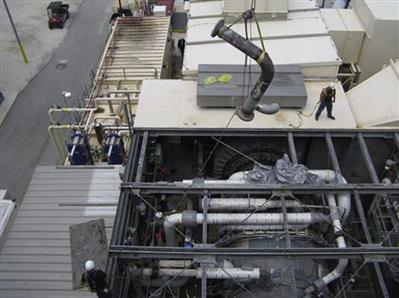
Results
In close cooperation with the customer, Siemens was able to test this design while the engine was in commercial operation. The focus of the test was to turn down the engine to the lowest load possible while maintaining CO emissions at or below 10 parts per million (ppm) (corrected to 15% O2). All the instrumentation was continuously monitored for deviation from pre-set limits.
A maximum turndown of approximately 40% GT load was obtained while maintaining 10 ppm CO out of the engine and the turndown was up to 28% GT load with 10 ppm CO out of the exhaust stack using the CO catalyst. There may be potential methods of further improving the turndown capability at lower ambient temperatures such as combining LLCO with an inlet heating upgrade.
For the W501G engines, LLCO control settings are activated approximately around 28% GT load. At these very low loads, this control methodology was calculated to provide a significant CO reduction during startup and shutdown. Figure 3–34 shows that the CO emissions out of the gas turbine are calculated to drop from about 2400 ppm (corrected to 15% O2) at about 30% load with normal control to about 500 ppm (average) when LLCO is installed. It is also significant to note that the relatively high CO emissions period appears to last for a much shorter load transient. With the normal control (black curve), the high CO emissions are experienced between 30% and 70% GT load. With LLCO implemented, the relatively higher CO emissions transient period is only between 30% and 40% load. This can be particularly beneficial for plants with permit limits capped by total annual CO emissions. Site-specific plant configurations need to be evaluated for use of this product at all startup conditions.
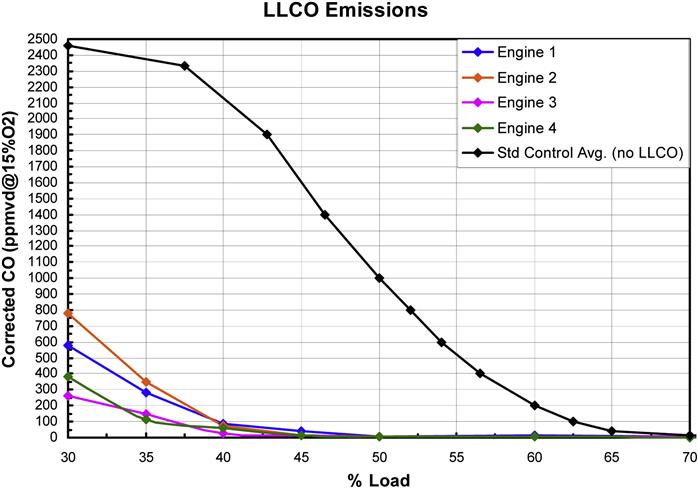
Figure 3–34 shows measured CO emissions data (corrected to 15% O2) after the LLCO upgrade was installed at four different sites (engines). It can be noted that there is some variation between the different sites in terms of CO emissions reduction. It is evident that the CO emission curve is almost exponential to %load at lower load regimes (30–45%). Hence relatively small differences in the engine performance parameters can have a relatively larger impact on the CO emissions.
The steam turbine also operated reliably during these combined-cycle tests. The primary goal was to maintain enough heat input to the Heat Recovery Steam Generator (HRSG) to generate enough steam to keep the steam turbine operational, which was achieved. In the case of the G-class gas turbines, the transition section of the combustion system is cooled with steam. It was also observed that transition steam temperatures were within design operating limits. In certain cases, some control settings or capacity changes may be needed for attemperators to optimize turndown capability.
The impact to the HRSG due to LLCO operation was also evaluated during the test. No apparent failure modes were observed. Furthermore, appropriate steam cycle data from the LLCO tests was evaluated by the HRSG vendors (both from the F- and G-engine tests) using their analytical models. The results of the evaluation were that all “as tested” conditions were within the design criteria and no detrimental impact was reported by the HRSG vendors in their analyses. In fact, one vendor reported that it was their view that LLCO operation could conceivably be better in comparison to daily cycling due to the reduced thermal cycling fatigue.
Validation and Field-Follow
Since the LLCO upgrade was installed it has been extensively used as is demonstrated in Figure 3–35. Before the LLCO upgrade, this unit was reportedly limited to operation between 100% and 70% load and hence was reportedly often shut down during low power demand periods. Now, following the installation of the LLCO upgrade, it has been reportedly turned down to minimum load (∼50% GT load) and left there while the demand is low. When demand for electricity is higher, the GT has been brought to higher loads as needed in a relatively shorter period of time.
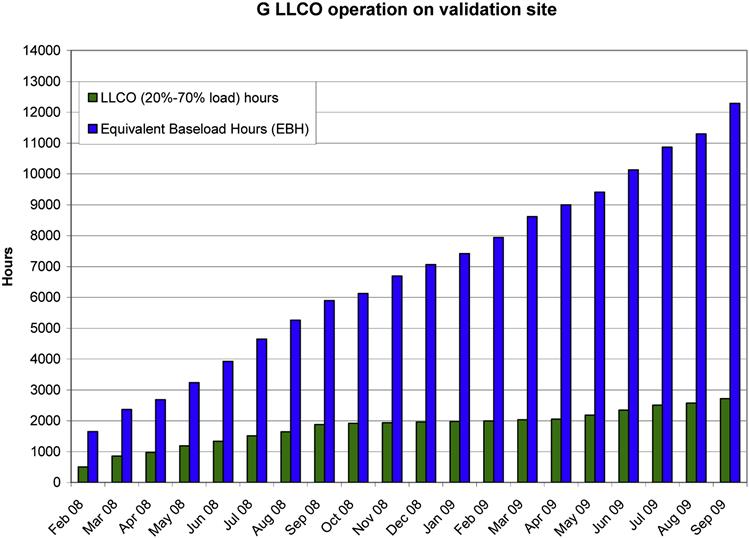
The F-class engines are also accumulating operational hours with this upgrade and continue to take advantage of the turndown flexibility, which allows them to follow the varying demands of the power market.
In the work described by the OEM Siemens (above), that OEM worked closely with the end-user. This dialogue is always beneficial.
It is appropriate now to provide a perspective from an EPC contractor, who may also handle commissioning and operations services for a client. This work is more general in that it covers experience with a number of different GT systems, GT sizes, and therefore varying “N2” (which in this case refers to the minimum number of GTs required to meet the power demand). By “large” this author refers primarily to “G” and “H” sized GTs.
Case Study 3: Operational Experience with Large Advanced Gas Turbines in Variable Load Conditions12
BPST = Back-Pressure Steam Turbine
CC = Combined-Cycle Power Plant
DCS = Distributed Control System
EPC = Engineering, Procurement, and Construction
HRSG = Heat Recovery Steam Generator
Introduction
The unique challenges involved in designing a power generating station to support the special needs of an industrial processing facility are discussed. A conventional combined-cycle (CC) power plant has one basic goal: to produce electricity at a minimal cost for sale to the grid. In industrial facilities (e.g., oil refineries, smelters, and chemical and desalinization plants), electricity and steam produced are for internal use rather than export. Since power and/or steam supply interruptions might have catastrophic effects on facility processes, the paramount requirements for this type of dedicated plant or captive power plant (CPP) are availability and reliability rather than high thermal performance.
In recent years, the advanced H- and G-class GTs, which use steam to perform GT cooling duty, have successfully demonstrated close to 60% efficiency in CC applications and accumulated thousands of operating hours. Many improvements in the G and H class were integrated into the FB and FD class of aircooled GTs. However, industrial applications commonly use older D- and E-class medium GTs as the prime mover. Given that the fundamental purpose of a CPP is different than a traditional power station, this case covers CPP application requirements and the means to optimize these requirements in key areas to support required industrial processes. To illustrate the design methodology, three cases (a refinery, a cogeneration facility, and a smelter) are presented, describing an engineering, procurement, and construction (EPC) contractor’s perspective on the unique industrial application constraints and proposed solutions to meet owner requirements. It also identifies the specific applications in which use of advanced classes of GTs might be suitable.
Refinery Case
Captive Power Plant Concept
A CPP uses same major components as a traditional CC power plant; however, it is designed to achieve a different objective: the production of power and steam is “captured” for industrial use and is only sold to the grid when applicable. The differences between the two types of plants in an oil refinery environment are described below.
Assume a CPP is being constructed to support a new refinery crude train (RCT), which will produce 1 million barrels of oil/day. The oil refining process will require a constant supply of high pressure (HP) steam and electricity. If the steam or power supplies are interrupted or fall outside the narrow band of specified supply conditions, the associated processes could be ruined. As a result, a batch of products will be disposed of, leading to heavy financial penalties. Refer to Table 3–10 for typical CPP requirements. In this case, in addition to using GTs as prime movers, the critical demand for steam will require that additional conventional boilers be incorporated.
TABLE 3–10
Typical Refinery Requirements [3-7]
| Max Design Conditions | Unit | Quantity |
| Site Ambient Temperature | °C | 40 |
| Site Relative Humidity | % | 90 |
| Refinery Power Demand | MW | 650 |
| Refinery HP Steam Demand | Tons/hr | 2500 |
| Refinery IP Steam Demand | Tons/hr | 1500 |
| Refinery LP Steam Demand | Tons/hr | 1000 |
| Refinery Crude Train Production | Barrels/day | 1,000,000 |
| Normal Design Conditions | ||
| Refinery Power Demand | MW | 500 |
| Refinery HP Steam Demand | Tons/hr | 600 |
| Refinery IP Steam Demand | Tons/hr | 800 |
| Refinery LP Steam Demand | Tons/hr | 350 |
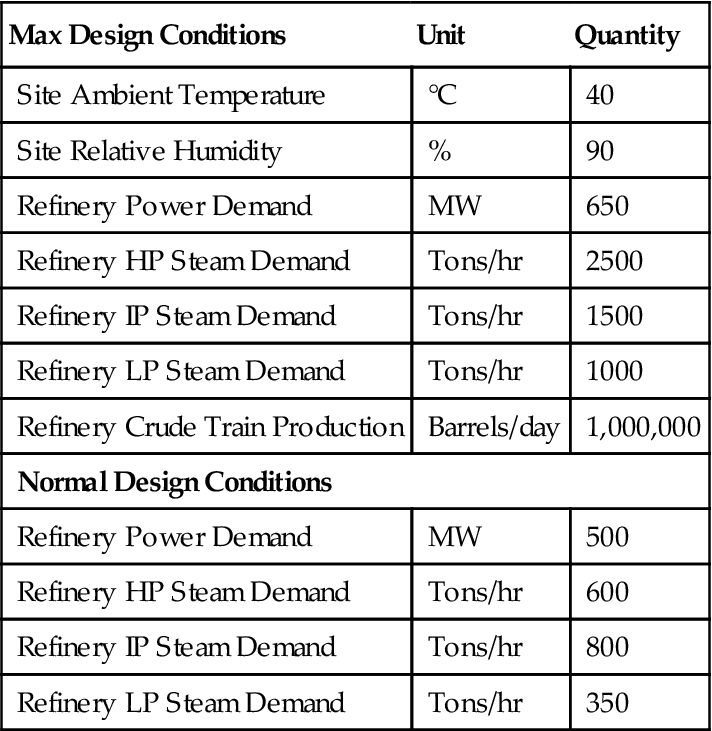
Key CPP Design Criteria
Major design areas to be analyzed include:
Cycle Selection
Optimal CPP arrangements must ultimately be based on specific site conditions, owner’s requirements, and equipment available to meet project schedule. When considering power demand, steam demand, redundancy, reliability, cost, and schedule, the analysis results may vary for different combinations of technologies and operating conditions. In this case, the following design criteria for a typical RCT are assumed.
Power Demand
Early in the evaluation process, it was determined that the refinery electricity requirements could be met by CC components only (GTs and back-pressure steam turbines [BPSTs]). Several combinations were considered to meet the 650 MW power demand. Various GT and BPST candidates and their MW ratings are listed in Table 3–11. The selection of larger frame GTs can decrease equipment quantity, but do not meet the N-2 criteria (minimum number of operating GTs necessary to meet the power demand).
TABLE 3–11
Typical GT and ST Power Ratings [3-7]
| Technology Class | Rating MW (at site conditions) | |
| GT Model 1 | B | 35 |
| GT Model 2 | FA | 60 |
| GT Model 3 | E | 115 |
| GT Model 4 | E | 135 |
| GT Model 5 | E | 130 |
| ST Model 1 | Large | 100 |
| ST Model 2 | Small | 30 |
Due to the large oil production rate (1 million barrels/day) and associated power requirements (650 MW) of the RCT, as shown in Table 3–10, six GT Model 3 units were selected for this application. Ultimately, their relatively large unit power output and operational track record made them the most suitable choice for this application. It is worth noting that GT Models 4 and 5 would also be good candidates. These six Frame E class GTs can produce a maximum of 690 MW of power. An additional 60 MW can be generated by two BPSTs using HP to intermediate pressure (IP) letdown steam. A maximum of 750 MW can be generated, which is far above the required 450 MW power demand for normal operation.
Steam Demand
The high efficiency CC designs incorporate heat recovery steam generators (HRSGs) with either two or three pressure and reheat levels. However, in this case, only single-pressure HRSGs were selected to be coupled with the six GTs for steam production. Each HRSG produces approximately 300 tons per hour (tph) of HP steam at GT base load. Additionally, moderate supplemental firing can increase steam production and add system controllability. If there are minor fluctuations in RCT steam conditions, duct firing can rapidly be adjusted to match the demand.
However, the six GT/HRSG trains do not provide enough steam to meet all RCT demands. Four single-pressure conventional boilers were selected to augment steam production. Each of the four boilers is rated at approximately 300 tph of HP steam. The boilers were sized to match the steam output of a GT/HRSG train. When a GT/HRSG train is down because of a failure or a planned maintenance outage, a boiler can be ramped up to take its place. By producing HP steam at the same pressure and temperature, the HRSG and boilers could be fed into a single common header. HP steam is the primary supply stream to the refinery, but additional low pressure (LP) steam is also needed. To maximize use of the HP stream, HP steam is let down to an IP steam header through two BPSTs, as described above. HP steam is also used for other auxiliary power users (e.g., fan drivers, steam tracing). The steam is then discharged to an LP steam header that is shared with the refinery. See Figure 3–36 for a simplified CPP layout diagram. The use of steam in BPSTs and for other local balance of plant (BOP) customers is more efficient than using pressure relieving desuperheating stations (PRDSs) to let down the pressure.
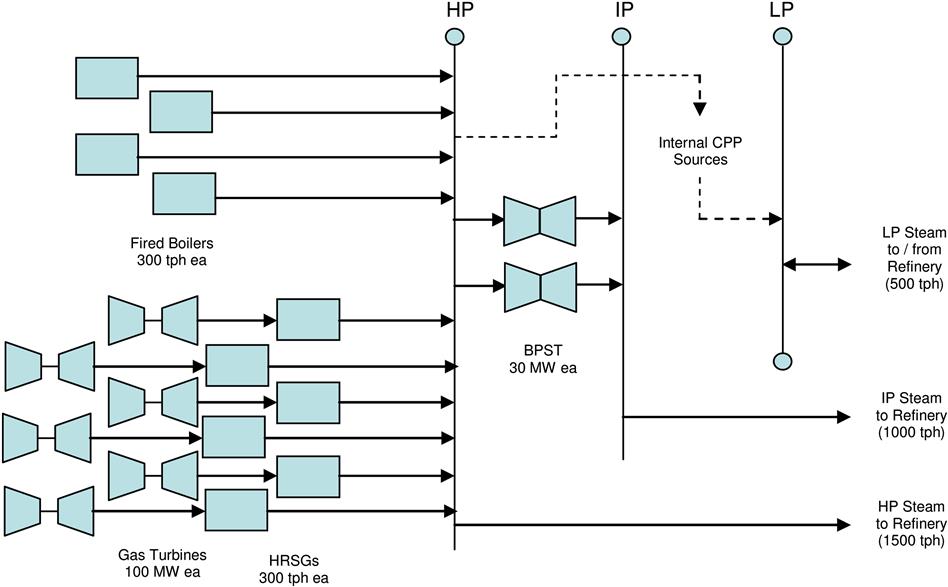
Combining CC and boilers provides the client with the system flexibility necessary to further optimize CPP operation during all possible processing scenarios demanded by the refinery.
Reliability and Redundancy
Reliability is a refinery owner’s highest priority. If the CPP trips, the RCT that it supports shuts down. In this case, the RCT produces 1 million barrels of oil/day, which amounts to substantial financial losses for every day that the unit is not operating. To meet reliability requirements, it is recommended that the CPP be designed for normal operation and have two spares (N-2 concept). This N-2 concept allows for normal operation if two components generating steam or power are down for maintenance or fail simultaneously.
Under normal operating conditions, the power load is 450 MW. Four GTs operating at base load produce 460 MW, which is more than needed. Therefore, the other two GTs can be considered as the spares in the N-2 philosophy. One of the most critical system requirements is the capability to respond rapidly to changes in RCT electric load and steam demand. For this reason, all six GTs run at 60% part load instead of running four at base load and having two shut down. In this scenario, each GT can be quickly ramped up or down to meet the process controllability and responsiveness requirements. Similarly, during normal operation all six HRSGs operate at 90% load and all four boilers operate at 30% load.
Fuel System Design
The fuel system must be able to combust an assortment of liquid and gaseous fuels available in the refinery: natural gas (NG), diesel, distillate fuel oil (e.g., naphtha, light slurry oil, kerosene, etc.), heavy fuel oil, waste fuel oil (WFO) (a bottom distillation column fuel), and refinery fuel gas (RFG). Coal is not included due to economics and availability constraints. Designing the CPP to use fuel oil and RFG decreases operational costs. However, refinery production changes constantly and is not a reliable fuel source. For this reason, fuel supplied to the CPP is stored in large fuel tanks. Once enough fuel has accumulated, it is burned and the tanks are refilled. See Table 3–12 for a list of possible fuels and their selected CPP users.
TABLE 3–12
Possible CPP Fuels and Their Selected Users [3-7]
| GT | HRSG | Boiler | |||||
| Fuel Source | Cost at LHV | Primary Source | Secondary Source | Primary Source | Secondary Source | Primary Source | Secondary Source |
| NG | X | X | X | ||||
| RFG | X | X | X | ||||
| Diesel | X | X | |||||
| Distillate | X | X | |||||
| WFO | X | ||||||
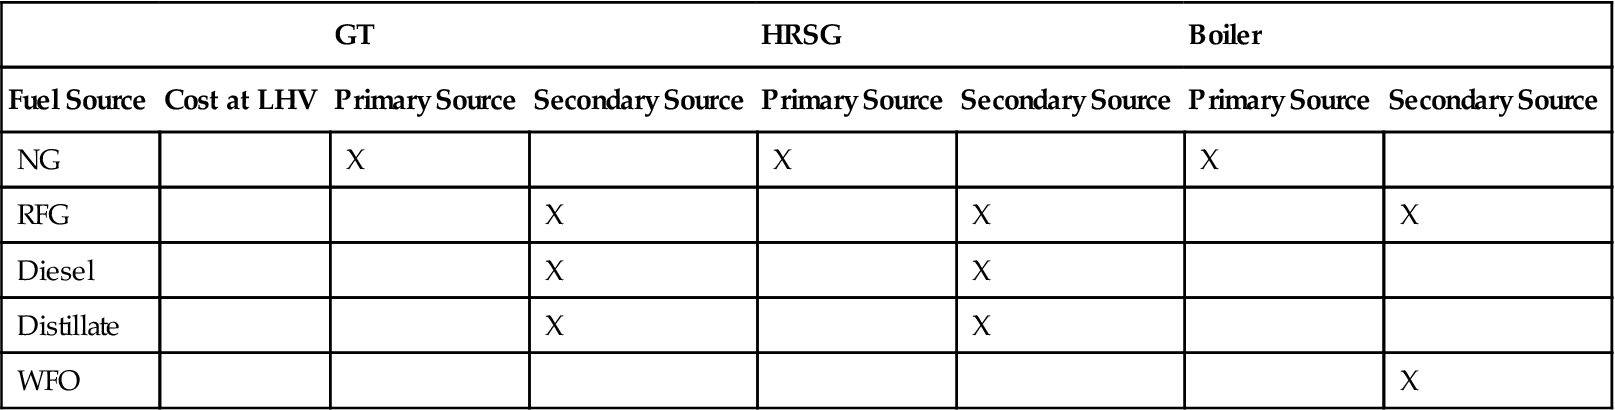
The GT/HRSG trains are designed to fire a different secondary fuel than the boilers. If NG (primary fuel) is unavailable, the equipment switches to secondary fuels. This approach is tied to the N-2 redundancy concept and reliability design requirements.
Auxiliary Equipment Design Considerations
All auxiliary equipment such as fans, pumps, and deaerators is designed in accordance with the N-2 concept. The reliability requirements often drive the CPP components to be redundant (compared to traditional power plants) so that the CPP never experiences total failure. As a result, the cost to build a CPP could be considerably higher than that of a conventional power plant. The additional capital cost associated with the N-2 concept is justified when compared with the penalties related to a refinery shutdown. To minimize the price of the plant, experienced designers must use simulation tools to conduct detailed risk assessments for each component and its integration with other systems. For process optimization, the CPP is designed to use steam, which is an abundant and cost-effective alternative to electricity. Because of the N-2 requirement, a minimum of three pumps or fans is provided for every application. Whenever possible, at least one of these pumps or fans is built with a steam turbine (ST) driver instead of a motor driver. If, for example, there are five feedwater pumps with three normally in operation (N-2 philosophy), then three pumps should be designed with ST drivers and two with motor drivers. By using both streams of energy, the system is controllable, reliable, and does not fully depend on either steam or electricity.
Off-Design Case Operation
The CPP must be able to adapt to (and continuously operate at) 15 off-design cases. For the application defined in this section, the minimum power requirement is 300 MW (corresponding to 1500 tph of steam) and the maximum power requirement is 650 MW (corresponding to 3000 tph of steam).
Unique Control Systems
The CPP DCS must be linked to the refinery DCS. It is imperative that these two control systems be fully integrated and closely coordinated. Instrumentation redundancy is also important. For example, a high temperature element (TE)/temperature transmitter (TT) reading can trigger major CPP operation changes, which could disrupt refinery production. To avoid errors, two-out-of-three logic is used extensively to discriminate between real upsets and false signals.
Transient Behavior
The transient behavior of the entire system, including the steam host and the CPP, must be modeled in an early plant design stage.
Cogeneration Case
Cogeneration facilities pose significant up-front design challenges. The design must balance the requirements of two different customers with dissimilar sets of priorities—one entity demanding electricity and the other needing steam. For the steam host, steam supply reliability at specific flow, temperature, and pressure conditions is of paramount importance. Therefore, process steam requirements need to be identified early, not only for one condition, but for the entire allowable range of operation (nominal, maximum, and minimum). Since the steam production will affect the amount of available electrical power, it is also appropriate to define the number of short- and long-term steam demand changes.
To further complicate the matter, in many cases, the steam demand has more than one pressure level. In the design optimization process, all power and steam requirements must be superimposed to ensure that any predefined steam demand will be met at all operating conditions.
Supplementary Firing
Similar to industrial applications, a popular cogeneration feature is the use of supplementary firing (duct firing) within the HRSG. The reduction in electric power that occurs when process steam demand is increased can be easily overcome by duct firing in the HRSG to generate more steam. Hence, the plant can meet the increased steam demand without reducing the power output. The availability of an additional source of unconventional off-gas fuel (often used by chemical plants for duct firing) would be an ideal application.
Low-Pressure Turbine Sizing
The design team and the owner should size the ST and associated equipment based on the “zero export steam” case. An ST passing all the steam generated will have a larger LP section, larger electrical equipment (generator, transformer, etc.), and a higher electrical output. Economic and thermal performance considerations must be part of the decision-making process.
Reliability and Availability
Since the export steam in many cases is used as the heat source for a chemical or industrial process, its reliability is a primary consideration in equipment selection and plant design. This is a common requirement for all industrial applications. A steam outage could have a devastating effect on the host facility and cause heavy financial losses.
Plant Configuration
During transients, the host imposes other design constraints, which are dictated by the narrow allowable variability range for process steam flow, pressure, and temperature. These constraints and individual component reliability values define the plant configuration options. The first option comprises multiple identical trains (1 × 1 × 1) operating independently. The second option involves a single ST, with common steam headers fed from two or three HRSGs and their respective GTs (2 × 2 × 1 and 3 × 3 × 1).
Boiler feedwater purity and steam quality issues need to be carefully addressed throughout the range of planned operation.
Aluminum Smelter Case
Since aluminum smelting is energy intensive, most of the world's smelters are located in areas that have access to abundant power resources (hydro-electric, natural gas, coal, or nuclear). It takes 15 MWh of electric power to produce one ton of aluminum. Many locations are remote and the electricity is generated specifically for the aluminum plant by a CPP. A smelter comprises a large number of pots (steel containers with carbon lining). The product of the chemical reaction of the aluminum oxide under high temperature conditions is molten aluminum. Given that the smelting process is continuous, a smelter cannot be easily stopped and restarted. If production is interrupted by a power supply failure that lasts more than 4 hours, the metal in the pots solidifies, often requiring an expensive rebuilding process. From time to time, individual pot linings reach the end of their useful life, and the pots are taken out of service and relined. In order to avoid the grave consequences of pot solidification, redundant power must be considered.
Many of the design features for an oil refinery are also applicable to smelter applications (common steam header and supplementary firing [to compensate for power loss due to ambient conditions]) and have been addressed earlier in this section.
N-2 Criteria
Before selecting equipment from different suppliers, a thorough investigation is necessary to ensure that the special requirements of the process are met for power output, operational flexibility, reliability, and availability based on N-2 criteria, etc. The normal reliability of GTs for this application (including scheduled maintenance) is close to 96%.
The calculated reliability of multiple units indicates that a 4 × 50% configuration will yield a reliability of 0.99998%, whereas a 2 × 50% configuration will yield a reliability of only 0.97%. The high reliability does not come cheap. In order to justify backup power, many projects opt for an N-1 configuration during time periods when scheduled maintenance is not required. Given the importance of N-2 criteria, special consideration is given to selecting GT size and CC configuration. An example of the procedure is given in Figure 3–37. The Y axis represents the percentage of excess power above the target value for a given plant configuration. The target value is the minimum power requirement for the plant. The X axis represents different configurations. It can be seen that a configuration of two blocks of 2 × 1 (two GTs and one ST) plus two GTs in simple cycle will have a margin of 11.3% above minimum power in an N-2 operational scenario. The selection process must also be based on economic factors such as capital and operating and maintenance cost. While it is very difficult to generalize, the tendency is to use medium-size turbines for this type of application. In case of a trip, the loss of power is less than for a larger unit. It should be mentioned that in selecting the associated STs, the choice must account for the cycle pressures and locations of the steam extractions limited by the commercial availability of STs that can meet the specified conditions. Another decision is needed on whether to design the ST and associated steam cycle equipment for the case where no steam is required for the process.
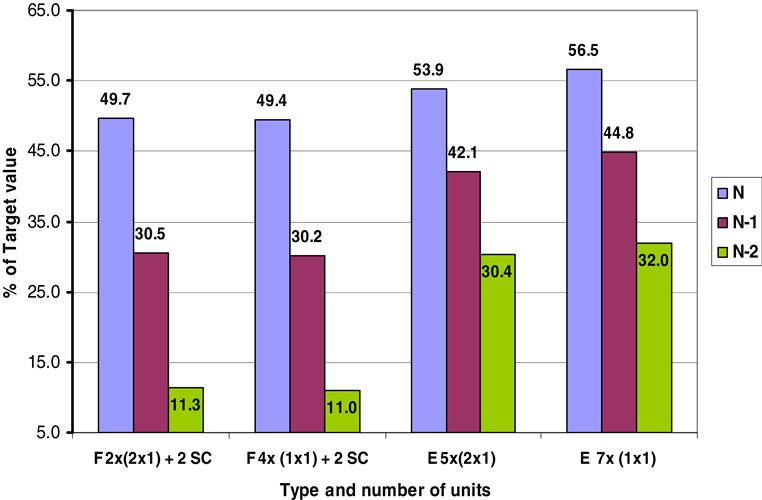
Load Variations
Smelters present some unique load variation demands. For example, sudden changes occur due to anode effects on the pot line—gas bubbles emerge and disappear in the aluminum production process. The GT must follow with rapid changes of 10–20 MW while maintaining grid frequency stability. The selected equipment should be able to demonstrate ability to follow load accordingly. Original equipment manufacturers have incorporated special attributes such as variable inlet guide vanes (IGV) rapid adjustments, fuel system control, and other features to achieve the desired response time. The use of simple cycle GTs can provide rapid startup, load ramping, and unloading.
Equipment Selection Criteria
Early selection of major plant equipment is an important ingredient for a successful plant. The process must identify the owner’s objectives for plant output, heat rate, and reliability, availability, and emissions requirements. In addition to power output and heat rate, the major issue related to evaluating GT performance in captive applications is quantifying the GT exhaust flow and temperature as major contributors to steam production. All four parameters are heavily interdependent. For example, a GT that exceeds the guaranteed power output usually has better-than-expected component efficiency, particularly for the turbine section. As a result, the exhaust temperature is lower. A lower turbine exhaust temperature has a negative impact on HRSG steam production.
To properly assess these impacts, owners/operators are well advised to carefully evaluate the purchase or reservation agreement for the major equipment. While such evaluation is always important, it is crucial for projects involving special industrial applications. Direct experience with the equipment being considered can be brought to bear to ensure that it complies with the specific requirements of the project scope and that all interfaces are well defined. Other considerations include:
• Impact of GT performance offsets (between power output and exhaust energy) on HRSG and ST sizing
• Consistency in pollutant levels and units included in the plant permits and those guaranteed by GT suppliers. In developing CC projects for captive applications, an important aspect of equipment selection is the plant configuration. Usually, suppliers offer standardized CC plant design configurations:
• 1 × 1 (one GT, one HRSG, and one ST)
This approach allows the customer to choose the configuration that best meets its objectives. For multiple units or trains, a 1 × 1 configuration offers many advantages and may be more desirable in certain applications. Some of the advantages of a 1 × 1 configuration are:
• A phased construction allows greater flexibility for the future addition of units to respond to a potential plant expansion.
• Output can be more closely matched with load demand. A site with several units in a 1 × 1 layout and using supplemental duct firing can respond more effectively and economically to steam and power requirements.
• Plant redundancy (N-2 criteria) can be achieved because the units are redundant.
• Spare parts inventory can be optimized, since each component is identical for all trains.