
Data-blending is a way of using different fields from different Data Sources in one Worksheet. There is always a primary data source (the tick icon in blue) and one or multiple secondary data sources (the tick mark in orange). As for joins, one or multiple common fields are needed to create the relationships between the data sources.
Unlike joins, data-blending is often used to add new Measures. Fields coming from the secondary data sources are always aggregated. However, they are only aggregated using the common fields, so there is no data duplication. Finally, data-blending can rapidly have a negative impact on performance.
Fields with the same name can automatically be used to create the relationship. In the secondary data sources, you can recognize the fields that can be used for the relationship with the small link icon next to their name. You can click on the link icon to enable or disable them. For example, in the following screenshot, both Order Date and Order Number can be used as links, but only Order Date is selected and thus, used by Tableau:

If no fields have the same name, you can use Edit Relationships... from the Data menu at the top. A new window opens to configure the relationships and, with the custom option, you select the common fields manually.
To illustrate data-blending, we'll add a target to the Sample-Superstore.
Targets are in a simple Excel file with the Year and the value of the Target, as you can see here:

Go through the following steps to add a target to the sales:
- Open Tableau Desktop and select the Sample-Superstore saved Data Source.
- Click on the New Data Source icon in the toolbar:
 .
. - Search and select the Target Excel file. Tableau should have automatically put the Target table in the Data Source.
- Click on Sheet 1; you should now have two different data sources, as shown in the following screenshot:

- Create a Bar chart with the year of the Order Date in Columns and the Sales in Rows.
- Add the Target Measure from the Target Data Source in Detail. A warning opens because Tableau isn't able to find a relationship between the two data sources. You current visualization should look as follows:

- Open the Data menu at the top and click on Edit Relationships....
- Choose Sample - Superstore as the Primary data source and Target as the secondary, then select Custom. The configuration window should look as follows:

- Click on the Add... button and, in the window that opens, select the Year(Order Date) field from the Primary data source field and Year from the Secondary, as highlighted in the following screenshot, then click on OK:

- In the visualization, right-click on the axis then select Add Reference Line.
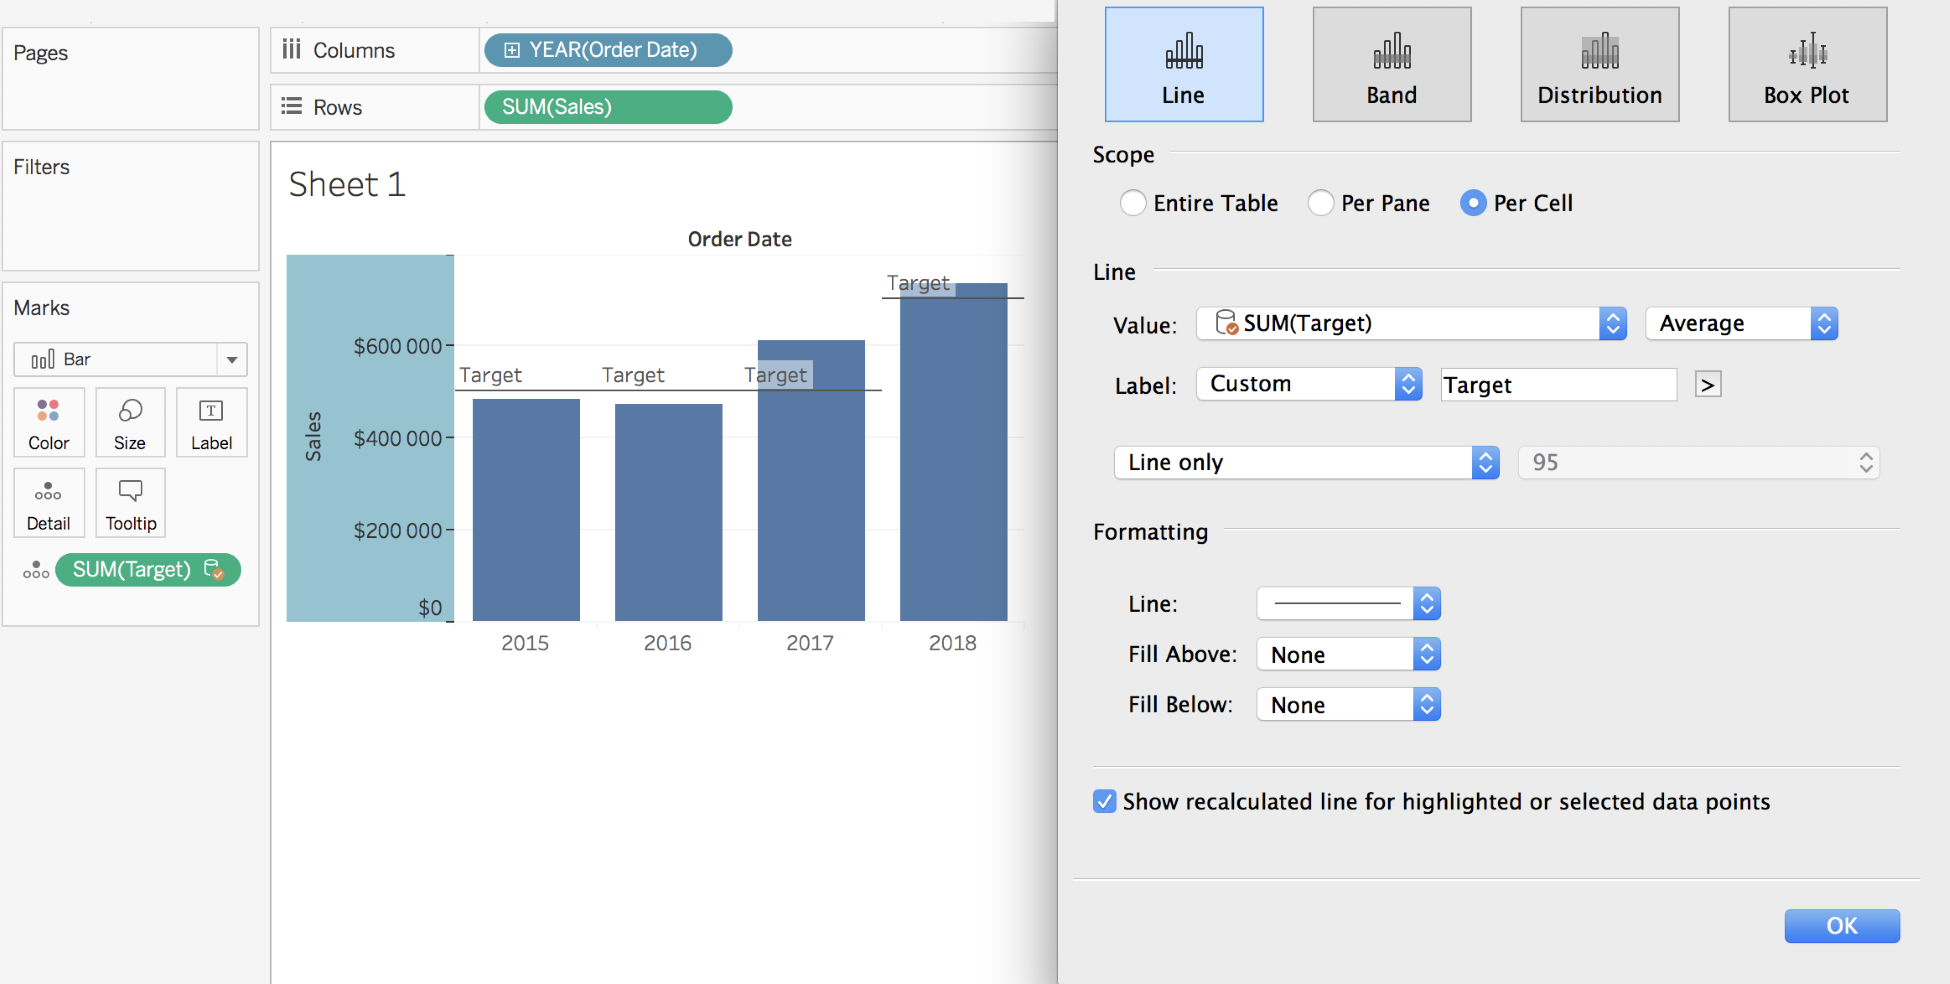
- In the configuration window, change the scope to Per Cell, select SUM(Target) as the value, chose a Custom label, and write Target. Your configuration window and visualization should be similar to this screenshot:
Adding the targets with a normal Join will duplicate the values. Thanks to data-blending, it's both easy and practical to add new Measures with different aggregations coming from different Data Sources. However, there are some limitations, such as you can't use the count distinct or median aggregation, and level-of-detail calculations are not allowed.
In the next section, Unions are back!