Chapter 18: Summary, Practice Case Studies, and Conclusions
This chapter will provide a summary of the book, some practice case studies, and lastly offer some concluding remarks.
In this chapter, we're going to cover the following main subchapters:
- A summary of the book
- Practice case studies
- Conclusions
A summary of the book
Congratulations on your excellent journey of learning through the course of this book; you've acquired invaluable skills. You learned various skills in the four parts of this book. In the following subchapter, we will go over what we learned in each part of this book.
Part 1 – Technical requirements
In this part of the book, which lasted from Chapter 1, Review of the Core Modules of NumPy and Pandas through Chapter 4, Databases, we covered all the technical and foundational concepts, techniques, and technologies that you will need for effective data preprocessing. Specifically, in Chapter 1, Review of the Core Modules of NumPy and Pandas, and Chapter 2, Review of Another Core Module – Matplotlib, we picked up all the foundation Python programming skills that we will need for data preprocessing. In Chapter 3, Data – What Is It Really? we acquired a fundamental understanding of data and the different analytics paths that have implications for our data preprocessing. Finally, in Chapter 4, Databases, we learned about the technological backbone of data analytics, which is databases, and got to understand their role in effective analytics and preprocessing.
Part 2 – Analytics goals
While the first part of the book was meant to give you a technological and foundational background for effective data preprocessing, the second part of the book, which we will cover next, was meant to provide a deep enough understanding of data analytics goals.
It may sound counterintuitive for The preprocessing, which is the third part of the book to come after Analytics goals, but that is actually a common misunderstanding regarding data preprocessing and data cleaning. In many resources, data cleaning is presented as a stage of data analytics that can be done in isolation; however, as you have experienced in this book, most of the data cleaning and the rest of the data preprocessing steps must be done to support the analytics. That is to say, without a proper understanding of what the analytics goals are, we cannot prepare the data through effective data preprocessing.
To best prepare you for your hands-on learning of data preprocessing, this part of the book provided learning opportunities for you to know the four most data analytics goals: data visualization, prediction, classification, and clustering analysis. These goals are the titles of Chapters 5 through 8. Under each chapter and through examples, we formed a deeper understanding of each of these analytics goals and we got to employ various analytics tools to realize these goals.
In this stage of your learning, the datasets that you worked on were mostly cleaned and prepared to best support your learning. However, the datasets you used after that had different issues and challenges that you learned how to deal with. You learned most of this in Part 3 and Part 4 of the book. Let's now go over our learning in Part 3.
Part 3 – The preprocessing
This part of the book is indeed the meat of our learning. Our learning happened in six chapters. The first three chapters, Chapters 9 through 11, covered data cleaning. Specifically, in these three chapters, we learned about three different levels of data cleaning. In Chapter 12, Data Fusion and Data Integration, we covered data integration. As you experienced, data integration is one of the simplest data preprocessing steps to understand but one of the most challenging parts to implement. In Chapter 13, Data Reduction, we got to learn about data reduction, which is a necessary step for many analytics projects, for many reasons. Lastly, Chapter 14, Data Transformation and Massaging provided a learning opportunity about data transformation, which can be thought of as the very last step of data preprocessing.
So, the four major data preprocessing steps that we learned during the course of this part of the book are data cleaning, data integration, data reduction, and data transformation. While we went about learning them in isolation in these six chapters, in real practice, you will more often perform some of them at once.
Let me use an analogy to explain that better. Imagine we wanted to learn how to effectively play soccer. In this scenario, we would have to know how to kick the ball, pass the ball, control the ball, and so on; our coach would probably give us lessons and let us practice each skill. However, when you are put to play in a real soccer game, you would not be allowed to just show your competence in one skill but would have to be relatively good at all skills to be considered a decent soccer player. Moreover, at some points during a game, you might have to combine skills and perform them either at the same time or one after the other in a split second.
The same is true regarding data preprocessing skills: data cleaning, data integration, data reduction, and data transformation. We learned them first in isolation, but real learning happens when you can perform them at the same time, in tandem, or in a smooth sequence. The next part of the book, Part 4 – Case studies, provides just that learning opportunity.
Part 4 – Case studies
In this part of the book, including the current chapter, we have culminating experiences so that we can see how the data preprocessing tools that we picked up in the previous parts of the book are used in concert with each other.
Specifically, the first three chapters, Chapters 15 through 17, were three complete case studies that showcased three real analytics examples that required significant data preprocessing. As you experienced in these three chapters, the order in which we performed the preprocessing steps was very different. Not only that—the steps were not done in complete isolation, and some data preprocessing was performed at the same time too.
In this current chapter, which is the last chapter of Part 4 of the book, besides a book summary and conclusion, you will also be provided with more culminating experiences and learning opportunities. In the next subchapter, you will be introduced to 10 case studies that can be used for more practice. As we discussed, learning each skill in isolation is great but your data preprocessing will become more effective when they are performed in tandem with one another.
Practice case studies
This subchapter introduces 10 practice case studies. Each case study introduces a dataset and provides an analytics goal that can be achieved by preprocessing and analyzing the dataset. While each case study comes with a few analytics questions (AQs), don't allow them to close your mind to other possibilities. The suggested AQs are only meant to get you started.
We will start with a very meaningful and valuable case study that can provide real value to many levels of decision makers.
Google Covid-19 mobility dataset
Since the beginning of the recent COVID 19 pandemic, the United States (US) had various responses to combat Covid-19, varying from state to state. Each state implemented different health and safety precautions and followed different timeframes when shutting down the state. Many factors contributed to each state's health regulations, such as the number of Covid-19 cases, population density, and healthcare systems; however, most states issued stay-at-home orders, asking citizens to stay in their houses.
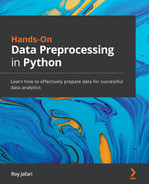
To aid public health officials in combating the virus and learn whether techniques such as social distancing were working, Google put forth a database called the Global Mobility Report. The data was put together to give insights into how different regions of the world were responding to the Covid-19 crisis. The report breaks down changes in people's movements in parks, grocery stores, and pharmacies; retail and recreation; and workplaces. For instance, the following screenshot portrays changes in people's behavior in San Luis Obispo County, California from the baseline during September 12 to October 24, 2021, for each movement category:
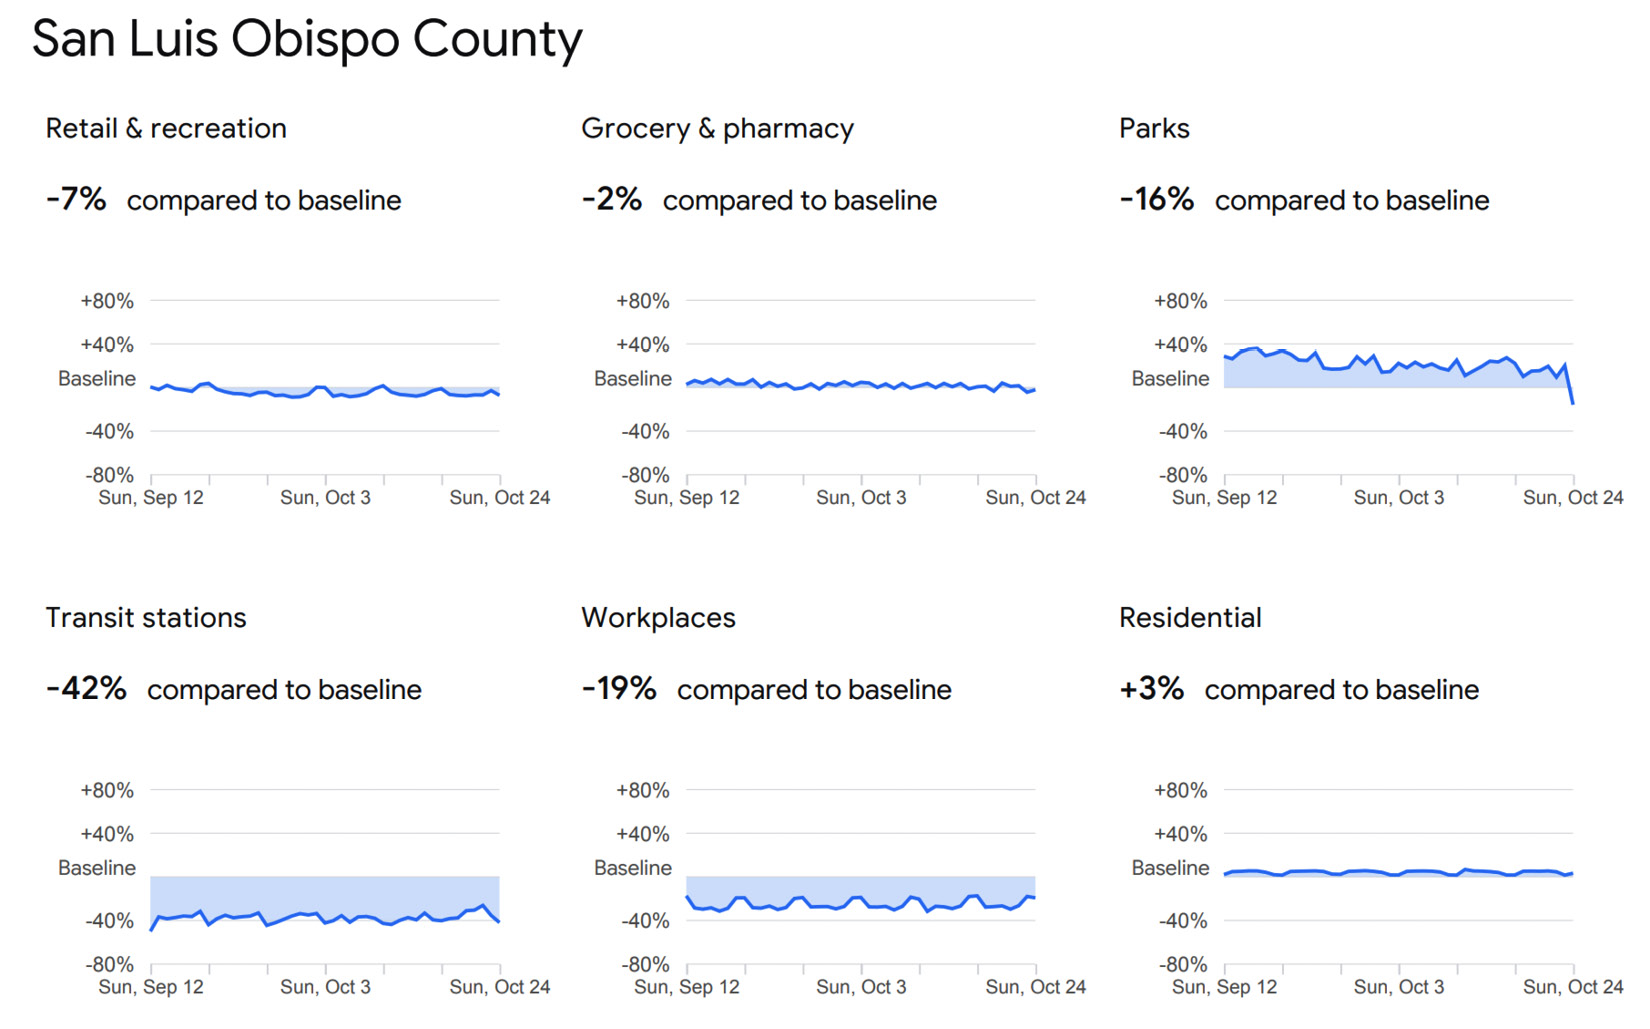
Figure 18.1 – Sample from Global Mobility Report: San Luis Obispo County, California
This data was collected from the users of Google Maps by using aggregated, anonymized data, and seeing how frequently people traveled around during the ongoing pandemic. To ensure the privacy of all users of Google Maps, the company used an anonymization technology called differential privacy. This technology adds artificial noise to datasets to not allow the system to identify an individual.
The latest version of the dataset can be accessed at https://www.google.com/covid19/mobility/. We could define many analytics questions that can be answered using this rich dataset; however, to get you started, please see the following two AQs:
- AQ1: Did people's behavior change after the government's stay-at-home order? This can be answered at different levels: counties, state, country.
- AQ2: Was the degree of change to stay-at-home orders different state by state and county by county?
The next practice case study is also going to be very meaningful for federal, state, and even individual decision makers.
Police killings in the US
There are a lot of debates, discussions, dialogues, and protests happening in the US surrounding police killings. In the past 5 years, The Washington Post has been collecting the data of all fatal police shootings in the US. The dataset available to the government and the public alike has data regarding age, gender, race, location, and other situational information of these fatal police shootings. You can download the dataset from https://github.com/washingtonpost/data-police-shootings.
Again, while the dataset has the potential to answer many valuable questions, the following two AQs are provided to get you started:
- AQ1: Would the suspect's race increase the chance of being fatally shot at?
- AQ2: Can wearing a body camera help decrease the number of fatal police shootings?
The next case study will feature a dataset regarding automobile accidents in the US.
US accidents
Not all roads are the same; there is a much higher risk of weather conditions causing an accident during winter in Chicago versus a summer in San Jose. Data analysis can shed so much light on hazardous roads and weather conditions—for instance, in the following screenshot, we can see that the frequency of accidents varies significantly across states. However, we must pay attention to the fact that the population of the states might be causing this variation more than the difference in driving habits and road conditions:

Figure 18.2 – Sample visualization from the US-Accidents dataset
Note
The preceding screenshot is sourced from https://smoosavi.org/datasets/us_accidents.
You can download the dataset from the following link: https://www.kaggle.com/sobhanmoosavi/us-accidents. The following list provides two possible AQs that can get you started:
- AQ1: Is there a discernable difference between the frequency of accidents per capita across different states?
- AQ2: Does a specific type of road become more prone to a fatal accident in rainy weather conditions?
The next case study will be another form of data analytics for the greater good; we will use the power of data analytics to investigate crime patterns.
San Francisco crime
San Francisco experiences a somewhat higher crime rate than other parts of the US. On average, 19 crimes happen per 100,000 people, and in a year, every person has a 1 in 15 chance of being mugged. While these statistics are staggering, data analytics might be able to help by showing crime patterns. These patterns can help decision makers to first understand the cause of the much higher crime rate and then try to address them using sustainable measures.
The following screenshot shows that data analytics is already being used in the San Francisco Police Department. It is greatly encouraging to see that the tools you know are being actively used and that you could be contributing to these efforts.
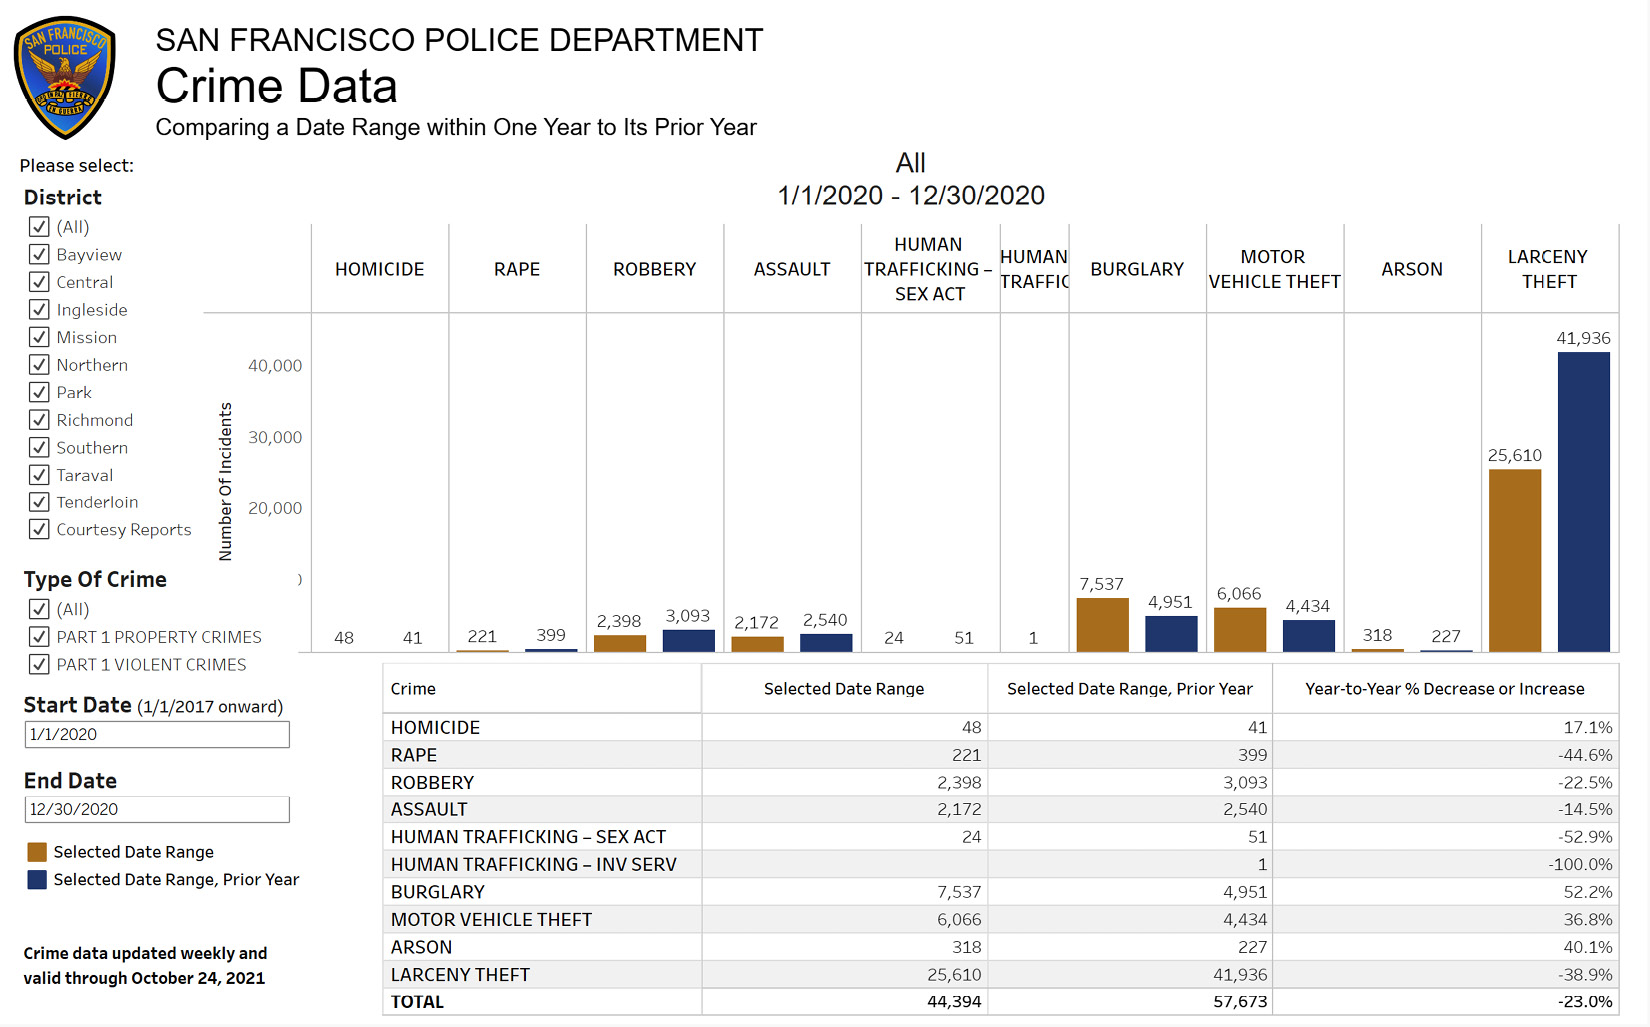
Figure 18.3 – San Francisco Police Department Crime dashboard
Note
The preceding screenshot is sourced from https://www.sanfranciscopolice.org/stay-safe/crime-data/crime-dashboard.
You can access a rather large dataset that is ripe for data preprocessing practice via https://www.kaggle.com/roshansharma/sanfranciso-crime-dataset. This dataset includes the records of crimes in San Francisco in 2016. The following two AQs can get you started:
- AQ1: Are there times of the day during which the frequency of assaults increases?
- AQ2: Are there locations in the city that see more theft?
In the last four case studies, we focused on the greater good by studying cases that can benefit society. Let's shift gear and look at a case study that can empower an individual—in this case, to become smarter in the data analytics job market.
Data analytics job market
The job market for data analysts and data science has not yet taken a stable shape. There is a wide range of variations experienced by people who try to find jobs in this market. This dataset provides an opportunity to discover some of the patterns in the job market. The dataset can be downloaded via https://www.kaggle.com/andrewmvd/data-analyst-jobs. The following two AQs can get you started:
- AQ1: Does the location of the data analytics job influence the amount of compensation?
- AQ2: Does the company rating influence the amount of compensation?
The next two practice case studies relate to sports analytics. I am glad you are already excited.
FIFA 2018 player of the match
20 minutes after each international soccer game, the player of the match is recognized. For instance, the following screenshot shows a YouTube video honoring Antoine Greizmann who was recognized as the player of the match for the 2018 FIFA World Cup™ final after helping his team to beat Croatia and become the 2018 FIFA World Cup champions:

Figure 18.4 – Player of the Match: 2018 FIFA World Cup™ final
Note
The preceding screenshot is sourced from https://youtu.be/-5k-vgqHO2I.
While knowing the player of the match is peripheral to the main soccer competition, knowing who will be the winner beforehand can be of much value to gambling professionals. This dataset contains the data of all of the games in FIFA 2018. You can access the data via https://www.kaggle.com/mathan/fifa-2018-match-statistics. The following two AQs can get you started to preprocess and analyze this exciting dataset:
- AQ1: Can the ball position predict the team from which the man of the match will be selected?
- AQ2: Can a combination of the number of attempts and passing accuracy predict the team from which the man of the match will be selected?
The next practice case study is going to relate to sports analytics too, but this time, the sport is going to be basketball.
Hot hands in basketball
Basketball is a very exciting game in that the winning and losing teams may switch places in a matter of seconds, and there is a lot of common sense and theories around this captivating game. One of them is the Hot Hand theory, which is about a successful sequence of three-point shots. As the theory goes, if a player has a hot hand, if they have made some consecutive successful shots, they will continue to make more successful shots. While behavioral economists have long rejected the Hot Hand theory, citing representativeness heuristic bias, I bet it will be fun to let the data speak and see whether the historical data supports the theory. I am more excited for you to do an analysis using the dataset on this Kaggle page: https://www.kaggle.com/dansbecker/nba-shot-logs. The following two AQs can get you started on preprocessing and analyzing this dataset:
- AQ1: Does the historical data support the Hot Hand theory?
- AQ2: Does being against a "good" defender dampen the success rate of a "good" shooter?
After having some fun with sports analytics, let's turn our attention to more high-stakes analysis. The next case study is going to have both environmental and societal analysis value. We are going to analyze wildfires in California.
Wildfires in California
California saw two of its worst wildfire seasons in 2020 and 2021, and the ecological predictions all point to the hypothesis that these are not just some outliers in the historical data but are long-term shifts in trend. This dataset provides the opportunity for you to analyze firsthand the pattern of California wildfires from 2013 to 2020. You can access this dataset from the Kaggle web page: https://www.kaggle.com/ananthu017/california-wildfire-incidents-20132020.
This dataset can both support data visualization and clustering analysis. An example of data visualization is used by BLM California Wildfire Dashboard (Public), and the following screenshot shows the dashboard information collected on October 28, 2021:
Figure 18.5 – BLM California Wildfire Dashboard (Public)
Note
The preceding screenshot was sourced from https://www.arcgis.com/apps/dashboards/1c4565c092da44478befc12722cf0486 on October 28, 2021.
I highly suggest practicing data preprocessing for the purpose of clustering analysis on this dataset first, and then turn your attention to more data visualization. The first AQ listed here can only be answered using clustering analysis:
- AQ1: Do the fires from 2013 to 2020 form meaningful clusters? What are their patterns?
- AQ2: Are there more large fires in specific years?
We are going to see some more societally meaningful data analysis next. The following case study is going to provide an opportunity to analyze the diversity profile of 23 top tech companies in Silicon Valley.
Silicon Valley diversity profile
This Kaggle web page, https://www.kaggle.com/rtatman/silicon-valley-diversity-data, has three datasets, and you want to focus on Reveal_EEO1_for_2016.csv for this case study. Many meaningful AQs can be designed that this dataset can help provide an answer to; however, the following two AQs are meant to get you started.
The first AQ listed here can only be answered using clustering analysis:
- AQ1: Is there a relationship between the attribute gender and job category? In other words, does the gender of an individual influence their job category?
- AQ2: Is there a noticeable difference between the Silicon Valley companies concerning employee diversity profiles?
In the next case study, we are going to have an opportunity to practice our preprocessing for prediction models.
Recognizing fake job posting
There is nothing worse than spending hours on a job application only to realize the job posting is fake. In this practice case study, you will get to see whether prediction models can help us weed out fake job postings. Furthermore, we can see which characteristics tend to give away a fake posting.
The dataset that provides this learning opportunity is accessible on the Kaggle web page at https://www.kaggle.com/shivamb/real-or-fake-fake-jobposting-prediction. This dataset supports many possible AQs; however, the following will get you started:
- AQ1: Can Decision Tree meaningfully predict fake postings?
- AQ2: What are the characteristics that fake posts share?
The 10 listed practice case studies in this chapter of the book are excellent sources to continue learning; however, there are more potential learning opportunities out on the internet that you can find on your own. Before ending this subchapter, we will go over a list of possible resources that you may use to hunt for more datasets.
Hunting more practice case studies
The following two resources are excellent for finding datasets to practice your newly acquired data preprocessing and analytics skills.
Kaggle.com
This website is the best resource for finding more case study projects. Throughout this book, you may have noticed that most of the datasets we used were sourced from this website. The Kaggle website has done a great job of creating a community of developers with different skill levels who have come together to share knowledge and datasets. I highly encourage you to join this community to find more learning and practice resources.
The next resource is not as vibrant a community as Kaggle; however, it is the oldest most well-known machine learning (ML) dataset repository.
University of California Irvine Machine Learning Repository
Very well known by the term UCI ML Repository, this repository has been collecting datasets for research purposes since 1987. A great feature of this repository is that you can see datasets based on the analytics goals; all the datasets are filterable by four associated tasks: classification, regression (prediction), clustering, and others. You can access this repository at https://archive.ics.uci.edu/ml/index.php.
In this subchapter, you were introduced to 10 possible case studies and 2 sources that have many more possible practice case studies. The next subchapter offers some conclusions to this chapter and the whole book.
Conclusions
Allow me to start concluding this book by congratulating you on having gone through this journey of learning about data analytics and data preprocessing. I am confident that your learning about data analytics and data preprocessing does not end here, and you are already planning to learn more useful tools and pick up valuable skills. So, how about we conclude this book by examining a few routes for learning and improvement?
My first suggestion would be to cover your base and take advantage of all of the learning resources that this book has to offer so that you can deepen your learning and bring your skill level closer to second nature. The end of most chapters provides exercises for exactly this purpose. Furthermore, the three case studies in Chapters 15 through 17 can be expanded upon and improved; doing that would be a great way to improve your learning. Lastly, this current chapter provided many starting points and case studies to practice the skills you've picked up during your journey in this book and make them second nature.
Besides solidifying what you learned in this book, there are a few distinct learning routes you may consider. For organization, I call these routes data visualization and storytelling, algorithms, technology, and mathematics. Let's go over these routes one by one.
Chapter 5, Data Visualization, provided a brief but fundamental understanding of data visualization. The material was provided to support our learning for data preprocessing. There is much more to learn about data visualization as far as techniques and technology go, but also from the perspective of storytelling. You might be good at the technical aspect of coming up with visualization, but this visualization must be prescribed before you can create it. In other words, if you are the one deciding what kind of visualization is needed to convince an audience, you might not be the best person to go to. If that's the case, I'd highly recommend that you consider reading Storytelling with Data: A Data Visualization Guide for Business Professionals, by Cole Nussbaumer Knaflic, and Effective Data Visualization: The Right Chart for the Right Data, by Stephanie Evergreen. Not only do these books help to kindle your curiosity and creativity regarding data visualization, but they will also guide you through the actual storytelling part that is bound to come with effective data visualization.
In this book, we only scratched the surface of algorithmic analytics. In Chapters 6 through 8, we briefly learned about some classification, prediction, and clustering algorithms. Not only are there more algorithms for each of the three mentioned data analytics tasks, but there are also more analytics tasks that need an algorithmic approach for effective solutions. You may want to invest in these to deepen your learning and pick up more skills in this area, and if you become proficient with all these algorithms, you'd become a highly attractive hire for ML engineer roles.
While this route of learning sounds very promising, I would like to offer a few notes of caution. First, for this route, you want to have good programming skills or at least enjoy programming; I am not talking about the type of programming we did during this book. In this book, we only learned enough programming to use modules and functions created by real programmers. I mean that you need enough programming skills so that you would be able to create those modules and functions. My second note of caution regards the future of algorithmic analytics. I surmise that out of all the four routes of learning that I am discussing here, this route is the one that is the most automatable. That means in the near future, the cost of hiring an ML engineer to develop an algorithmic solution becomes higher than subscribing to Artificial Intelligence as a Service (AIaaS) or Machine Learning as a Service (MLaaS) solutions provided by tech giants such as Amazon (Amazon Web Services (AWS)), Microsoft (Azure), and Google (Google Cloud Platform (GCP)). Unless you are the best of the best in these areas and hirable by these companies, you might end up needing to reskill.
Next, let's talk about the technology route of learning and improvement. For better or worse, many organizations and companies think of effective data analytics as visualization dashboards that are effectively connected to their relevant databases. For these organizations, the skill in drafting effective queries that pull the appropriate data from the databases that create and enliven the graphics on the dashboard is what they will look for in their analytics professionals. This is the simple reality of the data analytics job market: companies are not looking for hires that have more technical and conceptual knowledge, but they are looking to hire people who can work most effectively with the technologies that they have already adopted. Granted—being able to work with those technologies requires its own specific knowledge and skillset, but they may be rather different.
If today's most adopted technology that allows survival and competitiveness is databases, in the near future, it is my humble prediction that most companies will take the next technological leap and adopt cloud computing. This exciting trend in technological improvement is a world in itself. Not only has it streamlined and improved database technologies and the current mass technological adoption, but it also has a lot more to offer, including Platform as Service (PaaS), Supply Chain as Service (SCaaS), MLaaS, AIaaS technologies, and more.
While cloud computing platforms such as Amazon's AWS, Microsoft's Azure, and Google's GCP will provide all these solutions under various payment schemes, these services will have many variations that are designed for different needs and companies. Knowing these variations and being able to select the correct one for a company can save a meaningful amount of money for companies. Not only that—to be able to adopt AIaaS solutions such as natural language translators, the solution needs to be appropriately linked to the databases of the companies. Being able to effectively put together these pieces of technologies and cater them to the needs of a company will be a very valuable skill.
We are already seeing pioneer companies having developed roles such as development-operations (DevOps) engineer, cloud engineer, and cloud architect whose responsibilities are to recognize and adapt different pieces of cloud technology and streamline them for their needs. It is my humble prediction that for a good while, we will see a rise in the demand for these roles, while we will see a decline in demand for roles that were meant to develop analytics, AI, and ML solutions from scratch, such as data scientists and ML engineers. This trend will continue until the cloud computing adoption rate becomes high enough that companies cannot remain competitive and survive just by being able to use this technology, and they will need to adopt the new hot one. So, right now, it lays before us as a golden opportunity to break into a high-paying future tech role. Granted—you would still need to understand the business, computer programing, data preprocessing, and algorithmic data analytics to some extent, but in these roles, you would most contribute by knowing the ins and outs of the solutions that cloud computing has to offer.
Last but not least, let's talk about the learning route of mathematics. Toward the end of this book—specifically, in Chapter 13, Data Reduction, and Chapter 14, Data Transformation and Massaging—we started to talk about functional data Analysis (FDA). As you experienced during these two chapters, FDA can be a very powerful analytics and preprocessing tool if you have a solid mathematical understanding of various functions. Improving your understanding of various mathematical functions can give you an untouchable edge when it comes to the effectiveness of data preprocessing. After all, if other analysts don't know the mathematical function that can capture the most important information in the data, they are reduced to using a noisy dataset whose patterns are not brought to the surface and hope the algorithm will be able to pick up on them.
All of the four learning routes that I have provided here could be the right one for you, and the correct decision as to which one hinges on your personality and the types of daily activities you would enjoy doing. If you are more interested in inspiring people and would like to be more effective at persuading people, data visualization and storytelling may be the right route for you. If you enjoy computer programming and take pleasure from the thrill of zoning out into the third or fourth nested loop, the algorithms route might be it. If you enjoy being up to date with technology and enjoy debating what will happen if a new piece of technology is adopted, the technology route could be for you. Lastly, if you are good at math and can envision functions in your mind, and are fast at simulating data with various functions, the FDA route could help you in your tech career.
Lastly, I would like to say that I hope you learned many things of value in this book. I enjoyed the journey of writing this book, and I hope you enjoyed it as much as I did. Happy learning, everyone!