
Importing data into a SpatiaLite database is easy using the DB Manager. SpatiaLite supports the following commonly-used formats, as well as many other formats, for importing files:
- Shapefile (
.shp) - dBase (
.dbf) - Text (
.txt), Commas Separate Values (.csv), and Excel spreadsheets (.xls/.xlsx) - AutoCAD DXF (
.dxf) - Geography Markup Language (
.gml) - Keyhole Markup Language (
.kml) - Geometry JavaScript Object Notation (
.geojson) - Scalable Vector Graphics (
.svg)
Let's use DB Manager to import data in a few different formats into our GiffordPinochet.sqlite database.
To import a KML file into a SpatiaLite database, complete the following steps:
- Open DB Manager by clicking on DB Manager under Database. Expand SpatiaLite and select GiffordPinochet.sqlite on the Tree panel.
- Navigate to Table | Import layer/file to open the Import vector layer dialog.
- Click on the ellipsis button at the right-hand side of the Input drop-down box. Choose Keyhole Markup Language [KML] from the filter list then select and open
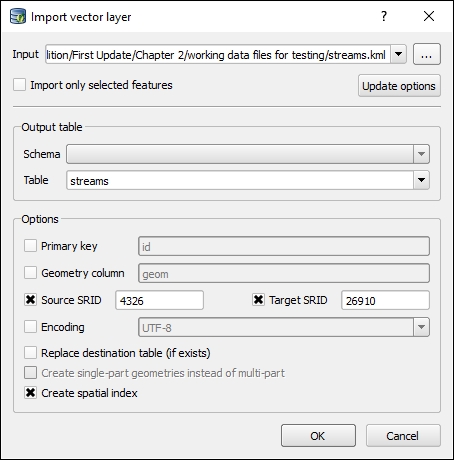
streams.kmlfrom the sample dataset that is available for download on the Packt Publishing website. - Click on the Update options button to load the remainder of the dialog box. The output table name will populate as
streams, and it will match the base name of the input file. - Set the following options, as shown in the following screenshot:
- Select Source SRID and enter
4326. This is the EPSG code for all KML datasets. - Select Target SRID and enter
26910. This is the EPSG code for NAD 83/UTM Zone 10 North. - Select Create spatial index.
- Select Source SRID and enter
- Refer to the following screenshot to make sure your settings match. If so, click on the OK button to import the file.
- After a few moments, you will be notified that the import is complete. To view the newly created table, you'll need to refresh the Tree panel by selecting
GiffordPinochet.sqlitein the tree and then click on Refresh under Database, or press the f5 key on your keyboard. Thestreamstable should now appear and have the polyline icon next to it. - To preview the attribute table, click on the Table tab on the information panel. To preview the geometry, click on the Preview tab on the information panel. To view the newly created SpatiaLite layer in QGIS Desktop, right-click on streams on the Tree panel, and then choose Add to canvas.
- Open DB Manager by clicking on DB Manager under Database. Expand SpatiaLite and select
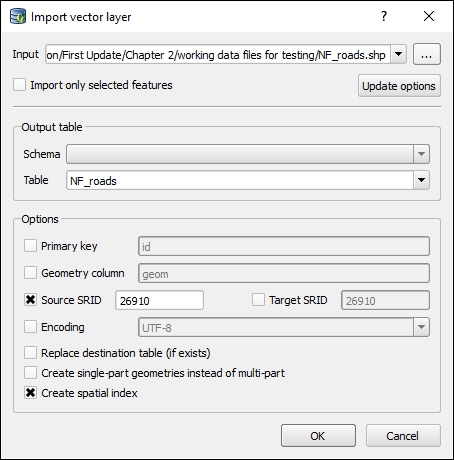
GiffordPinochet.sqliteon the Tree panel. - Navigate to Table | Import layer/file to open the Import vector layer dialog, as shown in the following screenshot.
- Click on the ellipsis button at the right-hand side of the Input drop-down box. Select ESRI Shapefiles from the filter list, then select and open
NF_roads.shpfrom the sample dataset that is available for download on the Packt Publishing website. - Click on the Update options button to load the remainder of the dialog box. The output table name will populate as
NF_roads, and it will match the base name of the input file. - Set the following options:
- Select Source SRID and enter
26910. This is the EPSG code for NAD 83/UTM Zone 10 North. Since we don't want to change the coordinate system during import, we do not need to set Target SRID. - Select Create spatial index.
- Select Source SRID and enter
- Click on the OK button to import the file:
- After a few moments, you will be notified that the import is complete. To view the newly created table, you'll need to refresh the Tree panel by selecting
GiffordPinochet.sqlitein the tree, and then click on Refresh under Database, or press the f5 key on your keyboard. TheNF_roadstable should now appear and have the polyline icon next to it. - To preview the attribute table, click on the Table tab on the information panel. To preview the geometry, click on the Preview tab on the information panel. To view the newly created SpatiaLite layer in QGIS Desktop, right-click on NF_roads in the tree, and then choose Add to canvas.
To import a table file into a SpatiaLite database, complete the following steps:
- Open DB Manager by clicking on DB Manager under Database. Expand SpatiaLite and select GiffordPinochet.sqlite on the Tree panel.
- Navigate to Table | Import layer/file to open the Import vector layer dialog.
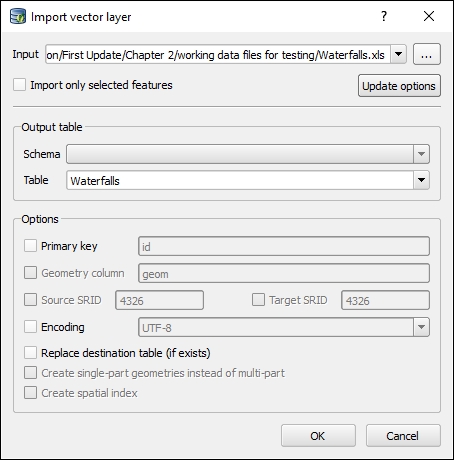
- Click on the ellipsis button to the right-hand side of the Input drop-down box. Select MS Excel format from the filter list then select and open
Waterfalls.xlsfrom the sample dataset that is available for download on the Packt Publishing website. - Click on the Update options button to load the remainder of the dialog box. The output table name will populate as
Waterfalls, and it will match the base name of the input file. Note that all options related to spatial datasets are not modifiable and are grayed out (as shown in the following screenshot). This is because SpatiaLite treats the input as a nonspatial table, even though it has coordinates stored in the table. We will add the spatial component to the table in a later step. - Click on the OK button to import the file:
- After a few moments, you will be notified that the import is complete. To view the newly created table, you'll need to refresh the Tree panel by selecting GiffordPinochet.sqlite in the tree, and then click on Refresh under Database, or press the f5 key on your keyboard. The
Waterfallstable should now appear and have the table icon next to it. - Select the
Waterfallstable. Click on the Info tab on the information panel. Note the Northing and Easting fields. These fields contain the coordinates of the waterfalls in NAD 83/UTM Zone 10 North (EPSG 26910). Click on the Table tab on the information panel to view the entries in the table. Note that the Preview tab is not selectable, because the selected table does not have any geometry field.
At this point, the table import is complete. However, since the Waterfalls table has coordinate pairs, a point geometry column can be added to the table that would essentially convert the table to a point layer. Let's do this now:
- With the
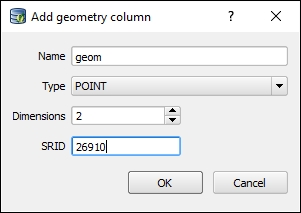
Waterfallstable selected in the Tree panel, navigate to Table | Edit Table to open the Table properties window. - Click on the Add geometry column button. In the new window, set the following options to match the following screenshot and then click on OK to create the geometry field:
- Name:
geom(the name of the field that will contain the geometry information) - Type: POINT (the type of geometry the field will hold)
- Dimensions:
2(the number of dimensions (values) the geometry field will hold for each record; two dimensions represents the two coordinates (X,Y) stored for each point, and three dimensions would include a Z coordinate) - SRID:
26910(spatial reference identification: the coordinate reference system (CRS) code for the geometry field; CRS codes can be found at http://www.epsg-registry.org. Refer to Chapter 1, A Refreshing Look at QGIS for a refresher on CRS)
The following figure shows a new geometry column being created, which will store a point geometry holding two dimensions (coordinates), with a spatial reference identification number of 26910, which represents NAD83 UTM Zone 10 North:
- Name:
- Close the table properties. To view the newly edited table, you'll need to refresh the Tree panel by selecting
GiffordPinochet.sqlitein the tree and then clicking on Refresh under Database, or press the f5 key on your keyboard. TheWaterfallstable should now appear and have the point icon next to it.
Now that the Waterfalls table has a geometry field, we need to populate it with the coordinates. We will accomplish this by writing a SQL update query and using the SpatiaLite MakePoint function. To do this, perform the following steps:
- With
GiffordPinochetselected in the tree view, click SQL window under Database. You can also press f2 on your keyboard. This will open the SQL window as a tab in DB Manager. - In the SQL window, click on the Clear button to clear the SQL query text area.
- Enter the following query in the SQL query text area:
UPDATE Waterfalls
SET geom = MakePoint(Easting,Northing,26910);
Note
Let's discuss the MakePoint function.
MakePoint(Easting,Northing,26910)is a SpatiaLite function that creates a new point geometry object.EastingandNorthingare the columns in the same row that hold the values for the x and y coordinates respectively.26910is the SRID of the x and y coordinates. - Click on the Execute (F5) button to execute the query. The query will return no result but will indicate that 100 rows were affected. This indicates that the geometry field of 100 rows has been populated with point geometry. The following screenshot shows the query and the indication that 100 rows were affected:

- In the SQL window, click on the Close button to close the window.
- To view the changes made to the
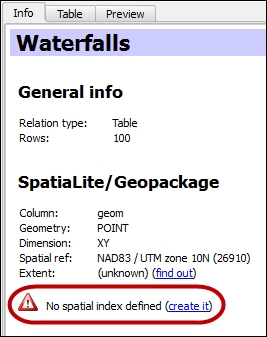
Waterfallstable, you'll need to refresh the Tree panel by selectingGiffordPinochet.sqlitein the tree and then clicking on Refresh under Database, or press the f5 key on your keyboard. - Select Waterfalls, then click on the Info tab on the information panel. Under the SpatiaLite section of the information printout. Note that a warning is displayed stating that no spatial index has been defined (shown in the following screenshot). To improve access speed, it is best that a spatial index be set. Click on create it and then click on the Yes button on the pop up:
- To preview the attribute table, click on the Table tab on the information panel. To preview the geometry, click on the Preview tab on the information panel. To view the newly created SpatiaLite layer in QGIS Desktop, right-click on NF_roads in the tree and then choose Add to canvas.