
Sometimes, it is necessary to make conversions among point, line, and polygon vector geometries. For example, you may need to generate point centroids from ZIP code polygons or a town boundary polygon from a line layer. Such conversions may be necessary to put the data into the most appropriate geometry for analysis. For example, if you need to determine the acreage of parcels, but they are provided in a line format, you will need to convert them to polygons to calculate their areas. Sometimes, you may want to convert geometries for cartographic reasons, such as converting polygons to points to create label points. The following tools can be found on the Geometry Tools menu under Vector:

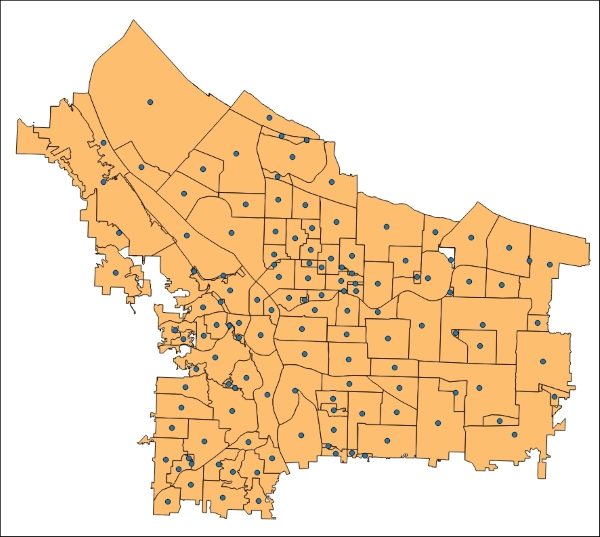
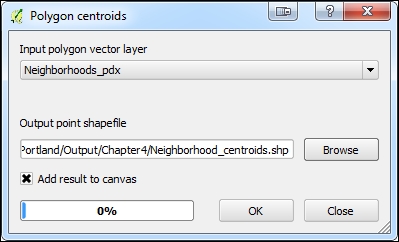
With the Polygon Centroids tool, which can be found by navigating to Vector | Geometry Tools, you can generate points that will be located at the center of polygons. Simply provide the input polygon layer and name the output. In the following example, centroids of the Neighborhoods_pdx.shp shapefile have been generated. This tool preserves all the attributes during the conversion. With the data in point form, you can generate a heat map, compute densities, or measure distances:
With the Polygons to Lines and Lines to Polygons tools, which can be found by navigating to Vector | Geometry Tools, you can convert between these two geometry types. There are many reasons why this conversion may be desirable. In the following example, we are provided with a slope layer in a polygon format. Here, we will convert it to a line geometry so that it can be styled as contour lines. All the attributes will be maintained during either conversion. Conversions from line to polygon are necessary if the area needs to be calculated. An example of this is parcel data from a CAD program that is provided to you as a line layer. In a GIS environment, parcel data is better represented as a polygon layer than as a line layer:
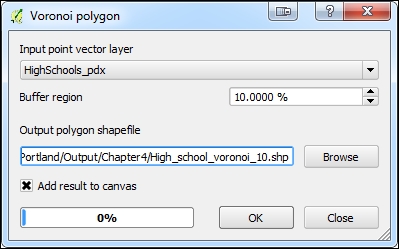
There are two tools for generating polygons around individual points in a layer: Voronoi and Delaunay triangulation. Voronoi polygons represent the area of influence around each point. These are named after the Russian mathematician Georgy Voronoy, who invented the algorithm. They are also referred to as Thiessen polygons and are named after Alfred Thiessen, who independently created the same algorithm. You can use the Voronoi polygon in QGIS by navigating to Vector | Geometry Tools | Voronoi Polygons. The resulting polygon represents the area closer to the point used as the input than to any other points in the layer. The Delaunay triangulation tool can be found by navigating to Vector | Geometry Tools | Delaunay Triangulation.
Delaunay triangulation creates a series of triangular polygons. The method creates a triangle in such a way that a circle drawn through the three nodes of the triangle will contain no other nodes. This is the same technique that is used to generate triangulated irregular networks (TINs).
Here, we'll use the High_schools_pdx.shp data to compare these two methods. The two tools are intuitive. You need to provide the input point vector layer and specify the output polygon shapefile name. The Voronoi Polygons tool has an option to set Buffer region. This is the amount by which the resulting polygons will extend beyond the perimeter points. In the following example, the Buffer region field has been set to 10%:
The following screenshot shows the output differences between Voronoi Polygons and Delaunay polygons:

The Extract Nodes
tool, which can found by navigating to Vector | Geometry Tools | Extract Nodes, can be used to convert either line or polygon layers into a point layer. Each individual vertex from the input layer will be extracted and output to a new layer. In the following example, we are interested in identifying street intersections. By extracting the nodes from the Selected_streets.shp layer, a point for each intersection is generated, as shown in the following screenshot:
Street lines and extracted nodes representing intersections
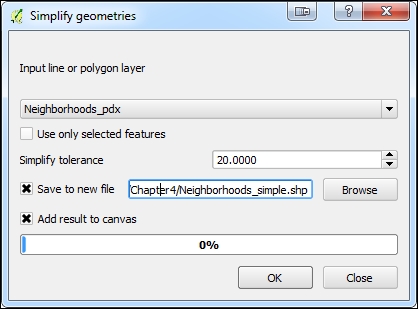
The Simplify geometries and Densify geometries tools, which can found by navigating to Vector | Geometry Tools, remove and add vertices, respectively. They are only suitable for line and polygon data.
Simplifying data may be desirable to make it more suitable for use at a smaller scale. It may also be helpful if the data is to be used in an online interactive mapping scenario. The simplify tool uses a modified Douglas-Peucker algorithm that reduces the number of vertices while attempting to maintain the shape of the features. In the following example, the polygons of the Neighborhoods_pdx.shp data are simplified with a simplify tolerance of 20. The tolerance is specified in map units.
Here, the data is in a state plane coordinate reference system with units in feet. With the Simplify tolerance field set to 20, the algorithm will try to eliminate vertices within 20 feet of one another. With this setting, the number of vertices is reduced from 31,637 to 6,189, with almost no change in the shapes of the polygons! This reduced the size of the data on disk from 1.05 MB to 208 KB:
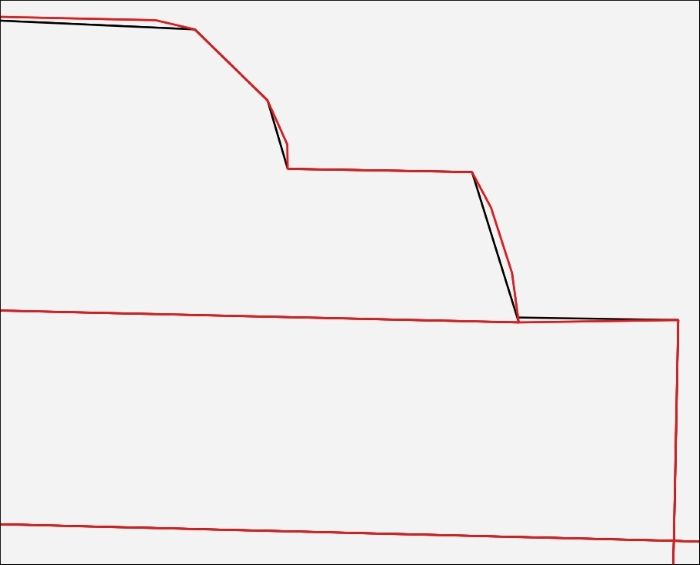
The following screenshot shows the result of the simplification operation. When zoomed in to 1:1,000, the difference between the input and output geometries can be seen. The black lines are the original neighborhood boundaries and the red lines are the boundaries after being simplified. The largest shift in position represents 15 feet in real-world units.
The Densify geometries tool adds vertices to a line or polygon layer. The operation is run per polygon or line segment. The tool asks for vertices to be added. The default is one per segment, but can be set to the desired number. This might be the first step before the Extract Nodes tool is used, or there may be other reasons for densifying the geometries:
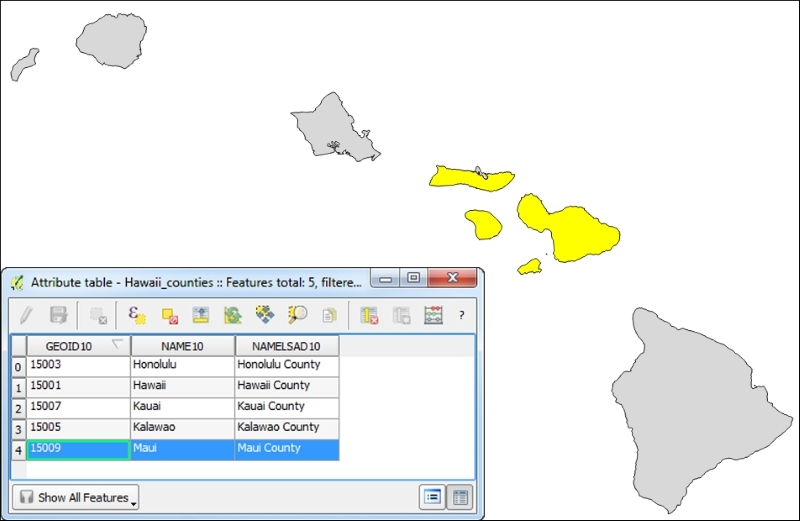
In a typical vector layer, one feature corresponds to one record in the attribute table. In a multipart layer, there are multiple features that are tied to one record in the attribute table. This is often the case with data representing islands. For example, we have some sample data of county boundaries for Hawaii. Hawaii has five counties and the GIS data has five records in the attribute table. However, several of these counties include multiple islands.
To illustrate this point, the following screenshot shows a single record selected in the attribute table that selects multiple polygons which are tied to the single record:
Using the Multipart to Singleparts tool, which can be found by navigating to Vector | Geometry Tools, with Hawaii_counties.shp as the input, we generate a singlepart shapefile with 32 features. The following screenshot shows that a single polygon is now tied to a single record in the attribute table:

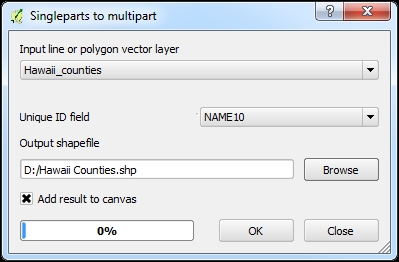
The Singleparts to multipart tool, which can be found by navigating to Vector | Geometry Tools, generates a multipart layer based on an attribute you specify in the Unique ID field input. The options of the Singleparts to multipart tool are shown in the following screenshot:
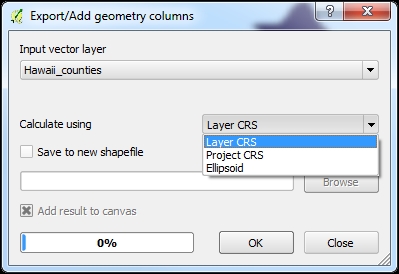
To add geometry values to new attribute columns in a vector layer's attribute table, click on Export/Add Geometry Columns by navigating to Vector | Geometry Tools. As shown in the following screenshot, the tool requires an input vector layer, a determination of which CRS will be used for the calculations (Calculate using), and a choice of whether you wish to create the columns in the existing file or Save to new shapefile with the added geometry columns:
Depending on the geometry type of the input vector layer, different geometry columns will be created as follows: