
This chapter will provide you with more advanced ways to create vector and raster data. There is a great deal of spatial data held in tabular format. Readers will learn how to map coordinate- and address-based data. Other common sources of geospatial data are historic aerial photographs and maps in hard copy. Readers will learn how to georeference scanned imagery and transform it into a target coordinate reference system. The final portion of the chapter will cover testing topological relationships in vector data and correcting any errors via topological editing.
The topics that you will cover in this chapter are as follows:
- Creating points from coordinate data
- Geocoding address-based data
- Georeferencing imagery
- Checking the topology of vector data
- Repairing topological geometry errors via topological editing
There is a lot of data with spatial components stored in spreadsheets and tables. One of the most common forms of tabular spatial data is x and y coordinates that are stored in a delimited text file. The data may have been collected with a GPS receiver, it may have been generated by a surveyor, or it may have been transcribed off topographic maps. Regardless, QGIS can map these coordinates as points by using the Add Delimited Text Layer tool:
This tool can be found by navigating to Layer | Add Layer | Add Delimited Text Layer or on the Manage Layers toolbar.
Delimited text data is simply a table with column breaks that are identified by a specific character such as a comma. With this tool, QGIS can accept either x and y coordinates or Well-Known Text (WKT) representations of geometry. WKT can contain point, line, or polygon geometry. The following is sample data, cougar_sightings.csv, viewed in a text editor. This is a comma-delimited file with x and y coordinate values:
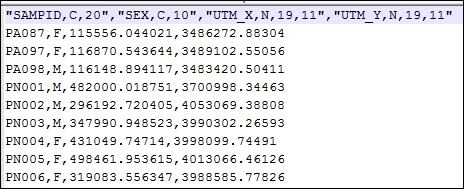
In this example, the first row contains the column names and definitions for the data type in each column. The column names and definitions are enclosed in quotes and are separated by commas. The first column reads "SAMPID, C, 20". In this case, the field name is SAMPID. It is a text field signified by the letter C, which stands for character, with a width of 20 characters. The final two columns contain the coordinates. These are numeric fields signified by the N character. They have a precision of 19 and a scale of 11.
QGIS has three requirements for the delimited text file to be mapped:
- The first row must be a delimited header row of field names
- The header row must contain field-type definitions
- If the geometry values are stored as x and y coordinate values, they must be stored as numeric fields
The Create a Layer from a Delimited Text File tool is simple but robust enough to handle many file-format contingencies. The following is the workflow for mapping data held in such a file:
- Navigate to Layer | Add Layer | Add Delimited Text Layer.
- Select the filename by clicking on Browse... and locate the delimited text file on your system. QGIS will attempt to parse the file with the most recently used delimiter.
- Select Layer name. By default, this will be the prefix of the delimited text file.
- Use the File format radio boxes to specify the format of the delimited text file. You will see how QGIS is parsing the file by the example at the bottom of the Create a Layer from a Delimited Text File window. The following are the options for File format:
- Choose CSV if it is a standard comma-delimited file.
- Custom delimiters can be checked to identify other delimiters used. The choices are Comma, Tab, Space, Colon, Semicolon, or Other delimiters.
- Choose the Regular expression delimiter option if you wish to enter the regular expression for the delimiter. For example,
- The Record options section allows you to specify the number of header lines to discard. In most cases, this option will be set to First record has field names.
- The Field options option allows you to control some field parameters:
- Check Trim fields if you need to trim leading or trailing spaces from your data
- Check Discard empty fields to prevent empty fields from being put into the output
- If commas are also the separators for decimal place values, check Decimal separator is a comma
- Once the file has been parsed, choose an appropriate value from the Geometry definition option:
- If your file contains x and y coordinates, choose Point coordinates and identify the fields containing the x and y coordinates.
- Choose Well known text (WKT) if your file contains WKT geometries. For this option, you will also need to choose the field containing the WKT geometry definitions.
- If the file does not contain any spatial information, choose No geometry and the table will be loaded simply as a table.
- Additionally, you can choose to enable the following options:
- Use spatial index: Creates a spatial index
- Use subset index: Creates a subset index
- Watch file: This setting watches for changes to the file by other applications while QGIS is running
- After you click on OK, the Coordinate Reference System Selector dialog box will open. Use this dialog box to identify the coordinate reference system of the data. It is very important to correctly identify the CRS of the input data. This particular dataset is in EPSG: 26913.
Tip
There is a setting that can affect the behavior of the Coordinate Reference System Selector for both new layers and layers that are loaded into QGIS without a defined CRS. By navigating to Settings | Options | CRS, you can choose how these situations are handled. The choices are Prompt for CRS, Use Project CRS, or Use default CRS displayed below. The default setting is Prompt for CRS. However, if you have this set to Use project CRS or Use default CRS displayed below, then you will not be prompted to define the CRS as described earlier.
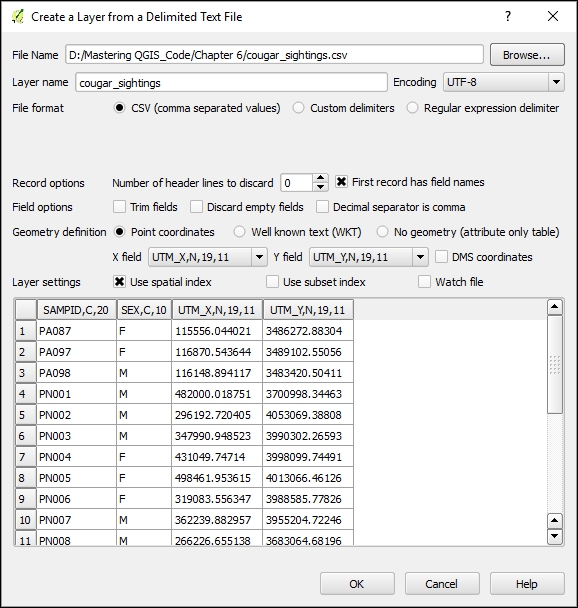
The following screenshot shows an example of a completed Create a Layer from a Delimited Text File tool:
Once the tool has been run, a new point layer will be added to QGIS with all the attributes present in the original file (unless you chose to discard empty fields). However, this is not a standalone GIS layer yet. It is simply a rendering of the tabular data within the QGIS project. As such, it will behave like any other layer. It can be used as an input for other tools, records can be selected, and it can be styled. However, it cannot be edited. To convert the layer to a standalone shapefile or another vector format, click on Save as under Layer or right-click on the layer in the Layers panel and click on Save as. Here, you can choose any OGR-supported file format, along with an output CRS of your choice. The cougar_sightings.csv sample data has coordinates in UTM zone 13 NAD83 or EPSG:26913.
The following screenshot shows the mapped data in the cougar_sightings.csv sample data:
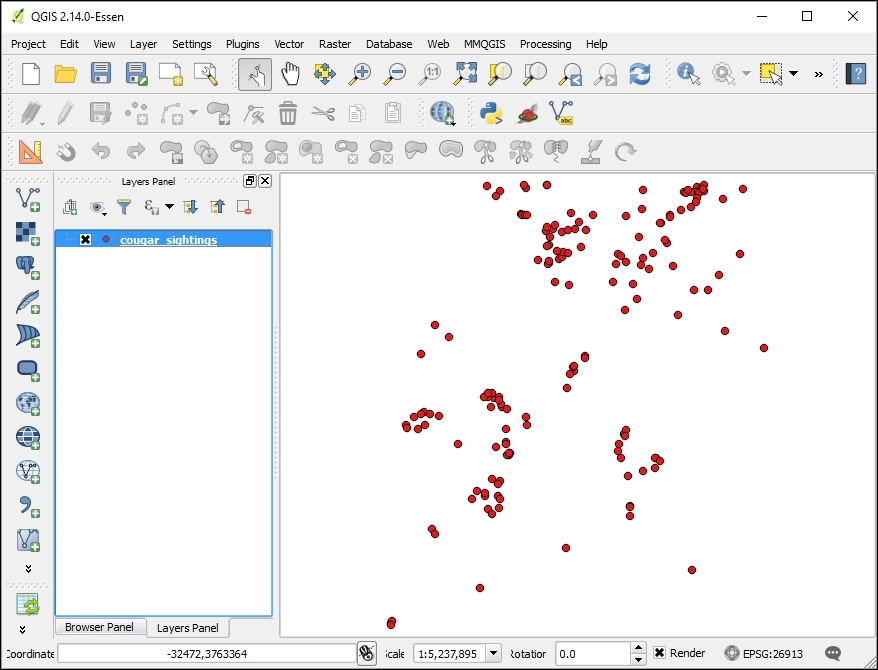
Sample data in cougar_sightings.csv mapped by x and y coordinate values
As mentioned earlier, the Add Delimited Text Layer tool can also be used to map WKT representations of geometry. WKT can be used to represent simple geometries such as Point, LineString, and Polygon, along with MultiPoint, MultiLineString, and MultiPolygon. It can also represent more complex geometry types such as geometry collections, 3D geometries, curves, triangular irregular networks, and polyhedral surfaces. WKT geometries use geometry primitives such as Point, LineString, and Polygon, followed by the coordinates of vertices that are separated by commas.
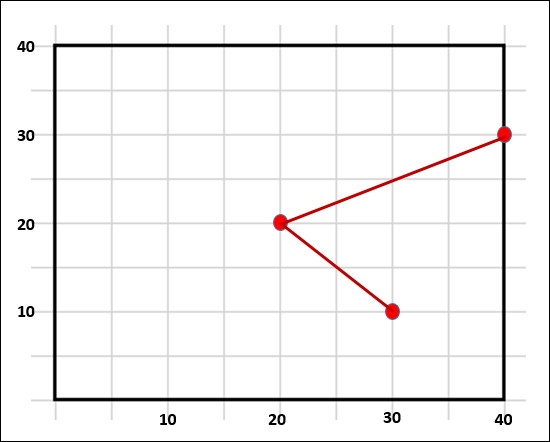
For example, LINESTRING (30 10, 20 20, 40 30) would represent the line feature shown in the following screenshot:
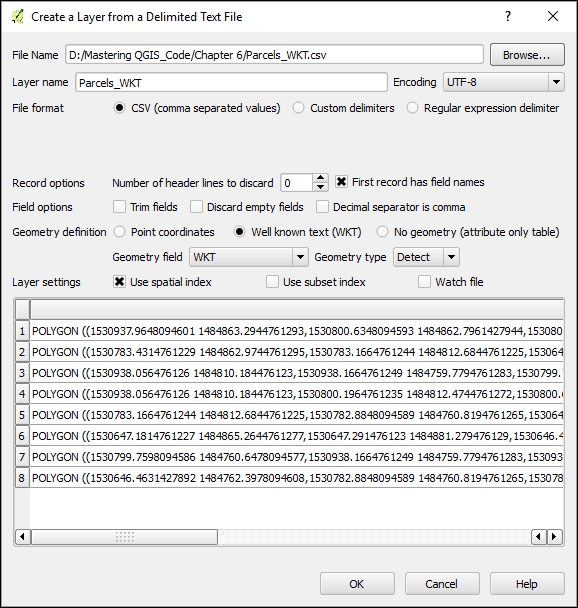
To demonstrate how WKT can be mapped via the Add Delimited Text Layer tool, we will map the Parcels_WKT.csv sample data file; this has WKT geometries for eight parcels (polygons):
- Click on Add Delimited Text Layer by navigating to Layer | Add Layer.
- Select the filename by clicking on Browse... and locate the delimited text file on your system. In this example, the
Parcels_WKT.csvfile is being used. - Choose an appropriate value for the Layer name field. By default, this will be the prefix of the delimited text file.
- Use the File format radio buttons to specify the format of the delimited text file. This is a CSV file.
- For Record options, set the Number of header lines to discard option as 1.
- Set the Geometry definition option to Well known text (WKT).
- Set the Geometry field option to field_1.
- Click on OK and the Coordinate Reference System Selector will open. Use this dialog box to identify the coordinate reference system of the data. For this example, the data is in EPSG: 2903.
The following screenshot shows an example of a completed Create a Layer from a Delimited Text File tool set up to parse a WKT file:
The data layer will be added to the Layers list and will behave like any other vector layer. The following figure shows the resulting parcel boundaries:

Well-known text representations of parcels mapped via the Add Delimited Text Layer tool
Here is a tip describing a way to derive WKT geometries from loaded features.