Performance monitoring and tuning are two tasks that administrators often overlook, but they play an important role in server operations. Many scenarios call for monitoring a server, including the following:
Establishing a baseline of a server’s performance to serve as a reference for future comparison
Monitoring servers to determine load and whether to upgrade the servers or reallocate workloads
Regularly checking for program or operating system errors that can indicate a problem or potential problem
Using a packet sniffer to perform in-depth network troubleshooting when authentication or other communications fail
This chapter discusses how to perform these tasks and others using the tools that come with Microsoft Windows Server 2003 or are available for download. For more in-depth information about performance monitoring and tuning, see the Microsoft Windows Server 2003 Performance Guide book in the Microsoft Windows Server 2003 Resource Kit (Microsoft Press, 2005).
Before monitoring and tuning a server, it is important to gain an understanding of the context in which the server operates. To do so, review or create documentation of the network configuration and usage, and any organizational policies or procedures that relate to the performance of the server.
Accurate and up-to-date documentation of a network helps prioritize performance issues and identify potential bottlenecks in the network. Create or review the following documentation:
Performance Priorities. Applications and network services that are business critical, as well as optimal and minimum required levels of performance for noteworthy applications and services. For example, optimal printing performance might be two minutes to print a 10-page document, while the minimum level of performance during busy times might be 20 minutes to print the same document.
Usage Patterns. Estimates of when users use applications and services. Document daily usage patterns such as the morning logon and e-mail rush, weekly patterns such as end-of-the week report printing, and monthly and yearly patterns such as project deadlines and tax-preparation activities. The following list contains typical user tasks and the network components stressed by the tasks:
Logon and Logoff events (domain controllers, DHCP, and DNS servers)
Software updates (LAN and WAN bandwidth, software update servers)
Accessing documents (file servers, LAN bandwidth)
Database usage (database server)
Internet usage (proxy and firewall servers, routers, and Internet connection)
E-mail usage (e-mail servers)
Wireless usage (access points, RADIUS servers, certificate servers, and domain controllers)
Network Design. The network topology and structure and location of each device. At a minimum, record the following items:
Internet and WAN link speeds
Firewall locations
Router and switch locations and speeds
Physical network topology map
Subnets and Virtual LANs (VLANs)
Domains and sites
Location of client computers, servers, Network Attached Storage (NAS), printers, and other network devices
Note
Include with the network documentation a series of performance-monitoring logs or traces that establish a performance baseline for important servers (as discussed later in this chapter). You can also include simple network benchmarks by timing typical user tasks such as file copy operations, printing, database queries, and Intranet page loads.
Another important factor in performance monitoring is reviewing the organization’s acceptable-use policy and network administrator procedures. Acceptable-use policies for employees might include provisions prohibiting or limiting the use of applications that consume large quantities of network bandwidth, such as Peer-to-Peer (P2P) applications, streaming radio or video, Voice Over Internet Protocol (VOIP) applications, and multiplayer network games.
Examine and update administration procedures as necessary to minimize the performance impact of regularly scheduled tasks such as backup, downloading and installing software updates, and software deployment.
There are numerous methods of monitoring servers running Microsoft Windows. To choose the most suitable method, use the following list.
To quickly check the real-time processor and memory usage on a server, use the Windows Task Manager.
To monitor a large number of servers, use Microsoft Operations Manager (MOM). For more information, see the Microsoft Web site at http://www.microsoft.com/mom.
To check for functionality or security-related problems, use Event Viewer.
To observe performance in real-time, use a graph in System Monitor. Graphs are helpful for short-term monitoring of a remote or local computer.
To perform long-term monitoring and record keeping, use the Microsoft Windows Server 2003 Performance Advisor, Performance Logs And Alerts, or both. Server Performance Advisor provides a simple way to collect counter data, trace data, and system settings and view reports for one or more servers. Performance Logs And Alerts provides a more granular way to collect the counter and trace data, and it enables you to create alerts when specific counters go over or under the specified values.
To monitor data sent over the network to and from a server, usually to troubleshoot network communication, use Network Monitor.
To compare Microsoft Exchange or Microsoft SQL Server installations with a list of best practices, use the Exchange Server Best Practices Analyzer or the SQL Server Best Practices Analyzer (and Microsoft Operations Manager management packs), available from the Microsoft Download Center at http://www.microsoft.com/downloads.
To prioritize applications to maximize server utilization on a server running Windows Server 2003 Enterprise Edition or Datacenter Edition while ensuring that business-critical applications always have sufficient resources, use the Windows System Resource Manager. For more information, see the Microsoft Web site at http://www.microsoft.com/windowsserver2003/technologies/management/wsrm/.
To determine how often to monitor servers or what counters to use when monitoring specific performance aspects such as memory usage, use the following sections.
Real World: Monitoring and Tuning Strategies
When monitoring or tuning a system, use the following strategies:
Make one change at a time. Bottlenecks can be the fault of several components. Do not confuse the issue by making too many changes at once, which can make it impossible to assess the impact each change has on the system.
Keep a record of each change, and repeat the monitoring process after every change. Tuning one resource can affect another and potentially necessitate additional changes.
Retain logs for an extended period, and store the data in a database for trend analysis, performance assessment, and capacity planning.
Pay attention to event logs. Operating system and application errors can have a huge impact on performance. (A failed server does not usually perform well.)
Turn off any screen-saver programs, and stop any services that are not relevant or essential to monitoring the system.
The appropriate sampling interval depends on the duration and goals of the monitoring session. For example, use an interval of 3 to 15 seconds for short monitoring sessions and when searching for brief performance impacts. Use a longer sampling interval for routine, long-term logging or to look for a slow memory leak—5 to 15 minutes usually provides enough detail in this situation while minimizing log file size and the load on the server. Decreasing the sampling interval causes the data rate to increase, producing larger log files and placing a heavier load on the system.
Lack of sufficient memory is one of the most frequent performance issues on a server. To determine whether this is the case, verify that the system has the required amount of memory to run the operating system and all applications and services, and then use Server Performance Advisor, Performance Logs And Alerts, or System Monitor to monitor the counters in the following list. See the Memory and Network Tuning section of this chapter for information about optimizing page files and memory usage.
Memory Available MBytes. Displays the amount of currently unused physical memory (RAM). Windows uses available memory to satisfy the memory requirements of programs. When available memory falls into short supply, Windows takes memory from the working sets of less active programs, which can result in more paging and reduced performance as Windows transfers data to and from the hard disk subsystem. Adding RAM when less than 10 to 15 percent of the total physical memory is available usually improves the performance of a server.
Memory Pages/Sec. Displays the number of pages written to or read from disk to resolve hard page faults. A hard page fault occurs when a process requires code or data that Windows has paged to disk and removed from physical memory. A high value for this counter does not always indicate lack of memory, but if this value is consistently above 20 per page file and the Available MBytes is below 10 to 15 percent of the physical memory in the system, the system probably would perform better with more RAM.
Memory Cache Bytes. Displays the physical memory used by the file system cache and device drivers, as well as operating system and program code that Windows can page to disk when not in use.
To check for a memory leak, look for a steady increase in the following counters regardless of the load on the server:
Memory Committed Bytes. Displays the number of committed bytes of virtual memory. Monitor this counter in conjunction with Memory Available Bytes.
Process Working Set, Process Virtual Bytes, and Process Handle Count. The Process Working Set and Virtual Bytes counters display the amount of physical memory and total memory allocated to all threads in the process you suspect might have a memory leak. The Process Handle Count counter displays the number of handles used by the process.
Memory Pool Nonpaged Bytes. Displays the number of bytes allocated to the nonpaged pool for objects that Windows must keep in physical memory as long as they are allocated. Use this counter in conjunction with Memory Pool Nonpaged Allocs if you suspect that a kernel-mode process (such as a device driver) is the cause of a memory leak.
Memory Pool Nonpaged Allocs. Displays the number of calls to allocated space in the nonpaged pool.
To monitor paging, use these counters:
Paging File % Usage (all instances). Displays the current percentage of used space in all page files on the system. If you suspect that paging is to blame for a bottleneck, review this value along with Memory Available Bytes and Memory Pages/Sec. Enlarge the page file(s) if the Paging File % Usage counter exceeds 70 percent.
Physical Disk Avg. Disk Sec/Transfer and MemoryPages/Sec. The Physical Disk Avg. Disk Sec/Transfer counter displays the average duration of each disk-transfer operation in seconds. The Memory Pages/Sec counter displays the number of pages written to or read from the disk when a process requires information that is no longer in its working set and must be retrieved from disk. To determine whether the system is paging excessively, multiply the values of these two counters. If the result exceeds 0.1, paging is taking up more than 10 percent of disk access time. If this condition persists over a long period, add RAM to reduce paging.
Two common causes of processor bottlenecks are excess demand placed on the processor by CPU-bound programs and excess interrupts generated by drivers or subsystem components, such as disk or network components. When a bottleneck occurs because a process’s threads need more processor cycles than are available, processor queues build up, causing the system response to suffer.
To monitor processor activity, examine the server roles and applications in use on the server and then use Server Performance Advisor, Performance Logs And Alerts, or System Monitor to monitor the following counters:
Processor % Processor Time (all instances). Displays the percentage of time all processors in the system are busy. If the counter consistently exceeds 85 percent, evaluate whether the server meets the performance priorities of the organization during periods of heavy load. If it does not, install additional processors, upgrade the processors, or transfer server roles to another server to reduce load.
Processor % User Time. Displays the percentage of nonidle processor time that the server spends in user mode, where most applications and services run. To resolve a high rate, move workloads to another server, or upgrade or install additional processors. Use this counter in conjunction with Processor % Processor Time (all instances).
System Processor Queue Length (all instances). Displays the number of threads waiting to execute. A sustained queue length of more than two to five items per processor or processor core indicates that the processors cannot keep up with the load.
Server Work Queues Queue Length. Displays the number of Server service threads waiting to execute. A queue length of greater than four over a sustained period indicates possible processor congestion from the Server service.
Processor Interrupts/Sec. Displays the number of hardware interrupts received and processed by the processor per second. Use this counter to determine whether interrupt activity is causing a bottleneck. A dramatic increase in this counter value without a corresponding increase in system activity indicates a possible hardware problem. To resolve this problem, find the network adapter or other device that is causing the interrupts. Refer to the manufacturer’s specifications for the acceptable processor threshold; use 1000 interrupts per second as a starting point.
Processor % Interrupt Time. Displays the percentage of time the processor spends receiving and servicing hardware interrupts during the sampling interval. This value gives you an indirect indication of the activities of devices that generate interrupts, such as disk drives, network adapters, and other peripheral devices. These devices interrupt the processor when they require attention or complete a task.
Processor % Privileged Time. Displays the percentage of nonidle processor time designated for hardware-manipulating drivers and operating system components. A high rate indicates a failing device or device driver. Use this counter in conjunction with Processor % Processor Time (all instances).
Monitor disk activity using the Server Performance Advisor, Performance Logs And Alerts, or System Monitor to determine whether the disk subsystem of a server is performing acceptably. When used in combination with the Storage Reports feature of File Server Resource Manager (discussed in Chapter 20), the following counters present a good summary of the health of a server’s storage subsystem:
Note
Windows Server 2003 and Windows XP enable disk counters permanently. To enable disk counters for Windows 2000 or Windows NT, use the Diskperf command. (Type Diskperf -? at a command prompt for additional information.)
Physical Disk Current Disk Queue Length (all instances). Displays the number of requests waiting for disk access. This number should remain steady at no more than 1.5 to 2 times the number of spindles that make up the disk subsystem. Most disks have one spindle; redundant array of independent disks (RAID) devices have two or more spindles.
Physical Disk % Disk Time. Displays the percentage of time that a drive is active. If the value of this counter rises to more than 90 percent, check the Physical Disk Current Disk Queue Length (all instances) counter to see how many disk requests are queued for disk access. RAID devices can cause the Physical Disk % Disk Time value to exceed 100 percent and thus give an incorrect reading.
Physical Disk Avg. Disk Sec/Transfer. Displays the amount of time a disk takes to fulfill a request. A high value might indicate that the disk controller is continually trying to access the disk because of failures. For most systems, a value of 0.3 seconds or higher indicates a high average time for disk transfers.
Physical Disk Avg. Disk Bytes/Transfer. Displays the average number of bytes transferred from or to a disk during read or write operations. A value less than 15 KB under load might indicate that an application is accessing the disk drive inefficiently or that the drive is fragmented.
Physical Disk Disk Transfers/Sec. Displays the number of bytes transferred to and from the storage subsystem. If these counters indicate that actual usage is near the minimum sustained transfer rate of the physical disks, reduce the server’s workload or upgrade to a RAID subsystem.
There are two primary reasons to monitor network activity: to troubleshoot network issues such as authentication, or to observe network performance. To troubleshoot network issues, use Network Monitor, as discussed in the Using Network Monitor section of this chapter. To observe basic network performance, monitor the following counters using Server Performance Advisor, Performance Logs And Alerts, or System Monitor. Abnormal network counter values usually indicate a problem or shortcoming of the server’s processor, memory, or storage subsystems, though they can occasionally be due to a saturated network segment or interface, a broadcast storm or a failed network card.
Server Bytes Total/Sec. Displays the number of bytes the Server service has sent to and received from the network. This value is helpful in providing an indication of how busy the server is. Segment the network if the sum of the Bytes Total/Sec for all servers is close to the maximum transfer rate of the network.
Server Work Item Shortages. Displays the number of times no work items are available to service incoming requests. Consider tuning InitWorkItems or MaxWorkItems in the registry key HKEY_LOCAL_ MACHINESYSTEMCurrentControlSetServices LanmanServer if the value of the Server Work Item Shortages counter reaches or exceeds the threshold of 3.
Server Server Sessions and Server Logon/sec. Displays the number of connections to the Server service and the number of logons per second. A high number of sessions or logons can indicate a busy (and perhaps overloaded) server. Use Network Monitor to pinpoint traffic from individual computers.
Event Viewer is both a service and a Microsoft Management Console (MMC) snap-in that tracks and displays events recorded in the application, security, and system logs. It gathers information about software, hardware, and system problems and tracks security events. When you launch Event Viewer (Eventvwr.msc) from the Administrative Tools folder on the Programs menu, the Event Viewer console appears. (See Figure 35-1.)

More Info
For information about using Event Viewer to audit events, see Chapter 12.
By default, Windows Server 2003 creates three event logs. As you assign additional roles to the server, these roles might create additional logs. The default logs are:
Application log. Contains events logged by programs or applications. For example, a database program might log a file error in the program log. Application and program developers determine the events that programs log. All users can view this log, which is stored in the %WINDIR%System32ConfigAppEvent.evt file by default.
Security log. Records security events such as invalid and valid logon attempts and events related to resource use, such as creating, opening, or deleting files. Only administrators can view this log, which is stored in the %WINDIR%System32ConfigSecEvent.evt file by default. You can also set an auditing policy in the registry to halt the system when the security log becomes full. See Chapter 11 for information about creating an auditing policy using Group Policy.
System log. Contains events logged by the Windows Server 2003 system components. For example, services that fail during startup generate errors in the System log. All users can view this log, which is stored in the %WINDIR%System32Configfile by default.
The two key components in the interpretation of an event are the event header and the event description. The event description is the most useful piece of information because it indicates the significance of the event.
Windows displays event headers in columns in the Event Viewer console, as shown in Figure 35-2 and described in the following list:
Type. Lists the severity of the event. Event Viewer classifies events in the application, system, and security logs using the following classifications, which are represented by symbols in the normal view:
Information. Describes the successful operation of a service, driver, or application. For example, when the Event Log service starts successfully, it records an Information event.
Warning. Indicates events that pose a possible future problem. For example, when Windows cannot renew its IP address, it generates a Warning event.
Error. Indicates that a significant problem has occurred, such as loss of functionality or loss of data. For example, if a service such as Net Logon fails to load, it generates an Error event.
Failure Audit. Lists a failed attempt to perform an audited security event. For example, if a user fails a logon attempt, Windows generates a Failure Audit event.
Success Audit. Lists a successful attempt to perform an audited security event. For example, when a user logs on successfully, Windows generates a Success Audit event.
Date. Indicates the date the event occurred.
Time. Indicates the (local) time the event occurred.
Source. Lists the software that logged the event. The software can be a program name, a component of the system, or a component of a large program, such as a driver name.
Category. Shows the way the event source classifies the event; primarily used in the security log. Security audits are one type of event that Windows classifies here.
Event. Lists the event number that identifies the particular event type. The name of the event type is usually contained in the first line of its associated description.
User. Indicates the user name of the user for whom the event occurred. If a server process caused the event, the user name is the client ID. If impersonation is not taking place, Windows displays the primary ID. Impersonation occurs when one process takes on the security attributes of another process, and is normal. The security log entry lists both the primary and the impersonation IDs when applicable.
Computer. Specifies the name of the computer on which the event took place.

Double-clicking a specific event in Event Viewer displays the Event Properties dialog box shown in Figure 35-3. This dialog box describes the event and usually includes a link to more information about the event on the Microsoft Help and Support Center Web site. If the description is not helpful, select noteworthy text or the Event ID, press Ctrl+C to copy the text, and then perform a Web search for more information using the text you copied.

Event Viewer can display the event log for remote machines running Windows Server 2003, Windows XP, Windows 2000, or Windows NT. To view the event log for another computer, right-click Event Viewer (Local) at the top of the tree and choose Connect To Another Computer. In the Select Computer dialog box, type the name of the other computer, or click Browse to search for the desired computer.
To tune Event Viewer for a low-speed connection to the remote machine, right-click the log, choose Properties, and then select Low Speed Connection in the Properties dialog box.
Note
For more sophisticated monitoring and analysis of a large network of computers, use Microsoft Systems Management Server (SMS), Microsoft Operations Manager (MOM), or both. Information about these products is available at http://www.microsoft.com/smserver and http://www.microsoft.com/mom.
To change Event Log settings, right-click the log in Event Viewer, choose Properties, and then use the following list:
To change the size of the event log, use the Maximum Log Size box to specify a new log size 4 GB in size or smaller. Before decreasing the size of the log file, clear the log of events by right-clicking the log and choosing Clear All Events.
By default, the application, security, and system logs each have a maximum size of 16 MB in Windows Server 2003 (8 MB for Microsoft Windows XP Service Pack 1, and 512 KB for Windows XP and Windows 2000).
To change the action Windows performs when a log file is full, choose one of the following options: Overwrite Events As Needed, Overwrite Events Older Than, or Do Not Overwrite Events. Windows overwrites events as needed by default. Logging stops if the log file is full and cannot overwrite itself.
Note
You can use Group Policy to specify log file settings. To do so, in the Group Policy Object Editor, click Computer Configuration, Windows Settings, Security Settings, and then Event Log. See Chapter 11 for coverage of Group Policy.
To save an event log to a file, right-click the log in Event Viewer and then choose Save Log File As. You can archive event logs in one of the following three formats:
Event Log. Allows you to view the log in Event Viewer. Its extension is .EVT.
Text (Tab delimited). Enables you to view the data easily in any text editor or word processor. Its extension is .TXT.
CSV (Comma-delimited text). Enables you to use the data in a spreadsheet or flat-file database. Its extension is .CSV.
To open an archived log file saved in the Event Log (.evt) format, right-click a log in Event Viewer, choose Open Log File, and then search for the log file in the Open dialog box.
The easiest way to monitor the performance of a single server running Windows Server 2003 is to use the Microsoft Windows Server 2003 Performance Advisor tool (Server Performance Advisor), which is available from the Microsoft Download center at http://www.microsoft.com/downloads. This program creates customizable reports that provide a summary of the overall performance of one or more servers running Windows Server 2003, with supplemental detail that simplifies further analysis and troubleshooting.
Although Server Performance Advisor can monitor multiple servers, the setup process is complex (as discussed later in this section), making it a less suitable solution for casual monitoring.
Note
To use the Server Performance Advisor with Microsoft Operations Manager, download the Microsoft Windows Server 2003 Performance Advisor Management Pack for Microsoft Operations Manager 2005 from the Microsoft Download Center at http://www.microsoft.com/downloads.
The Server Performance Advisor uses three types of data sources to collect data: performance counters (which are also used by System Monitor), trace providers (data from Event Tracing for Windows, or ETW), and configuration settings (registry settings). The Server Performance Advisor groups these data sources into one or more "data collector groups" that gather data and prepare reports. Server Performance Advisor creates one data collector group by default, the System Overview, but you can easily add other data collector groups by server role, or create your own.
Note
Because reports use a large amount of disk space (approximately 20 MB per 100 seconds for the System Overview), the default data collector groups monitor for short periods of 100 to 300 seconds. Schedule or run data collector groups manually during periods that represent normal, heavy, and low usage to obtain a better overall understanding of a server’s performance.
The first time you open the Server Performance Advisor, the Start Page appears. Click Quick Tour to analyze the overall system performance of the server during the next 100-second period, or click Add/Repair Data Collector Groups to add data collector groups. Choose Add/Repair Data Collector Groups from the File menu to add other data collector groups.
Click the icon on the left of the Start Page to display the Scope Tree (console tree), which is shown in Figure 35-4. The console three has the following three nodes:
Data Collectors And Reports. Lists data collection groups, the data collectors for each group, and the reports generated by each group. Use this node to view reports generated by the System Overview data collection group or other data collection groups.
Trace Providers. Lists trace providers that you can drag into data collection groups to add them to the data sources included in reports.
Performance Counters. Lists performance counters that you can drag into data collection groups to add them to the data sources included in reports.

Note
You can create and view customized groups of performance counters using Server Performance Advisor. To do so, first right-click Performance Counters in the console tree (also known as the Scope Tree), choose New, and then select Counter Group. Then drag counters from the All Counters group into the counter group you created. After adding the appropriate counters, drag the counter group into the main window to display System Monitor with the selected counters.
To start recording data, select the appropriate data collection group, and then click the Start System Overview button (for example) on the toolbar. Server Performance Advisor collects data for the specified period and then generates a report from the data, as shown in Figure 35-4.
To view recorded data in System Monitor, click the Show System Monitor toolbar button. Even though the data in a report is static, you can add or remove counters from the System Monitor view, or use the System Monitor view to change the timeframe and then regenerate the report by clicking the Window Report toolbar button.
To schedule a data collection group, right-click the data collection group (for example, System Overview), choose Properties, and then click the Schedule tab, shown in Figure 35-5. Use the Duration box to change how long the data collection group gathers data, and click Change to schedule the data collection.

Server Performance Advisor can monitor multiple servers (data servers) from a single report server running Server Performance Advisor, thereby centralizing monitoring and reporting. Unfortunately, setup is complex. This is because the System Service account under which Server Performance Advisor runs does not have sufficient permissions to run the appropriate tasks and transfer data across the network. Running the Server Performance Advisor with an account that belongs to the Domain Admins group fixes this problem, but it poses a large security risk!
The best workaround is to run Server Performance Advisor on the data servers using an account that belongs to the local Performance Log Users group. To do this and set up a central report server to monitor multiple data servers, use the following steps:
Install Server Performance Advisor on the report server and all data servers. To deploy Server Performance Advisor to a large number of servers, use Group Policy as described in Chapter 28.
Create a Global group called Server Performance Advisor Users (or another descriptive name).
Create a user account with a nonexpiring password, and add it to the Server Performance Advisor Users group. Limit the permissions given to the account, and deny the account dial-in rights by right-clicking the account in Active Directory Users And Computers, clicking Properties, clicking the Dial-In tab, and then selecting the Deny Access check box.
Add the Server Performance Advisor Users group to the Performance Log Users local group (or built-in group on domain controllers) on all data servers and the report server that generates reports.
Share the PerfLogsTransfer folder on the report server, or create a suitable DFS folder. (See Chapter 20 for information about the Distributed File System.)
Set the Share permissions on the Transfer share to give the Everyone group Full Control permissions, and set the NTFS permissions on the folder to give Write permissions to the group or groups to which all data server computers belong, as well as the Server Performance Advisor Users group or the built-in Performance Log Users group.
Schedule the appropriate data collection group on each data server as described in the Recording and Viewing Data section of this chapter.
Open the Readme.txt file in the Program FilesServer Performance AdvisorData folder, and use the sample code at the end of the file to create a batch file that sets the proper permissions for the Scheduled Tasks folder and Server Performance Advisor jobs.
Run the batch file on each data server. For example, open a command prompt window and then type PerfLogUsersUseSPA.bat All /G to enable members of the Performance Log Users group to run all report jobs, where PerfLogUsersUseSPA.bat is the name of the batch file.
On the report server and each data server, right-click Local Computer in the System Performance Advisor console tree, choose Properties, and then use the Local Computer Properties dialog box to change the Transfer folder location to the Transfer share or DFS folder.
On each data server, choose Data from the Role box in the Local Computer Properties dialog box.
On the report server, choose either Report from the Role box in the Local Computer Properties dialog box or Both to collect data from the report server as well as the data servers.
Right-click the appropriate data collection group on the report server, choose Properties, and then change the Generate property to Every 10 Minutes to force System Performance Advisor to check for new data from the data servers every 10 minutes.
Right-click the appropriate data collection group on each data server, choose Properties, and then under Run As type the username and password of the dedicated user account you created.
Note
When testing this functionality, set the schedule to a couple minutes from the current time, but remember to check the starting date. If you have trouble getting it to work, try adding the user temporarily to the Domain Admins group to ascertain whether there is a problem with permissions. Refer to the Readme.txt file in the Program FilesServer Performance AdvisorData folder for more troubleshooting information.
System Monitor is a utility designed to track various processes on a Windows Server 2003 system in real time, using a graphical display. Use the data from System Monitor to quickly evaluate a server’s current performance. Use the Server Performance Advisor and/or Performance Logs And Alerts tools as described elsewhere in this chapter to perform long-term monitoring or create performance baselines.
When you launch the Performance (Perfmon.msc) MMC snap-in from the Administrative Tools folder, the main console (shown in Figure 35-6) appears, displaying the Pages/sec, Avg. Disk Queue Length, and % Processor Time counters.
Note
Save changes to the Performance console using a filename other than Perfmon.msc to avoid changing the default configuration of the performance tools on the computer.

System Monitor can display dozens of counters at a time. To add counters, use the following steps:
Click Add Counters to display the Add Counters dialog box. (See Figure 35-7.)
Select the Select Counters From Computer option, and then type the name of the server to monitor.
Choose an object to monitor from the Performance Object list.
Select the Select Counters From List option, and then choose a counter. Click Explain to obtain a description of the counter.
If you select a counter that has multiple instances, choose All Instances to monitor all instances of the selected counter, or choose Select Instances From List to specify the instances to monitor. Be aware that the instance index number assigned to a particular instance might change over time because whenever Windows starts or stops an instance, it might give the instance a different instance number.

There are two ways to determine which counter matches a line on the graph:
Compare the color and bar thickness of each counter within the legend to the lines in the System Monitor graph.
Double-click a line in the graph to select the corresponding counter in the legend located under the graph. If chart lines are close together, locate a position in the graph where they diverge.
Note
You can highlight a chart line by clicking the counter to highlight and then clicking the Highlight toolbar button. A black line replaces the colored data line if the background color of the chart is white or a light color; for all other background colors, the line is white. To highlight a different line double-click it. System Monitor highlights whatever line you click as long as the Highlight button is depressed.
You can change the way System Monitor displays information by using the System Monitor Properties dialog box. (See Figure 35-8.) To access this dialog box, click Properties on the toolbar or right-click in the details pane and choose Properties from the shortcut menu.

On the General tab the System Monitor Properties dialog box, you can choose to view the data in the form of a graph, histogram, or report:
Graph view. Presents information in a traditional line-graph format. System Monitor displays each of the counters and instances with a different color and line thickness, as shown in Figure 35-6. This view is the default, and it offers the greatest variety of options.
Histogram view. Presents information in a bar-graph format. As in graph view, System Monitor displays each of the counters and instances in a different color. You can easily track up to 100 counters using this view because System Monitor adjusts the bars to fit the display.
Report view. Presents the counter data in a report list format. System Monitor lists objects in alphabetical order, as is the case for each of the chosen counters. System Monitor displays the data itself numerically. Each object displays the total percentage of processor time in use for the chosen counters. This view works well for tracking a large number of counters.
Choose which display elements to view, as described in the following list:
Legend. Displays a legend at the bottom of the details pane that shows the data scale for each counter, the counter name, the instance, the parent object (if applicable), the object the counter belongs to, the computer being monitored, and the color used to draw the line for the counter. Display the legend to see the counter name associated with a data line.
Value Bar. Displays a value bar at the bottom of the details pane that provides a way to display the last, average, minimum, and maximum values recorded for the selected counter. System Monitor calculates the values from the number of samples and period displayed in the graph. The value bar also displays the total elapsed time displayed in the graph, which System Monitor derives from the sampling interval.
Toolbar. Displays the toolbar functions across the top of the details pane. The toolbar is the only way to do some tasks in System Monitor.
System Monitor displays 100 samples onscreen at a time and uses a default sampling interval of one second, yielding 100 seconds (one minute and 40 seconds) of samples by default. To change how frequently System Monitor samples data, use the Sample Automatically Every n Seconds box on the General tab of the System Monitor Properties dialog box. To view longer periods and decrease the load placed on the server by System Monitor, increase the sampling interval.
To enable vertical or horizontal grid lines or adjust the scale of the graph or histogram, use the following list:
To add vertical and horizontal grid lines to the graph and histogram views, click the Graph tab of the System Monitor Properties dialog box, and then select the Vertical Grid and/or Horizontal Grid checkboxes.
To change the maximum and minimum vertical scale values of the graph, use the Maximum and Minimum boxes on the Graph tab. The defaults are 100 for the maximum value and 0 for the minimum value. The highest value you can specify is 999999999, and the lowest value is 0. Both of these values must be a positive integer. To determine the vertical scale range, look at the range of values generated by the counters you are monitoring.
To adjust the counter scale settings for a specific counter, click the Data tab, select the counter, and then use the Scale box. Counter scale values can range exponentially from 0.0000001 to 1000000.0. Adjusting the scale does not affect the statistics displayed in the value bar.
Performance Logs And Alerts is a useful tool for monitoring one or more servers over a long period. It can record counter logs and trace logs, as well as generate alerts when counters go over or under the values you specify. You can import the log files into spreadsheets or databases for analysis and report generation or into System Monitor for viewing. Performance Logs and Alerts runs as a service, obviating the need for a logged-on user.
There are two types of data that Performance Logs And Alerts can collect: counter logs and trace logs, as discussed in the following list:
Counter logs. Collects data from the specified object at a predefined interval. Counter logs are helpful for recording data about system services activities and hardware usage. You can log data on demand or schedule logging to start and stop automatically. The system can also perform continuous logging, depending on the file size and duration limits. You can view logged data through the System Monitor display or export it to spreadsheets or databases.
Note
To view data from a counter log in real-time, save the log settings as an HTML page, as discussed in the Saving Log and Alert File Settings section of this chapter. The resulting page hosts the System Monitor ActiveX control that displays the counter data in real-time.
Trace Logs. Monitors data continuously and waits for specific events, such as page faults, to occur. Trace logs record data into a trace log file. To interpret a trace log file, use a parsing tool.
Note
A parsing tool is software that reads the raw data and puts it into a form you can understand. Developers can create parsing tools by using the APIs provided at Microsoft’s MSDN Online Library site at http://msdn.microsoft.com/library/default.asp or by using Log Parser 2.2, which is available from the Microsoft Download Center at http://www.microsoft.com/downloads.
To create a counter log or a trace log, perform the following steps:
Open the Performance (Perfmon.msc) MMC snap-in from the Administrative Tools folder, and then double-click Performance Logs And Alerts.
Performance Logs And Alerts lists existing logs in the details pane. A green icon indicates a log that is running; a red icon indicates a log that is not.
Right-click either Counter Logs or Trace Logs, and then choose New Log Settings.
In the New Log Settings dialog box, type a name for the log settings and then click OK.
Choose the objects and counters or trace log providers to monitor, as described in this list:
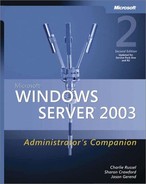
When creating a counter log, click Add Objects or Add Counters to collect data from entire objects or specific counters. (See Figure 35-9.) See the Adding Counters section earlier in this chapter for more information.
When creating a trace log, select Events Logged By System Provider and then select the appropriate system providers, or select Nonsystem Providers and then click Add to monitor trace providers not associated with the core operating system.
When creating a counter log, use the Interval box to specify the sampling interval. For guidelines about setting sampling intervals, see Determining How Often to Monitor earlier in this chapter.
Click the Log Files tab, choose a log file type (as described in the Understanding Log File Parameters sidebar), and specify the ending to use for log file names. (See Figure 35-10.)
Click the Schedule tab, and set the appropriate schedule for the log file.

To save the settings for a log or an alert file, right-click the name of the log or alert file in the details pane, and then choose Save Settings As. Use the Save As dialog box to save the settings as an HTML file.
To use the saved settings for a new log or alert, right-click Counter Logs, Trace Logs or Alerts in the details pane, choose New Log Settings From, and then select the HTML that file contains the settings to use.
Use the alerts feature of Performance Logs and Alerts to log entries in the application event log, start performance logs, send network messages, or run custom commands when counters fall below or rise above values you specify.
To create an alert, follow these steps:
Open the Performance (Perfmon.msc) MMC snap-in from the Administrative Tools folder and then double-click Performance Logs And Alerts.
Performance Logs And Alerts lists existing alerts in the details pane. A green icon indicates an alert that is running; a red icon indicates an alert that is not.
Right-click Alerts and choose New Alert Settings.
In the New Log Settings dialog box, type a name for the log settings and then click OK.
Click Add and then use the Add Counters dialog box to select a counter to monitor. See the Adding Counters section earlier in this chapter for more information.
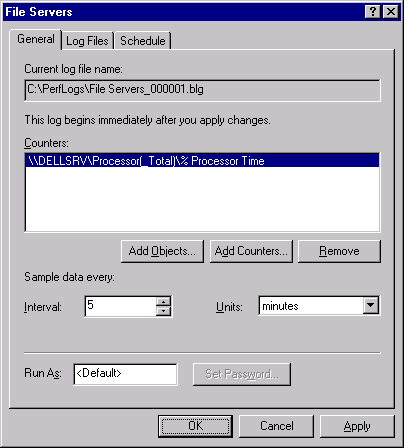
Use the Alert When The Value Is and Limit boxes shown in Figure 35-11 to specify when to trigger an alert. Use System Monitor, Performance Logs And Alerts, or the Server Performance Advisor to determine an appropriate value.
Use the Interval box to specify the sampling interval. For guidelines about setting sampling intervals, see the Determining How Often to Monitor section earlier in this chapter.
Click the Action tab and then specify what actions to perform when the counter exceeds the specified threshold, as described in the following list:
Log An Entry In The Application Event Log. Logs an entry in the application event log of Event Viewer
Send A Network Message To. Sends an alert message to the specified computer using the Messenger service (if the service is not disabled on the target computer)
Start Performance Data Log. Runs an existing counter or trace log
Run This Program. Specifies a command file and command-line arguments to run when an alert occurs
Click the Schedule tab, and specify when to make the alert active.
Network Monitor is a packet-sniffer included with Microsoft Windows Server 2003 that captures and displays frames received from the network. It provides a way to examine at a low-level data traversing the network, and it’s invaluable for troubleshooting network issues such as authentication or connection problems.
Network Monitor consists of two components that you must install using the Windows Components Wizard or Sysocmgr.exe: Network Monitor, and the Network Monitor driver. The Network Monitor driver enables Network Monitor to receive frames from the network adapter and is compatible with Windows Server 2003, Windows XP, or Windows 2000.
Note
The Systems Management Server (SMS) version of Network Monitor adds a number of features, including the ability to put the network adapter in promiscuous mode. Promiscuous mode allows the adapter to read all the frames (packets) it receives over the network, instead of only packets addressed to the server. This mode does not work unless the network uses a hub or a switch with port mirroring activated.
To capture frames from the network, use the following steps:
Open Network Monitor from the Administrative Tools folder using an account with local Administrator permissions.
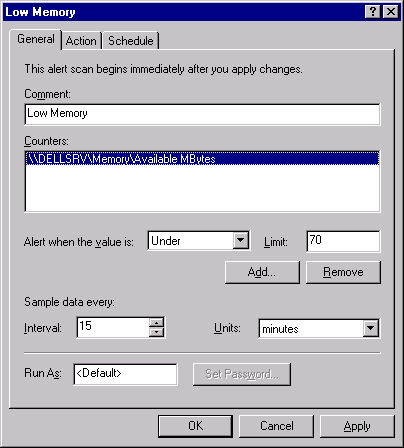
Click OK and then select the network to monitor in the Select A Network dialog box, as shown in Figure 35-12, and then click OK again. If this dialog box does not appear, choose Networks from the Capture menu to open it.
Click Start Capture on the toolbar of the Capture window to begin capturing frames.
For more information about the Capture window, see the Viewing the Capture Window section of this chapter.
To halt the data capture temporarily, choose Pause from the Capture menu. To stop capturing data, click Stop And View Capture on the toolbar.
Note
Network Monitor displays network statistics while capturing all network packets to a temporary 1 MB capture file with the .CAP extension located in a subfolder of the Documents and SettingsUserLocal SettingsTemp folder. To change the amount of data Network Monitor captures, see the Modifying the Capture Buffer section of this chapter.
Network Monitor displays the Capture window when you open Network Monitor and during a capture. After a capture, use the Window menu to switch between the Capture window and the Frame Viewer window.
The Capture window has four panes that display frame statistics, as discussed in the following list and shown in Figure 35-13:
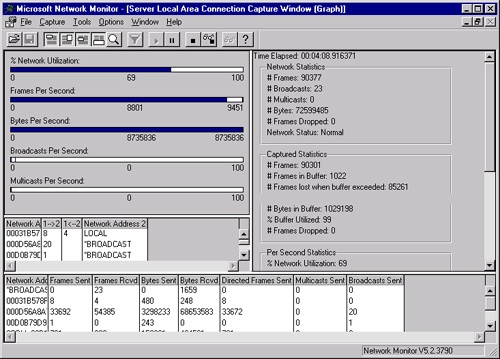
The graph pane (the upper leftmost pane in Figure 35-13) graphically displays the total capture statistics of current network activity.
The session statistics pane (the middle left pane in the figure) displays statistics for current individual network sessions. Network Monitor identifies both participants in a session and the amount of information passed between them in either direction. Network Monitor displays only the first 128 unique addresses, so use a capture filter to identify a specific workstation on a busy network segment.
The station statistics pane (the bottom pane in the figure) displays statistics about activities that occur from or to the local machine running Network Monitor. As with the session statistics pane, Network Monitor displays only the first 128 unique addresses.
The total statistics pane (the rightmost pane in the figure) summarizes statistics about overall network activity detected by Network Monitor from the time the current capture process began. The total statistics pane consists of five panels:
Note
Not all network adapter cards support all statistics—if the network adapter card does not support a statistic, Network Monitor replaces the label for a statistic with the word "Unsupported".
Network Statistics displays statistics about the total amount of traffic that has occurred since the current capture on Network Monitor began. The status is always Normal on an Ethernet network and reflects the status of the ring on a token ring network.
Captured Statistics displays statistics regarding the current capture that is running.
Per Second Statistics displays averages of current activity. All frames, even those excluded by a filter, are included in these statistics.
Network Card (MAC) Statistics reflects the average activity detected by the network adapter from the time the current capture session began.
Network Card (MAC) Error Statistics displays network adapter card errors that have occurred from the time the current capture session began.
Network Monitor displays captured frames in the Frame Viewer window (shown in Figure 35-14), which appears after you click Stop And View Capture. To return to the Capture window, select the appropriate capture from the Window menu.

The Frame Viewer window has three panes, which you can toggle using the toolbar buttons:
The Summary pane displays general information about the captured frames in the order in which Network Monitor captured them.
The Detail pane displays the frames’ contents, including the protocols used to send them.
The Hex pane displays the ASCII and hexadecimal representation of the captured data.
Double-click a frame to display the Detail and Hex panes for that frame; double-click the frame again to hide the detail and hex panes. If double-clicking a frame does not display a pane, select Zoom Pane and all windows from the Window menu.
This section describes how to expand the capture buffer to capture more data, edit the address database, add comments to a capture, or print captured frames.
By default, Network Monitor captures a maximum of 1 MB of data in its capture buffer (a binary file with the .CAP extension saved in the Windows Temp folder). When the buffer is full, Network Monitor overwrites the oldest data with the newest.
To adjust the size of the capture buffer in Network Monitor, choose Buffer Settings from the Capture menu and then use the Capture Buffer Settings dialog box to adjust the Buffer Size (MB) or Frame Size (Bytes) options. Network Monitor supports capturing and displaying up to 1 GB of data at a time.
To make the Frame Viewer window easier to understand, you can replace IP addresses with computer names. To do so, choose Find All Names from the Display menu in the Frame Viewer window. Alternatively, you can right-click an IP address in the Frame Viewer window, choose Edit Address, and then use the Nslookup command at a command prompt to resolve the computer name for the appropriate IP address (provided that the network has a reverse lookup zone and that the host in question has a PTR record in the zone), and then type the host name in the Address Information dialog box. To save this name in Network Monitor’s local address database, select the Permanent Name checkbox.
To display the address database (shown in Figure 35-15), choose Addresses from the Display menu of the Frame Viewer window. Click Save to export the database to a file, or click Load to import a previously saved address database.

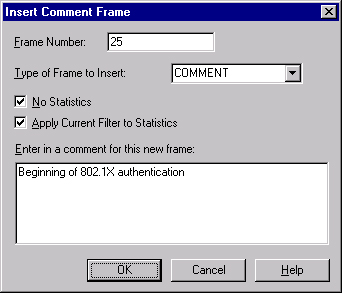
A comment frame is a helpful tool you can use to add comments or other information to a capture file within the Frame Viewer. For example, use comment frames to mark the beginning and ending points for a group of authentication frames.
To add a comment frame, choose Insert Comment Frame from the Tools menu or right-click the Frame column at the point to insert the comment frame and choose Insert Comment from the shortcut menu. The Insert Comment Frame dialog box appears. (See Figure 35-16.) The options in this dialog box are as follows:
Frame Number. The frame position where Network Monitor places the comment frame within the capture. Network Monitor lists the selected frame by default.
Type Of Frame To Insert. The Comment or Bookmark protocol parser used to process the comment frame. The default parser is Comment.
No Statistics. Disables statistical generation for the comment frame.
Apply Current Filter To Statistics. Calculates statistics using the current display filter.
Enter In A Comment For This New Frame. Specifies the comment text to attach to the frame.
To print captured frames, choose Print from the File menu in the Frame Viewer window. Select the desired output options on the Netmon tab in the Print dialog box. The Output Detail area enables you to specify the amount of detail to print for each of the frames. You can also set filters and add page breaks to the output.
Network Monitor uses a capture filter to determine what frames to capture, and it ignores frames that do not match the filter. This can reduce the amount of captured data and make it easier to locate relevant frames.
To design a capture filter, stop any captures, choose Filter from the Capture menu of the Capture window, and then use the Capture Filter dialog box shown in Figure 35-17 to design the capture filter, as described in this section.

Filter protocols capture frames sent using a specific protocol. To design filter protocols, double-click the default line SAP/ETYPE = Any SAP Or Any ETYPE in the decision tree of the Capture Filter dialog box shown in Figure 35-17. In the Capture Filter SAPs And ETYPEs dialog box (shown in Figure 35-18), select the protocols to omit from the capture and then click Disable. The default is to enable all the protocols.

Address pairs capture or exclude traffic between the computer running Network Monitor and up to three other computers.
To designate address pairs, double-click the AND (Address Pairs) line in the decision tree shown in Figure 35-17, and then specify address pair properties in the Address Expression dialog box shown in Figure 35-19 and described in the following list:

Choose Include or Exclude to include or exclude data that travels between the members of the address pair.
Choose the first address from the Station 1 list and the second address from the Station 2 list.
Choose one of the three arrows from the Direction list to indicate the direction of the traffic to filter between the two addresses:
<—> This arrow specifies frames that travel in either direction between the Station 1 and Station 2 computers. This arrow is the default.
—> This arrow specifies frames that travel from Station 1 to Station 2.
<— This arrow specifies frames that travel from Station 2 to Station 1.
Optionally, modify the existing address database by clicking Edit Addresses and then adding, editing, or deleting information.
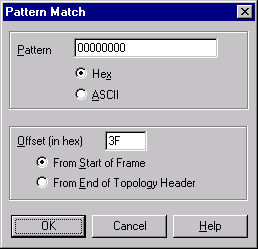
To capture frames that consist of a specific pattern at a specified offset, create pattern matches. You can create up to four pattern matches by double-clicking the AND (Pattern Matches) line in the decision tree, and then using the Pattern Match dialog box.
Type the hexadecimal or ASCII data pattern present in the frames to capture. Then, in the Offset box, type the hexadecimal number that specifies the byte where the pattern begins. Network Monitor interprets the offset number depending on whether you specify the From Start Of Frame option or the From End Of Topology Header option.
To find a pattern to use in a pattern match filter, use the following steps:
Perform a capture, and open the capture in the Frame Viewer.
Double-click a frame to display the Details And Hex pane.
Select a portion of the frame in the Detail pane to obtain its pattern and offset. For example, select the
SMB: NT status code = 0x0text, as shown in Figure 35-20.Write down the highlighted text in the left part of the Hex pane (this is the pattern) and the text in parentheses listed in the Off: section of the Status bar. (This is the offset from the beginning of the frame.) For example, Figure 35-20 shows the pattern
00 00 00 00with an offset ofx3F.Remove any spaces from the pattern, type it in the Pattern box, and then select Hex, as shown in Figure 35-21.
Remove the leading "x" from the offset, type it in the Offset box and then select From Start Of Frame.

Note
The topology header is the section of the frame that the sender adds to identify the network type. Information such as the source and destination address of the frame is included in the topology header. For example, the sender adds 14 bytes to the frame at the Ethernet layer for an Ethernet network.
By default, Network Monitor displays all captured frames in the Frame Viewer, which can make it difficult to locate specific frames. To make it easier to locate frames of interest, create a display filter that tells Network Monitor to display only the frames that are of interest to you.
To create a display filter, perform a capture, choose Filter from the Capture menu of the Capture window, and then use the Capture Filter dialog box shown in Figure 35-22 to design the capture filter, as described in this section.

There are two default branches on the decision tree, each with a single expression: the Protocol branch, which lists the protocols to display, and the Address Pairs branch, which lists the computer address pairs to display.
To add operators, use the AND, OR, and NOT buttons; to change an existing operator, select it and then click Change Operator. To create a new expression or edit an existing expression, click Expression or select an existing expression and then click Edit Expression. Use the Expression dialog box that appears to create or edit an expression.
The Expression dialog box contains three tabs, as discussed below and shown in Figure 35-23.
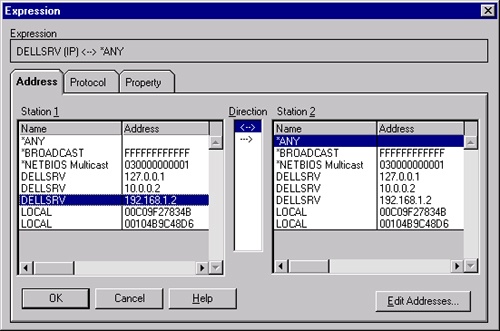
Address tab. Specifies address pairs to display. Refer to Specifying Address Pairs earlier in this chapter for information about how to design address pairs.
Protocol tab. Specifies protocols to display in the Frame Viewer. Choose protocols by selecting protocols and then clicking the Disable, Enable, Disable All, or Enable All buttons. Network Monitor enables all protocols by default.
Property tab. Specifies protocol properties to find. Follow these steps to design protocol properties:
Choose the properties from the Protocol:Property list. If a plus sign appears next to a protocol name, you can expand the protocol to choose a property from its list.
Choose a relational operator from the Relation list. Use a relational operator to specify the connection between the protocol property and its possible values.
Type the value to use as a comparison to the selected property in the Value (Address) box.
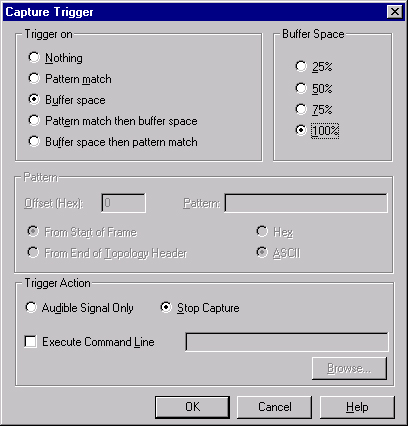
Use a capture trigger to set conditions that initiate an action such as stopping data capture and executing a program or command. To set a capture trigger, follow these steps:
Choose Trigger from the Capture menu of the Capture window. The Capture Trigger dialog box appears, as shown in Figure 35-24.
Choose from the options in the Trigger On area:
Pattern Match. Performs the trigger action when the specified hexadecimal or ASCII pattern match occurs.
Buffer Space. Performs the trigger action when the capture fills the specified percentage of the capture buffer.
Pattern Match Then Buffer Space. Monitors the capture for the specified data pattern, and then performs the trigger action when the capture fills the specified percentage of the capture buffer.
Buffer Space Then Pattern Match. Monitors the capture buffer until the capture fills the specified percentage of the capture buffer, after which point Network Monitor monitors for the specified pattern. When the pattern match occurs, Network Monitor performs the trigger action.
In the Trigger Action area, choose the action to perform when the trigger criteria are met:
Audible Signal Only. Beeps and continues to capture frames. This is the default option.
Stop Capture. Ends the capture process.
Execute Command Line. Executes a command line or opens a file. The command can be up to 259 characters.
Windows Server 2003 is configured optimally for most workloads by default. If the default behavior is not appropriate for your environment, you can improve performance by choosing the appropriate file system cache settings, optimizing the page file, and tuning network performance, as described in this section.
Windows Server 2003 favors the file system cache over running programs and processes by default, which is appropriate for file servers. However, the default settings can reduce the performance of database servers or other network applications. To change the way Windows Server 2003 allocates memory, use the following steps:
Click Start, choose Control Panel and then Network Connections, and then right-click the internal network connection and choose Properties.
Select File And Printer Sharing For Microsoft Networks and then click Properties.
Select the memory optimization method for the server to use and then click OK, as described here and shown in Figure 35-25:
Minimize Memory Used. This setting uses the least amount of RAM for caching. Use it only when the server has a small amount of RAM.
Balance. Balances the available RAM between the system cache and applications, and is inappropriate for servers with an adequate amount of RAM.
Maximize Data Throughput For File Sharing. This is the default setting and is appropriate for most servers, especially those that act as file or print servers or have a large amount of memory. Also use this setting if the server is running a network application and memory is not a bottleneck, and the application does not have its own memory manager. The Maximize Data Throughput For File Sharing setting allocates the largest amount of RAM for the system cache (up to 960 MB), maximizing file-sharing performance but reducing the amount of available RAM for other programs.
Maximize Data Throughput For Network Applications. Allocates a smaller amount of RAM for the system cache (up to 512 MB), making as much RAM available for server-based applications as possible while still ensuring good performance for clients. Use this setting for servers that run network applications that include their own memory managers, such as Microsoft SQL Server or Microsoft Exchange Server, and for servers that run network applications that require large amounts of free memory such as Internet Information Services (IIS).

There are a number of ways to optimize the Windows page file, and even more opinions about the best way to do so. Use the Advanced tab of the System tool in Control Panel and the following guidelines to optimize the Windows page file without a lot of debate:
Remove any current page files on the partition, and defragment the partition before creating the page file to ensure that Windows allocates the page a contiguous area on the hard drive.
Create a page file on the system (most likely C:) partition with the initial size and maximum size set to slightly larger than the size of the crash dump file. To change the type of crash dump file the system creates in the event of a Stop Error (blue screen), click Settings in the Startup And Recovery section of the Advanced tab in the System Properties dialog box.
In addition to the page file on the system partition, create a page file on a dedicated disk, RAID-0, RAID 0+1, or RAID-1 array. If this is impractical, allocate space for the page file on the fastest drive or drives in the system. Placing it on multiple physical drives improves performance, unless the drives are slow or heavily used (avoid these). Placing page files on multiple partitions on the same drive does not improve performance.
Avoid RAID-5 volumes when possible because the data redundancy can reduce performance. Choose a simple volume, stripe set, mirror, or RAID 0+1 volume (a mirrored stripe set) for the page file.
If you must place the page file on the same physical disk as the operating system, place it on the same partition as the operating system to minimize disk seek time and maximize disk performance.
Use the Committed Bytes counter in Performance Monitor to determine how much virtual memory Windows consumes under the heaviest usage conditions. Set the initial size of the page file to a value significantly larger than the peak usage to allow for future growth or unusual conditions. This reduces page file fragmentation by reserving a block on the hard drive for the page file and eliminating the need to dynamically increase the file size.
Set the maximum size to the maximum size you can imagine ever needing. This provides Windows the ability to increase the size of the page file in an emergency rather than deny memory requests.
To optimize network performance, use the following list:
Unbind infrequently used protocols.
Set the order in which the workstation and NetBIOS software bind to each protocol when using more than one protocol. Average connection time decreases when you list the most frequently used protocol first.
Ensure that users and resources are located on the same subnet when possible.
Install multiple network adapters to increase file-sharing throughput.
Upgrade network adapters on heavily loaded servers to high-performance adapters designed for server loads.
Windows Server 2003 is equipped with tools for monitoring servers and the network, finding problems, and fine-tuning performance. Although some of the processes might appear daunting, you can approach performance monitoring gradually and increase monitoring as you become comfortable with the tools and methods. The next chapter discusses how to prepare and implement a plan for recovering from the inevitable failure of hardware.