
While writing our JScript code, it is highly unlikely that we will always get it right. We could, of course, start throwing alerts and any other type of notifications. The disadvantage to that is the fact that, once we fix the problem, we have to spend the time to go back and clean up the code.
In this recipe we'll be looking at alternative ways to trace our small mistakes.
For the purpose of this recipe, we will not be writing any new code. We'll be using the solution created in the Handling unexpected processing recipe in Chapter 5, Error Handling, and we will be tracing through the execution of those scripts using Internet Explorer and the Developer Tools.
First off, in order to use the Developer Tools in Internet Explorer, we need to make sure that script debugging is enabled. As mentioned at the end of the previous recipe, in Internet Options, on the Advanced tab, make sure that Disable script debugging (Internet Explorer) and Disable script debugging (Other) are not checked.
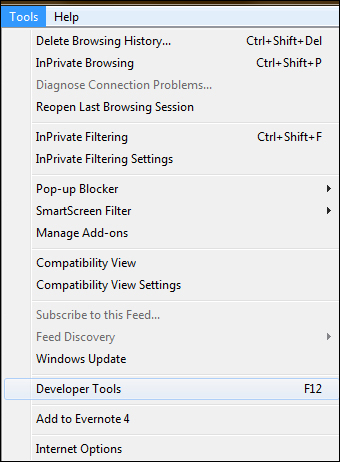
To open the Developer Toolbar, hit the F12 key or go to Tools | Developer Tools on the page you want to debug.
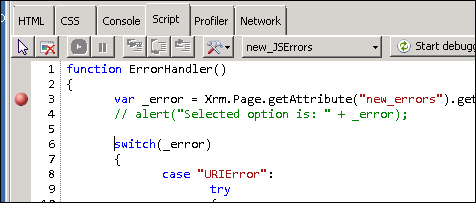
For script debugging, go to the Script tab. Select the new_JSErrors script from the scripts dropdown. Click on the Start debugging button and place a breakpoint at the line you want to start your debugging from. Now that you have your debug point set, execute a form action that will kick off the script you are debugging. For example, if you have an action that is performed as a result of changing a lookup value, put your breakpoint at the beginning of that script, and then change the lookup value to kick off your script.
Once your script execution reached the breakpoint, you can start debugging from there in the same way you would debug any application on Visual Studio.
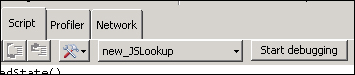
Another way to set breakpoints on specific scripts is by selecting the dropdown to the left-hand side of the Start debugging button, and selecting a specific script source.
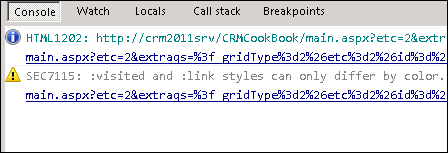
Another aspect of debugging using the Developer Tools in Internet Explorer involves the Console. Here you can watch for error messages. If the page generates an error message, in the Console window you will see the message. Clicking on the message link will put the focus in the script window on the line that generates the error.
The other tabs present additional functionality.
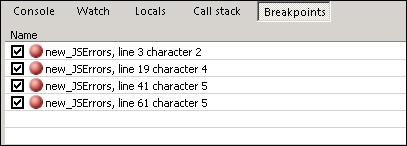
The Breakpoints tab includes a listing of all the breakpoints you have set up in your scripts.
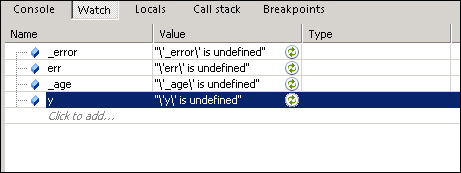
The Watch window allows you to define specific variables used during your script, and to see the allocated value at a certain point during execution. When using the Watch window, you can add the watched variables one by one, manually.
As you work and become more familiar with using this tool, you will see the added value and the speed benefits when debugging this way rather than using simple alerts.
The Developer Tools in Internet Explorer, while not specific for Dynamics CRM, adds additional value to your toolbox. This tool is intended to be used in debugging any web application. We have only looked at the script portion of this tool, but it can add more value using the full range of options. You can easily debug all kinds of web resources you add to the pages, all scripts, and it provides additional help when investigating performance issues.
- For additional details on getting started and using the Developer Tools in Internet Explorer, see the MSDN documentation at http://msdn.microsoft.com/en-us/library/ie/gg589500(v=vs.85).aspx.