
Chapter 3
Design of Hydrodynamically Confined Microflow Devices with Numerical Modeling: Controlling Flow Envelope, Pressure, and Shear Stress
Choongbae Park1, Kevin V. Christ2 and Kevin T. Turner2
1Texas A&M University-Kingsville, Department of Mechanical and Industrial Engineering, 700 University Blvd., MSC 191, Kingsville, TX, 78363, USA
2University of Pennsylvania, Department of Mechanical Engineering and Applied Mechanics, 220 South 33rd Street, 229 Towne Building, Philadelphia, PA, 19104-6315, USA
3.1 Introduction
Microfluidic probes (MFPs) are devices that are engineered to deliver minute volumes (e.g., nano- or picoliters) of liquid in controlled flows in a specific region within larger liquid environments. MFPs have a number of applications in the fields of biology, chemistry, and medicine. The first MFP, which was reported by Juncker et al. in 2005 [1], was used to produce teardrop-shaped hydrodynamically confined microflows (HCMs). MFPs produce HCMs in the gap between a substrate and the MFP (Figure 3.1), and the properties of the HCM are controlled via the flow rate of the processing solution injected through an inlet port and the aspiration flow rate through the outlet port. The fluid that is aspirated through the outlet is a combination of the surrounding medium and processing solution. Since the initial report in 2005, MFPs with various geometries and composed of different materials (e.g., silicon, polydimethylsiloxane (PDMS)) have been used for a wide range of applications, including protein micropatterning and removal, selective labeling, detachment of cells, complex gradient formation, and cell adhesion strength measurement. A recent review by Ainla et al. [3] and the other chapters in this book provide an overview of the many types of devices and applications of MFPs. Recent work has focused on localized surface processing [4], integration of MFP systems [5], and multifunctional devices [6]. While cannulae [7], microdialysis membranes [8], and glass pipettes [9, 10] can also be used to process and deliver small volumes of liquids, they do not allow for the generation of HCMs and thus do not afford the same level of control over fluid flow as the MFP [3, 11].
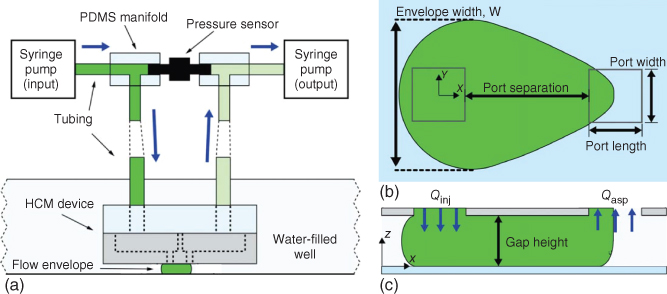
Figure 3.1 Schematic of an MFP and an HCM. (a) An MFP device is immersed in a liquid-filled well, and a solution (dark grey) is injected through the left tube, while the solution and surrounding medium (lighter grey) are aspirated through the right tube. The HCM (dark green) and the two square ports are shown in (b) top and (c) front views. The injection flow rate is the inlet flow rate, Qinj = Qi, and the aspiration flow rate is the outlet flow rate, Qasp = Qo. The critical dimensions are labeled: envelope width (W), port width and length (Wport and Lport), port separation (S), and gap height (h).
(Christ and Turner (2011) [2]. Copyright 2011. Reproduced with permission of Royal Society of Chemistry.)
PDMS-based and silicon-based MFP devices with different geometries and port configurations, including planar, vertical, and variable-angled HCM devices, have been fabricated, characterized, and used [3]. To design MFP devices to produce controlled HCMs, fluid mechanics analysis is required. There has been work to develop analytical-based models [12] of two-port MFPs described in previous experimental work [1, 4, 5]. Numerical simulation, notably computational fluid dynamics (CFD) modeling, complements the previous experimental and analytical studies of MFPs and can be used to aid in the design of MFPs with a wide range of configurations. Numerical modeling can be used to predict the shape of the flow in two-port and multi-port devices, predict the pressure drop between the inlet and outlet ports, and provide detailed information on the velocity fields within the HCMs. This chapter will describe the use of numerical modeling for the design of MFP devices and show how numerical modeling can be used to make quantitative predictions of the size and shape of the flow envelope, pressure drop, and shear stress on the surface below an HCM. The modeling predictions are validated via experiments.
3.2 Theory
Fluid mechanics is the foundation for understanding flows in HCMs. In this section, several well-established fluid mechanics concepts and some specific cases are briefly reviewed as a basis for understanding the CFD predictions of HCMs later in this chapter.
3.2.1 Pressure, Velocity Distribution, and Nondimensional Quantities
Fluid flow, in general, is driven by either a pressure difference, gravity, or externally applied forces. The starting point for making predictions of fluid velocity, u, is the incompressible Navier–Stokes equation [13]
where ρ is the fluid density, t is the time, μ is the dynamic viscosity, g is the gravitational acceleration, p is the pressure, and f represents external forces. In CFD analysis, the Navier–Stokes equation is solved numerically. In most cases for HCMs, the gravitational and external forces as well as the inertial terms in Eq. (3.1) can be neglected. For a simple closed channel, as is typical in microfluidic devices, it is straightforward to solve Eq. (3.1) to determine the fluid velocity and flow rate as a function of the pressure drop, fluid viscosity, and channel dimensions [14]. However, in an HCM system, the fluid flows between the inlet and outlet ports in the gap between the substrate and the HCM device (Figure 3.1) and is not constrained laterally by fixed walls. Rather, the size of the flow envelope is determined by gap height, fluid properties, and the flow rates at the inlet and outlet ports (or the pressure difference between the two ports). Thus, simple analytical equations developed for flow in closed channels are not directly applicable to HCMs.
A simple case, which can be solved analytically and provides some insight into the nature of flows beneath an MFP, is that of radial flow in a gap from a central port. This would be equivalent to an MFP device with only one port (an inlet) that does not produce a confined flow. If fluid is injected through a single port with flow rate Q into a narrow gap of height h, the Navier–Stokes equation, with the simplifying assumptions noted above, predicts a pressure gradient of [2]
where r is radial coordinate. With no-slip boundary conditions at the top and bottom of the gap, the velocity distribution is determined to be

where ur is the radial velocity and z is the coordinate normal to the bottom surface ![]() . This expression is valid when there is no significant z-component to the velocity field, which occurs away from the inlet port at
. This expression is valid when there is no significant z-component to the velocity field, which occurs away from the inlet port at ![]() . Note from Eq. (3.3) that the velocity across the height of the gap has a parabolic distribution – this same distribution will be present in HCMs if the inlet and outlet ports are spaced sufficiently apart.
. Note from Eq. (3.3) that the velocity across the height of the gap has a parabolic distribution – this same distribution will be present in HCMs if the inlet and outlet ports are spaced sufficiently apart.
In most MFP devices reported to date, the gap, h, is less than 100 µm. This small dimension generally leads to low Reynolds numbers, the nondimensional ratio of viscous to inertial forces, which means that HCMs are laminar [1, 2]. The low Reynolds number enables a high level of control over HCMs. Another well-known nondimensional quantity, the Péclet number, which is the ratio of advective to diffusive transport, is also important in the performance of MFP devices. The Péclet number can be used to determine whether the shape and degree of confinement of the HCM will be determined by the flow properties, diffusion, or a combination of the two [1, 2]. A large Péclet number indicates that very little diffusive transport will take place at the boundaries of the HCM, and thus the dominant advective transport controls the shape and size of the HCM.
3.2.2 Shear Stress
MFP devices often produce flows that are intended to interact with a surface or objects, such as cells, on a surface. Thus, understanding the shear stress applied by the flow on the surface is often important in MFP design. In a closed channel of height h, when the flow is laminar, the shear stress on the surface can be expressed as [15]
where w is the width of the channel and Cfw is a constant that accounts for the finite width of the channel. This expression provides insight into the role of flow rate, channel height, and viscosity on the shear stress produced, but cannot be directly applied to HCMs as it is derived for a channel with fixed side walls. MFPs have been used to selectively detach cells in an open liquid environment [1]; however the shear stress distribution in a simple two-port MFP device is quite nonuniform. More complex port geometries can be used to achieve uniform shear stress distributions in HCMs [16], but design of such devices is nontrivial. Details of the use of CFD analysis to design MFP device geometries to produce a uniform shear stress will be discussed in this chapter.
3.3 Device and Experimental Methods for CFD Validation
The CFD results in this chapter will be compared with experimental measurements made on two-port MFP devices made of silicon [2]. The first set of MFP devices used in this study had two ports, one inlet for injecting fluid and a second outlet for aspirating the fluids. The devices were 15 mm long, 10 mm wide, and 380 µm thick. Eleven different HCM devices were fabricated as summarized in Table 3.1.
Table 3.1 Dimensions of ten HCM devices
| Device | Nominal port size/µm | Nominal port seperationa /µm | |
| Length | Width | ||
| D1 | 125 | 125 | 180 |
| D2 | 120 | 220 | 180 |
| D3 | 120 | 420 | 180 |
| D4 | 120 | 620 | 180 |
| D5 | 120 | 220 | 380 |
| D6 | 120 | 420 | 380 |
| D7 | 120 | 620 | 380 |
| D8 | 120 | 220 | 580 |
| D9 | 120 | 420 | 580 |
| D10 | 120 | 620 | 580 |
a Port separation is the distance from inner edge to inner edge.
Source: Christ and Turner (2011) [2]. Copyright 2011. Reproduced with permission of Royal Society of Chemistry.
The shape of the HCM and pressure drop between the inlet and outlet ports were measured for this first set of devices. To visualize the flow envelope generated by the MFPs, a mixture of fluorescein and deionized (DI) water at a concentration of 0.1 mg/mL was flowed through the device. Once the flow was hydrodynamically confined, fluorescent images were captured through an inverted microscope with a digital camera, while pressure drops through the MFP device were recorded via a pressure sensor (![]() psi differential pressure sensor) that was connected between the HCM device and the syringe pumps, as shown in Figure 3.2 [2].
psi differential pressure sensor) that was connected between the HCM device and the syringe pumps, as shown in Figure 3.2 [2].

Figure 3.2 Photographs of the experimental setup. (a) The HCM device is positioned by a three-axis stage, which is mounted on a tip/tilt stage resting on a microscope stage. (b) An aluminum clamp mounted to the three-axis stage holds the HCM device. (c) A differential pressure sensor is connected between tubings for injecting and aspirating fluids.
(Christ and Turner (2011) [2]. Copyright 2011. Reproduced with permission of Royal Society of Chemistry.)
The experimental system in Figure 3.2 yields a pressure measurement of [2]
where R is the flow resistance and the subscripts i, g, and o represent the inlet channel, gap, and outlet channel, respectively. The decreases in pressure through the inlet and outlet channels are relatively small, but nonnegligible, compared with that through the gap between the MFP and substrate. Using this experimental system and devices with different geometries, the shape/size of the flow envelopes and the pressure drop were systematically characterized. Figure 3.1b shows the key dimensions that define the device geometry, and Table 3.1 shows the various port separations and the port sizes investigated. The flow envelopes and pressure drops measured in these experiments are directly compared with CFD predictions.
The second type of MFP reported in the validation studies in this chapter is a two-port silicon device with one non-rectangular port and one rectangular port, as shown in Figure 3.3a [16]. The distinguishing feature of this MFP is the shape of the outlet port, which is a “bracket” shape. This device was designed to generate uniform hydrodynamic loads (i.e., shear stresses) on a biological sample. A surface traction experiment was used to characterize this device. Specifically, an HCM was created above a soft polyacrylamide (PA) gel studded with fluorescent particles (Figure 3.3b). The displacement of the particles due to the HCM was measured via microscopy and correlated to the hydrodynamic loads generated on the surface by the HCM.

Figure 3.3 (a) A two-port MFP with a bracket-shaped outlet port that is designed to generate uniform shear stresses. (b) Fluorescent particles (circles) are adhered to the surface of a polyacrylamide (PA) gel. These particles are displaced by the pressure and shear stress generated due to the HCM.
(Reproduced with permission from [16], Copyright © 2011.)
3.4 Numerical Modeling of HCM devices
Commercially available finite element packages, such as COMSOL Multiphysics [5, 6, 11, 12, 17, 18], and CFD software, such as ANSYS CFX [2, 16], can be used to predict the characteristics of HCMs generated with MFP devices. Here, we primarily discuss the use of CFD modeling of HCMs using ANSYS CFX, but we also include one example of COMSOL simulations in which both fluid and solid deformations were included. Because of the geometries of the devices and HCMs, all models were full 3D simulations. In all simulations reported here, the fluid was assumed to have the properties of water at 25 °C: density ![]() and dynamic viscosity
and dynamic viscosity ![]() .
.
CFD modeling in ANSYS CFX was used to analyze the HCM generated by the first set of MFP devices of the type shown in Figure 3.1 and Table 3.1. As a first step to validate the CFD model, a single-port HCM device was first modeled and compared to analytical results given by Eqs. (3.2) and (3.3). The model included a ![]() port in the center of a rigid surface (5 mm2) that represents the bottom of the device and is positioned 50 µm above a rigid surface that represents the substrate. The simulations were in excellent agreement with analytical results, except in the region near the port (within 200 µm from the port center) when pressure gradients, average radial velocities, and radial velocity profiles from the CFD were compared with Eqs. (3.2) and (3.3).
port in the center of a rigid surface (5 mm2) that represents the bottom of the device and is positioned 50 µm above a rigid surface that represents the substrate. The simulations were in excellent agreement with analytical results, except in the region near the port (within 200 µm from the port center) when pressure gradients, average radial velocities, and radial velocity profiles from the CFD were compared with Eqs. (3.2) and (3.3).
The first step in CFD analysis of HCMs is defining the model geometry and mesh. The two-port HCM devices are symmetric about a line connecting the centers of the two ports. Therefore, only half of the system is modeled in the CFD analysis. To model the devices in Table 3.1, the device bottom surface and the substrate surface beneath the device were modeled as rigid rectangular planes that were 15 mm long and 5 mm wide. Two ports with the size and separation listed in Table 3.1 were included in the top surface. Channel extensions above the ports were also included in the model and were approximately 165 µm long from the surface of the device. Approximately 1.25 million quadrilateral elements with 10 elements spanning the gap height were used to mesh the model. The second step in CFD analysis is defining the boundary conditions and loading. In the model, there are four vertical boundaries that define the edge of the gap. One of these was set as a symmetry plane, while the other three boundaries were set as openings in which no relative pressure was applied and normal flow through the boundary was permitted. The inlet and outlet flow rates were prescribed at the top of the port extensions. The model was solved and data was analyzed as follows. The pressure drop across the gap was calculated as the difference between the averaged pressures at the two ports. To visualize the flow envelope from the simulations, 1000 virtual particles (2 µm dia.) were evenly injected from the inlet port in the simulations. The particles were assumed to faithfully follow the flow and to not interfere with the underlying flow in the HCM system.
The second set of MFP devices, those designed for applying uniform shear, were simulated using both ANSYS CFX and COMSOL Multiphysics (K. V. Christ, C. Park, K. T. Turner, in preparation). Specifically, ANSYS CFX was used for optimization of the bracket-shaped port device to determine a device geometry that produces uniform shear, and COMSOL Multiphysics was used to compare the simulation results with the experimental results in which there are both fluid flow and deformation of a soft substrate beneath the device (Figure 3.3). Overall, the CFX simulations of the bracket-shaped device followed a similar procedure to that described in the previous paragraph. One notable difference was that the bracket-shaped port device had a mesa on the bottom side of the device, and this was included in the model [16].
The aim of the CFD simulations of the device with a bracket-shaped port was to identify the best device geometry to produce a uniform shear stress over a ![]() square region – an area large enough to cover typical spread cells. In addition to the size of flow envelope and pressure distribution (P) beneath the device, two stress parameters – shear stress magnitude (SM) and shear stress direction (SD) – were obtained from the simulation results. These values were calculated within
square region – an area large enough to cover typical spread cells. In addition to the size of flow envelope and pressure distribution (P) beneath the device, two stress parameters – shear stress magnitude (SM) and shear stress direction (SD) – were obtained from the simulation results. These values were calculated within ![]() regions beneath the device and three statistical quantities for P, SM, and SD over the region were calculated: mean “AVG”, standard deviation “SD”, and coefficient of variation “CV”, which is the standard deviation divided by the mean. For each device, nine statistical quantities (PAVG, PSD, PCV, SM,AVG, SM,SD, SM,CV, SD,AVG, SD,SD, and SD,CV) were calculated, and several sampling regions were considered in order to find an optimal device design. The coefficient of variation
regions beneath the device and three statistical quantities for P, SM, and SD over the region were calculated: mean “AVG”, standard deviation “SD”, and coefficient of variation “CV”, which is the standard deviation divided by the mean. For each device, nine statistical quantities (PAVG, PSD, PCV, SM,AVG, SM,SD, SM,CV, SD,AVG, SD,SD, and SD,CV) were calculated, and several sampling regions were considered in order to find an optimal device design. The coefficient of variation ![]() is a quantitative measure of uniformity of three variables (P, SM, and SD). The localization of the shear stress beneath the HCM device was also quantified by examining the magnitude of shear stress beneath the device and considering a cutoff value of the shear stress that the device generates outside of the mesa. The required stress cutoff value was inferred from previous adhesion strength tests done on fibroblasts inside a rectangular microchannel [15]. The minimum adhesion of fibroblasts was 20 Pa, and thus 10% of this value (i.e., 2 Pa) was chosen as a cutoff shear stress. A shear stress confinement length, LSC, was defined as the maximum distance from the device center to the location where the shear stress drops to 2 Pa. This length was used to quantify how well the devices localize the hydrodynamic loading.
is a quantitative measure of uniformity of three variables (P, SM, and SD). The localization of the shear stress beneath the HCM device was also quantified by examining the magnitude of shear stress beneath the device and considering a cutoff value of the shear stress that the device generates outside of the mesa. The required stress cutoff value was inferred from previous adhesion strength tests done on fibroblasts inside a rectangular microchannel [15]. The minimum adhesion of fibroblasts was 20 Pa, and thus 10% of this value (i.e., 2 Pa) was chosen as a cutoff shear stress. A shear stress confinement length, LSC, was defined as the maximum distance from the device center to the location where the shear stress drops to 2 Pa. This length was used to quantify how well the devices localize the hydrodynamic loading.
Four HCM devices with different port configurations were examined by varying the bracket length or extension. The following parameters were used in each simulation: (i) inlet flow rate (Qi), (ii) outlet flow rate (Qo), (iii) gap height (h), (iv) port separation (S), (v) size of rectangular and bracket ports, and (vi) mesa size. The dimensions of the two ports can be described as port length (Lport), port width (Wport), port separation (S), bracket extension (Lbracket), and bracket width (Wbracket). The bracket extension of 0 µm represents a rectangular port, like the inlet port. While the port width (Wport) and bracket width (Wbracket) are kept constant, four different HCM devices were first modeled from the combination of port length (Lport) and port separation (S) (![]() ,
, ![]() ,
, ![]() ,
, ![]() ), and then the bracket width was varied from 0 µm to 100, 150, 200, 250, 300, and 350 µm. Therefore, at least 28 different tests with 4 HCM devices were performed to find the optimum device having uniform shear stress magnitude.
), and then the bracket width was varied from 0 µm to 100, 150, 200, 250, 300, and 350 µm. Therefore, at least 28 different tests with 4 HCM devices were performed to find the optimum device having uniform shear stress magnitude.
Simulations of flow beneath a bracket-shaped port device above a deformable gel were investigated in COMSOL Multiphysics (Figure 3.4). In this model, flow in the gap between the device and the gel, gel layer, and two channels for the injection and aspiration of fluids were included in the model. The inlet and outlet channel extensions were 500 µm, and the gap height was 40 µm. These values were obtained from the measurements of the device/experiment. The mesa size was ![]() with a height of 239 µm. The port separation was 398 µm. The dimensions of the PA gel were 8 mm by 8 mm and 480 µm thick. Five combinations of outlet-to-inlet flow rate ratio (Qo (mL/h)/Qi (mL/h)) were simulated, 60/20, 128/32, 120/40, 106/53, and 180/60, and the corresponding flow rate ratios were 3, 4, 3, 2, and 3, respectively.
with a height of 239 µm. The port separation was 398 µm. The dimensions of the PA gel were 8 mm by 8 mm and 480 µm thick. Five combinations of outlet-to-inlet flow rate ratio (Qo (mL/h)/Qi (mL/h)) were simulated, 60/20, 128/32, 120/40, 106/53, and 180/60, and the corresponding flow rate ratios were 3, 4, 3, 2, and 3, respectively.
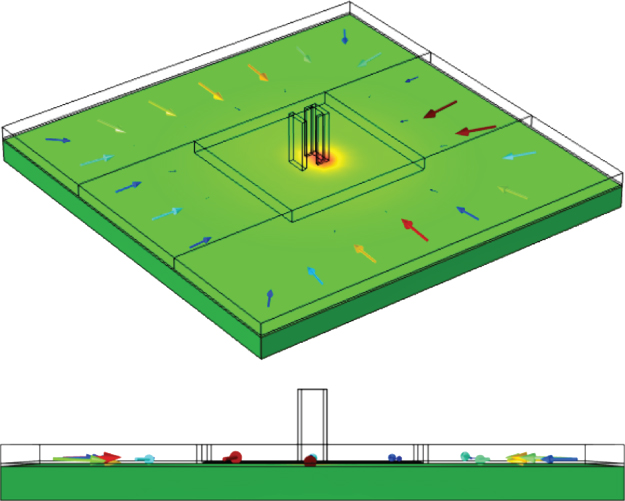
Figure 3.4 3D COMSOL Multiphysics model of a bracket-shaped port MFP device above a PA gel. The darker gray represents the PA gel and arrows represent velocity vectors in the gap.
3.5 Envelope Size and Pressure Drop Across HCMs
The size and shape of the flow envelope is a key characteristic of MFP devices. Figure 3.5 shows experimental and CFD results for four devices with different port sizes (![]() ,
, ![]() ,
, ![]() ,
, ![]() ). The left port is the inlet and the right port is the outlet. The CFD predictions match the experimental results well in terms of the size and shape of the flow envelope. This good agreement suggests the aforementioned geometry, and boundary conditions in the CFD model are appropriate for modeling HCMs. As the port width increases, the envelope changes from a teardrop shape to a nearly trapezoidal shape.
). The left port is the inlet and the right port is the outlet. The CFD predictions match the experimental results well in terms of the size and shape of the flow envelope. This good agreement suggests the aforementioned geometry, and boundary conditions in the CFD model are appropriate for modeling HCMs. As the port width increases, the envelope changes from a teardrop shape to a nearly trapezoidal shape.
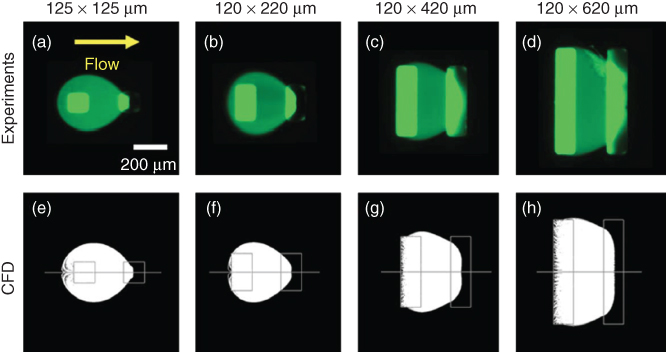
Figure 3.5 Flow envelopes from (a–d) experimental and (e–h) CFD simulation results. Four different port sizes were examined. During operation, the port separation  , inlet flow rate
  , outlet flow rate
  , and gap height
  were kept constant.
(Christ and Turner (2011) [2]. Copyright 2011. Reproduced with permission of Royal Society of Chemistry.)
The CFD models were also used to examine the effect of Wport, h, Qo/Qi, and Qo on the flow envelope. General trends that were observed in the simulations, and verified with experiments, are as follows [2]:
- The flow envelope width is linearly proportional to the port width when the port separation is much smaller than the port width.
- The flow envelope width does not change, even with large change in the port width, when the port separation is larger than the port width.
- As the port separation increases, the port width does not significantly affect the envelope width.
- The flow envelope width is inversely proportional to the flow rate ratio for a fixed inlet flow rate.
Christ and Turner [2] measured the pressure drop between the inlet and outlet of an MFP device. As described above, measurements of the change in pressure were performed using a differential pressure sensor and were also predicted with CFD modeling. The pressure measurements allow for direct quantitative comparison between the CFD and experiments. The effects of port width (Wport), port separation (S), output flow rate (Qo), and flow rate ratio (Qo/Qi) on the pressure drop across an HCM were investigated using CFD and experiments. Figure 3.6 shows how pressure drop varies with port width, port separation, gap height, flow rate ratio, and output flow rate. Figure 3.6a,b shows that the pressure drop increases as the port width is decreased or the port separation is increased, while other parameters are held constant (![]() ,
, ![]() ,
, ![]() ). The pressure increases as the port width is made smaller because the resistances of the inlet and outlet channels (Ri and Ro) increase (Figure 3.6a). On the other hand, the pressure increases in Figure 3.6b because the resistance in the gap, Rg, increases when the port separation becomes larger.
). The pressure increases as the port width is made smaller because the resistances of the inlet and outlet channels (Ri and Ro) increase (Figure 3.6a). On the other hand, the pressure increases in Figure 3.6b because the resistance in the gap, Rg, increases when the port separation becomes larger.
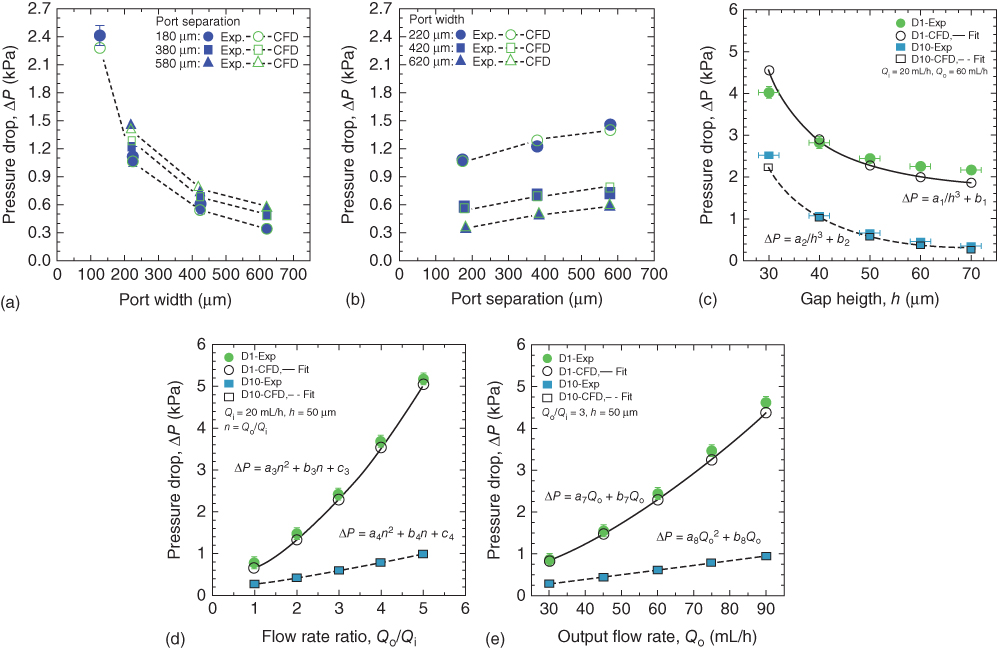
Figure 3.6 Experimental and simulation results of the pressure drops as a function of (a) port width (Wport), (b) port separation (S), (c) gap height (h), (d) flow rate ratio (Qo/Qi), and (e) outlet flow rate (Qo). All HCM devices used here were two-port devices. Ten devices (D1–D10) were used for pressure drop in (a,b), while two devices (D1 and D10) were used for (c–e). The dimensions of the devices are listed in Table 3.1.
(Christ and Turner (2011) [2]. Copyright 2011. Reproduced with permission of Royal Society of Chemistry.)
The gap height has a strong effect on pressure, and the pressure increases as gap height is decreased (Figure 3.6c). The change in pressure drop with gap height is well described by an expression of the form
where ai and bi are fit parameters. The scaling of pressure drop with 1/h3 is consistent with Eq. (3.2). Figure 3.6d, e shows the effect of the flow rate ratio (Qo/Qi) at a fixed ![]() and the effect of the outlet flow rate (Qo) at a fixed
and the effect of the outlet flow rate (Qo) at a fixed ![]() on the pressure drop. The results in the plot can be described as
on the pressure drop. The results in the plot can be described as
and
where ai, bi, and ci are constants determined by fitting to the simulation results. Here, ![]() . Both equations are quadratic, so the flow rate ratio and outlet flow rate may affect the resistance terms (Ri, Rg, Ro) and gap flow rate (Qg) in Eq. (3.5).
. Both equations are quadratic, so the flow rate ratio and outlet flow rate may affect the resistance terms (Ri, Rg, Ro) and gap flow rate (Qg) in Eq. (3.5).
The CFD results and experiments discussed in this section demonstrate the ability to tailor the properties of HCMs through device geometry and flow rates. The excellent agreement between the CFD and experimental results in both Figures 3.5 and 3.6 clearly demonstrates the ability of CFD modeling to predict the properties of HCMs. These experimentally validated CFD models can be used to design HCMs with specific characteristics that are required for different applications. In the next section, the use of CFD to design and optimize devices to apply uniform hydrodynamic loads is demonstrated.
3.6 Hydrodynamic Loads Generated by HCM Devices
HCM devices have been used in various applications, such as chemical surface processing and single-cell experiments, which cannot be done in closed devices (e.g., closed microchannels) [1, 3]. An HCM device to produce uniform shear stresses over a specified region was introduced by Christ [16]. The distinguishing feature of this HCM device is the bracket shape of the outlet port, as explained in Section 3.4 (Figure 3.3).
Among the four device geometries investigated (described in Section 3.4), simulation results for one of the devices, along with a picture of one of the devices, are shown in Figure 3.7. The bracket-shaped port device produces a more uniform shear stress magnitude than a device with two simple rectangular ports [16]. The bracket-shaped device leads to a shear stress that acts primarily in the x-direction. The brackets lead to a more uniform shear stress because they prevent “contraction” of the flow at the outlet that occurs if the ports are simple rectangles; for example, note the decrease in width of the flow at the outlet in the results shown in Figure 3.5. There is an optimal length for the bracket extensions for each combination of port length and separation. From CFD simulations, which included four combinations of port length and port separation, the ![]() with 250 µm long port extensions exhibited the best shear stress uniformity [16] as quantified by the statistical quantities noted in Section 3.4. A second quantity that was considered in the design of these devices was the degree of shear stress confinement, quantified as a length (LSC). An ideal MFP would only apply loads directly beneath the flow envelope, but as the device removes fluid from the environment, there will be hydrodynamic loads generated outside of the HCM. The degree of confinement is affected by the flow rates as well as the lateral size and height of the mesa. Based on CFD simulation results, an HCM device with a 3 mm2 mesa and ports with
with 250 µm long port extensions exhibited the best shear stress uniformity [16] as quantified by the statistical quantities noted in Section 3.4. A second quantity that was considered in the design of these devices was the degree of shear stress confinement, quantified as a length (LSC). An ideal MFP would only apply loads directly beneath the flow envelope, but as the device removes fluid from the environment, there will be hydrodynamic loads generated outside of the HCM. The degree of confinement is affected by the flow rates as well as the lateral size and height of the mesa. Based on CFD simulation results, an HCM device with a 3 mm2 mesa and ports with ![]() ,
, ![]() ,
, ![]() ,
, ![]() , and
, and ![]() was fabricated for applying shear stresses to measure cell adhesion strength [16]. The following criteria were used to select the geometry of the device:
was fabricated for applying shear stresses to measure cell adhesion strength [16]. The following criteria were used to select the geometry of the device:
- Small shear stress variation, device has
 (at
(at  ).
). - Small confinement length, device has
 (at
(at  ).
). - Ability to produce shear stresses of 125 Pa is required at reasonable flow rates.

Figure 3.7 (a) Micrograph showing fabricated port geometry on MFP device designed to produce uniform shear stress. (b) CFD prediction of shear stress on the substrate beneath the MFP. Key parameters in the simulations are gap height  , inlet flow rate
  , and flow rate ratio
  .
.
(Christ et al. (2018) in preparation.)
The optimal device identified above was fabricated out of silicon and experimentally evaluated [16]. To assess the hydrodynamic loads, the device was positioned above a soft PA gel, and the displacements of particles on the gel surface in response to the HCM were measured. Specifically, a PA gel was prepared with a sparse 1 µm layer of fluorescent particles on the surface. Young's modulus of the PA gel was measured to be 112 kPa (assuming Poisson's ratio ![]() ). These values defined the properties of the PA gel in simulations, but it should be noted that the properties are highly dependent on the chemical composition, surrounding environment, preparation method, and measurement technique [16].
). These values defined the properties of the PA gel in simulations, but it should be noted that the properties are highly dependent on the chemical composition, surrounding environment, preparation method, and measurement technique [16].
The HCM flow test over the PA substrate was conducted in a liquid environment contained within a PDMS well. In-plane particle displacements were measured from the fluorescent images by comparing their locations before and after an HCM was applied. Images were taken from two different zones, in which out-of-plane particle displacement was expected to be small compared with in-plane displacement.
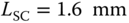
Particle displacements were measured for a range of flow rates at a fixed gap height ![]() . The flow rates and flow rate ratios for the experiments match those in the simulations described in Section 3.4. The outlet-to-inlet flow rates (Qo (mL/h)/Qi (mL/h)) were 60/20, 128/32, 120/40, 106/53, and 180/60. To use the measured displacements to verify the hydrodynamic loads produced by the device, a simulation that incorporates both fluid flow and elastic deformation of the PA gel is required. A coupled fluid-structure simulation is required as the elastic deformation of the gel affects the gap, which in turn affects the fluid flow. The COMSOL Multiphysics model discussed in Section 3.4 was used to predict in-plane displacements for the experimental cases. In the model, an effective gel height of 450 µm was used along with Young's modulus and Poisson's ratio of 112 kPa and 0.499, respectively. Figure 3.8 shows a comparison between the simulated and experimentally measured surface displacements. The correlation between the experiment and simulations in Figure 3.8 is quite good but modestly degrades at higher flow rates. Overall, these experimental and simulation results show good agreement and the ability of Multiphysics models to predict the HCM flow and deformation induced in the substrate.
. The flow rates and flow rate ratios for the experiments match those in the simulations described in Section 3.4. The outlet-to-inlet flow rates (Qo (mL/h)/Qi (mL/h)) were 60/20, 128/32, 120/40, 106/53, and 180/60. To use the measured displacements to verify the hydrodynamic loads produced by the device, a simulation that incorporates both fluid flow and elastic deformation of the PA gel is required. A coupled fluid-structure simulation is required as the elastic deformation of the gel affects the gap, which in turn affects the fluid flow. The COMSOL Multiphysics model discussed in Section 3.4 was used to predict in-plane displacements for the experimental cases. In the model, an effective gel height of 450 µm was used along with Young's modulus and Poisson's ratio of 112 kPa and 0.499, respectively. Figure 3.8 shows a comparison between the simulated and experimentally measured surface displacements. The correlation between the experiment and simulations in Figure 3.8 is quite good but modestly degrades at higher flow rates. Overall, these experimental and simulation results show good agreement and the ability of Multiphysics models to predict the HCM flow and deformation induced in the substrate.
Figure 3.8 Comparison of simulation (COMSOL Multiphysics) and experimental results for HCM device with bracket-shaped ports: (a) in-plane displacement and (b) in-plane angle.
(Christ et al. (2016) in preparation. Copyright 2018.)
3.7 Concluding Remarks
In this chapter, we have presented numerical simulations to predict the size/shape of the flow envelope, pressure, and shear stress in HCMs produced by MFP devices. The simulations were used to examine the role of MFP design, such as port geometry, separation, size, and shape, on the properties of the HCM. The CFD predictions are in good agreement with experimental measurements demonstrating the ability of the simulations to be used for quantitative design. Furthermore, we demonstrated how CFD has been used to design an optimized device to produce uniform shear stresses.
References
- 1 Juncker, D., Schmid, H., and Delamarche, E. (2005) Nat. Mater., 4, 622–628.
- 2 Christ, K.V. and Turner, K.T. (2011) Lab Chip, 11, 1491–1501.
- 3 Ainla, A., Jeffries, G., and Jesorka, A. (2012) Micromachines, 3, 442–461.
- 4 Perrault, C.M., Qasaimeh, M.A., and Juncker, D. (2009) J. Vis. Exp.
- 5 Perrault, C.M., Qasaimeh, M.A., Brastaviceanu, T., Anderson, K., Kabakibo, Y., and Juncker, D. (2010) Rev. Sci. Instrum., 81, 115107.
- 6 Ainla, A., Jeffries, G.D.M., Brune, R., Orwar, O., and Jesorka, A. (2012) Lab Chip, 12, 1255–1261.
- 7 Gaddum, J.H. (1961) J. Physiol. (Lond.), 155 (1), P1.
- 8 Ungerstedt, U. and Pycock, C. (1974) Bull. Schweiz. Akad. Med. Wiss., 30 (1–3), 44–55.
- 9 Veselovsky, N.S., Engert, F., and Lux, H.D. (1996) Pflugers. Arch. Eur. J. Physiol., 432 (2), 351–354.
- 10 Feinerman, O. and Moses, E. (2003) J. Neurosci. Methods, 127 (1), 75–84.
- 11 Ainla, A. (2013) The multifunctional pipette/a microfluidic technology for the biosciences. PhD Thesis. Chalmers University of Technology.
- 12 Safavieh, M., Qasaimeh, M.A., Vakil, A., Juncker, D., and Gervais, T. (2015) Sci. Rep., 5, 11943.
- 13 White, F.M. (2006) Viscous Fluid Flow, McGraw-Hill Higher Education, New York, NY.
- 14 Beebe, D.J., Mensing, G.A., and Walker, G.M. (2002) Annu. Rev. Biomed. Eng., 4, 261–286. doi: 10.1146/annurev.bioeng.4.112601.125916
- 15 Christ, K.V. and Turner, K.T. (2010) J. Adhes. Sci. Technol., 24, 2027–2058.
- 16 Christ, K.V. (2011) Hydrodynamically-confined microfluidics for cell adhesion strength measurement. PhD Thesis. University of Wisconsin-Madison.
- 17 Queval, A., Ghattamaneni, N.R., Perrault, C.M., Gill, R., Mirzaei, M., McKinney, R.A., and Juncker, D. (2010) Lab Chip, 10, 326–334.
- 18 Ainla, A., Jansson, E.T., Stepanyants, N., Orwar, O., and Jesorka, A. (2010) Anal. Chem., 82, 4529–4536.