
Chapter 13
Development of Pipettes as Mobile Nanofluidic Devices for Mass Spectrometric Analysis
Anumita Saha-Shah and Lane A. Baker
Indiana University, Department of Chemistry, 800 E. Kirkwood Avenue, Bloomington, IN, 47405, USA
13.1 Introduction
Nano- and micropipettes have found wide application as sensors for chemical and biochemical analytes [1–3], platforms for nanoscale sample manipulation [4–7], and probes for scanning probe microscopies [8–11]. Perhaps the earliest and most widespread application of micropipettes is found in patch-clamp studies [12, 13] and microinjection [14], which have enabled important electrophysiological studies at the level of single ion channels [15]. More recently, dimensions of the pipette tip have reduced to nanometer scales, and as a result, new experiments have become possible, for instance, studies of ion current rectification [16–18] and resistive pulse sensing [19]. Additionally, chemical functionalization of nanopipettes has also been used to incorporate selectivity into nanopipette-sensing platforms [2, 3].
The utility of nanopipettes for fluid delivery and manipulation is an obvious extrapolation of their macroscale counterparts. As dimensions shrink, the behavior of pipettes results in both new challenges and new opportunities for small-scale fluid manipulation. For instance, nanopipettes have found applications in the manipulation of sub-nanoliter volumes of fluid [5] and surface patterning by voltage-controlled deposition of biomolecules [6]. In a seminal study by Mirkin and coworkers, nanopipettes were utilized for voltage-controlled sample collection and delivery of attoliter quantities of material inside cells [5]. For these studies, application of voltage across a liquid–liquid interface resulted in changes in surface tension at the interface, which supplied forces sufficient to aspirate and/or dispense fluids. The authors used voltage delivery to manipulate small volumes of nonpermeable fluorescent dye into cultured mammalian cells. Later, in 2013, Pourmand and coworkers utilized voltage delivery to aspirate mitochondrial nucleic acid from single human BJ fibroblast cells for next-generation sequencing [20]. Pourmand's study also demonstrated that nanopipettes could serve as minimally invasive sampling tools, as cells were shown to recover post-aspiration.
Micropipettes are commonly employed in nanoelectrospray (nanoESI) applications, as described by Wilm and Mann, who employed gold-coated borosilicate capillaries pulled to 1–3 µm diameter openings for electrospray [21, 22]. Apart from serving as electrospray emitters, micropipettes have also been used as sample collection devices and have found wide application in single-cell mass spectrometric analysis [23–29]. The small size of the pipette tip enables isolation and targeting of single cells. Masujima and coworkers have extensively utilized micron-sized pulled capillaries to collect cytoplasm from plant cells for metabolic analysis [28]. Sweedler and coworkers utilized patch-clamp pipettes for whole-cell patch-clamp recording, followed by picoliter sampling for capillary electrophoresis–mass spectrometry (CE–MS) of Sprague-Dawley rat thalamus [25]. Whole-cell patch clamping allowed the study of physiological activity and mass spectrometry (MS) provided molecular information. As mentioned previously, most pipettes used for sample collection are of microscale dimensions, typically tens to hundreds of microns. Ultimately, probe dimensions dictate spatial resolution of sampling and become a critical parameter for local sampling applications. Hence, further efforts have been directed toward design and fabrication of smaller sampling probes, such as proximal probe [30], probe electrospray [31], and single-probe [32–34] designs.
Here, we describe efforts from our laboratory related to development of pipettes as mobile nanofluidic devices [35, 36]. Pipettes with tip dimensions in the range of 100 nm–3 µm were used for these studies. An optical micrograph of a pipette showing the narrow tapered portion that forms the nanofluidic channel of this device is shown in Figure 13.1a and compared to a single strand of human hair (Figure 13.1b–d). Reduction of probe size enabled local sampling from single cells and tissue sections under ambient conditions and combined other advantages of electrospray from small emitters, as discussed in the following text. Use of dual-barrel nanopipettes afforded the opportunity to collect multiple sub-nanoliter volumes of sample inside a single probe in a segmented fashion. Subsequent delivery of segments to a mass spectrometer enabled analysis of multiple sample segments with simplified sample transfer steps [36]. This strategy is borrowed from very well-established techniques that allow parallel and high-throughput analyses and is discussed in detail in the following section.
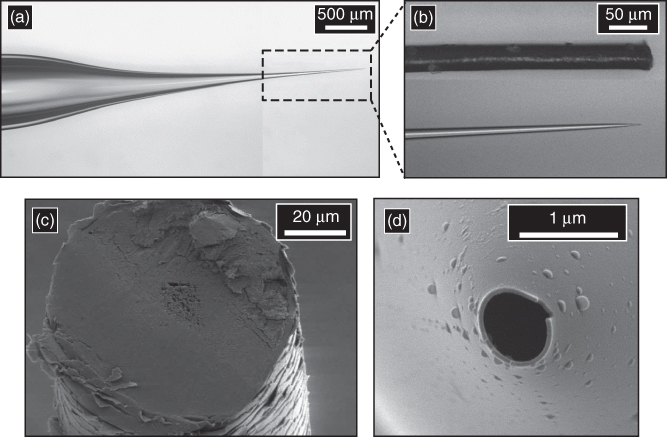
Figure 13.1 (a) Optical micrograph of a nanopipette. Shown in (b) is an optical micrograph of the pipette tip laid side-on with a single strand of human hair. Shown in (c) is an SEM image of cross-section of human hair [37] in comparison to nanopore at the tip of a pipette (d).
13.2 Segmented Flow Analysis
Droplet microfluidics [38, 39] and digital microfluidics [40] have emerged from continuous flow systems and use immiscible phases to form an emulsion of monodisperse droplets or segments of analyte. These droplets or segments can be manipulated, transported, and analyzed separately [38, 39, 41] and present great potential for parallel and/or high-throughput analysis [39]. Other advantages of these systems include minimization of reagent cost and dilution-free analysis of precious samples. These systems have been applied to study reaction kinetics [42, 43], single molecules [38], and single cells [44–46]. These segmented flow systems have been combined with various detection systems such as fluorescence microscopy, electrochemical detection, capillary electrophoresis, spectroscopy, and mass spectrometry [41]. Combination of mass spectrometry with segmented flow systems is especially advantageous because multiple chemical species can be analyzed simultaneously in a nontargeted manner. Several strategies have been developed to make this combination possible. For example, a glass-lined stainless steel capillary was embedded in the microfluidic device by Tureček and coworkers to enable droplet transfer from the microfluidic device to the first vacuum region of the mass spectrometer [44]. Pulled Pt-coated fused-silica electrospray emitters of 30 µm inner diameters (i.d.s) were utilized by Kennedy and coworkers to transfer aqueous droplets from segmented flow device to mass spectrometer inlet [47]. Special microfluidic devices have been fabricated by Smith and coworkers to combine their chip-based microfluidic setup with ESI. In this device, the sample was delivered to the mass spectrometer by an on-chip aqueous stream that terminated into a conical tip [48]. Integration of mass spectrometry with segmented flow systems has enabled screening of enzyme inhibitors [47], in vivo monitoring of neurotransmitter release in anesthetized rat brain [49], and analysis of mammalian cell lysate [44]. Transformation of these static devices into movable probes offers additional advantages in that a mobile device can be used to scan across a heterogeneous surface and analyze samples of interest. Prior literature examples have demonstrated the power of integration of segmented flow analysis with mobile microfluidic devices for study of chemical heterogeneity in flat tissue sections and large surfaces that cannot be analyzed by conventional microfluidic devices [50–53]. These studies form the inspiration for combination of segmented flow analysis with our pipettes for the development of a mobile nanofluidic device that is capable of sample heterogeneity studies.
In our study, segmented flow analysis enabled ESI-MS analysis of ∼200 pL segments that, to our knowledge, are smaller than other segmented flow [48–50, 54, 55], continuous flow [56], and droplet microfluidic ESI-MS [44, 57, 58] systems reported in literature. Analysis of such small volumes was possible due to nanoscale dimensions of pipettes and low electrospray flow rates (on the order of 5–20 nL/min). Low electrospray flow rate has additional implications in mass spectrometric analysis and is discussed in detail in the following section.
13.3 Utility of Nano- and Micropipettes in Mass Spectrometry
Nano- and micropipettes have found profound use in ESI [21, 59]. For instance, microscale emitters have been used to perform electrospray with reduced flow rate (nanoliters per minute) that is popularly known as nanoESI. Conventional electrospray utilizes millimeter-scale emitters and forms micron-sized charged droplets during the electrospray process. Droplets generated from nanoelectrospray are believed to be in nanometer regime due to small emitter dimension and reduced flow rate [60]. Reduction in electrospray flow rate gives rise to many interesting phenomena such as supercharging [59, 61], high salt tolerance [60], and high signal-to-noise (S/N) ratio [59, 60]. The latter attributes (of high salt tolerance and S/N ratio) are extremely important for analysis of complex biological samples that naturally have high salt content and low abundance of individual molecules.
Electrospray from small emitters also enable native electrospray conditions where biomolecules can be electrosprayed under physiological conditions [62]. This is extremely important from a structural biology standpoint because at lower pH (conditions suitable for electrospray), the secondary protein structure is destroyed. Hence, MS is not useful to derive important information about native structure of proteins. In native electrospray, the pH can be maintained under neutral conditions either by electrospraying a sample as is (as demonstrated with our nanofluidic devices, discussed in the following text) or by preparing a solution in pH ∼7 buffer [60]. Overall, nanoESI process results in many attributes that are beneficial to analysis of biomolecules under native conditions.
Native electrospray is important in the context of our mobile nanofluidic device, as samples are directly electrosprayed from a pipette tip without the addition of organic solvent and acid solution typically used to assist in ionization. Moreover, low electrospray flow rates from these emitters enable electrospray of cell samples for sufficient amount of time. Hence, our mobile nanofluidic device combines the advantages of local sample collection and small emitter dimension toward single-cell analysis and studies of cell heterogeneity. The development of our mobile nanofluidic device is detailed in the following text.
13.4 Development of Nanopipette Probes for Local Sampling
Nanopipettes are fabricated from quartz or borosilicate capillaries through the use of a laser-based pipette puller. The tip diameter can be varied from a scale of tens to hundreds of nanometers, dimensions determined conveniently by optical and electron microscopy. The geometry of a nanopipette can be defined based on the parameters such as tip, shank, shoulder, and stem size, which are indicated in Figure 13.2a.
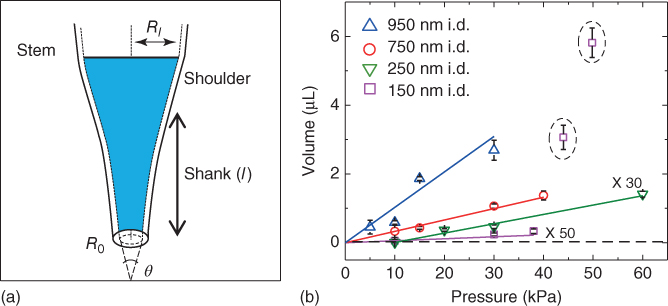
Figure 13.2 (a) Illustration of a nanopipette that indicates geometric parameters such as tip radius (R0), shank length (l), shoulder, radius after volume ingress inside the pipette (Rl), and cone angle (θ) and (b) volume of sample aspirated as a function of pressure for tip diameters ∼950 nm (i.d.) ( ), ∼750 nm (i.d.) (
 ), ∼250 nm (i.d.) (
 ), and ∼150 nm (i.d.) (
 ). For all the plots, n = 3, where n corresponds to three independent measurements with different nanopipettes of similar dimensions.
(Adapted from Ref. [35].)
In nanometer sized pipettes, hydrodynamic resistance at the tip is high, and hence capillary action is not sufficient for sample collection, as is typically the case with micropipettes of orifice >10 µm. Hence, pipettes were connected to an apparatus for application of negative pressure for sample aspiration and positive pressure for dispensation. The apparatus consisted of a vacuum-tight tee connector, which was connected to the pipette via polyethylene tubing. The other ports of the tee connector were connected to a pressure controller and pressure monitor for simultaneous application and monitoring of pressure.
Nanopipettes were shown to be an efficient tool for reproducible fluid collection through pressure actuation. Shown in Table 13.1 are the volumes of sample aspirated with three different pipettes of similar tip size and geometry. Volume of water collected by the device was found to be reproducible when a pressure difference of 44 kPa was applied for 1 min to each of the ∼150 nm pipettes, with variation in aspirated volume of ∼12%, which is attributed to slight differences in pipette geometry. Sample volumes (V) in this study were calculated as described by Mirkin and coworkers, which utilized the experimentally obtained height of solution ingress (L) and pipette geometry for volume calculations, as given by Eq. (13.1) [5].
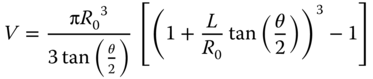
Here, R0 is the tip diameter, θ is the pipette cone angle, and L is the height of solution ingress. Desired volume of sample was collected inside the pipette by varying the applied pressure. Shown in Figure 13.2b is a plot of volume aspirated as a function of pressure for pipettes of ∼150, ∼750, and ∼950 nm inner diameters (i.d.). The volume of sample aspirated (V) can be modeled by a modified Hagen–Poiseuille equation for fluid flow inside tapered channels (the pipette shank, for this study), as given by Eq. (13.2) [63, 64]:

where ΔP is pressure difference, ρ is the fluid density, μ is fluid viscosity, L is height of ingress, and R0 and Rl refer to the inner radii of the tapered tube at the tip and at height “L,” respectively. The term given by “![]() ” is known as the taper function and accounts for geometric parameters of the pipette shank. For ∼150 nm pipettes, the pressure versus volume plot was found to deviate from linearity, as highlighted by the black dotted circle in Figure 13.2b at ΔP > 38 kPa, a consequence of the conical pipette geometry. Similarity in the relationship between pressure and both calculated taper function (from experimentally determined R0 and Rl) and experimentally measured volume sampled (Figure 13.3) clearly demonstrate the role of pipette geometry. To further examine the effect of pipette geometry on sampled volumes, pipettes with long shanks (long tapers with small cone angles) were also fabricated. Long-shank pipettes exhibited a linear relationship over the range of pressures studied, unlike short-shank pipettes. Close inspection of optical micrographs of long-shank nanopipettes revealed that sample did not enter the shoulder region even at a pressure difference of 50 kPa. This behavior is in contrast to that of short-shank nanopipettes where at ΔP > 38 kPa the sample enters into the shoulder region (and hence gives rise to the deviation in sampling volume). Even though they were more difficult to fill, the long-shank pipettes proved to be beneficial in subsequent studies where precise control of small volumes was desired.
” is known as the taper function and accounts for geometric parameters of the pipette shank. For ∼150 nm pipettes, the pressure versus volume plot was found to deviate from linearity, as highlighted by the black dotted circle in Figure 13.2b at ΔP > 38 kPa, a consequence of the conical pipette geometry. Similarity in the relationship between pressure and both calculated taper function (from experimentally determined R0 and Rl) and experimentally measured volume sampled (Figure 13.3) clearly demonstrate the role of pipette geometry. To further examine the effect of pipette geometry on sampled volumes, pipettes with long shanks (long tapers with small cone angles) were also fabricated. Long-shank pipettes exhibited a linear relationship over the range of pressures studied, unlike short-shank pipettes. Close inspection of optical micrographs of long-shank nanopipettes revealed that sample did not enter the shoulder region even at a pressure difference of 50 kPa. This behavior is in contrast to that of short-shank nanopipettes where at ΔP > 38 kPa the sample enters into the shoulder region (and hence gives rise to the deviation in sampling volume). Even though they were more difficult to fill, the long-shank pipettes proved to be beneficial in subsequent studies where precise control of small volumes was desired.
Table 13.1 List of pipette parameters and volume of sample aspirated, for three pipettes with identical conditions of pressure, time, and solution viscosity
| Pipette # | Height of ingress (µm) | Cone angle (°) | Volume (nL) | Average volume (nL) | Standard deviation (nL) | RSD (%) |
| 1 | 1007 | 12 | 53 | |||
| 2 | 1041 | 14 | 66 | 61 | 7 | 12 |
| 3 | 1014 | 13 | 63 |

Figure 13.3 Volume of sample aspirated ( ) and variation in taper function (
 ) as a function of pressure difference for ∼150 nm short-shank pipettes. Volume of the sample was calculated based on pipette geometry and experimentally determined “L.” Taper function was calculated based on experimentally determined Rl and R0.
(Adapted from Ref. [35].)
13.5 MALDI-MS Analysis of Analyte Post-Nanopipette Sampling
To combine nanopipette sampling with matrix-assisted laser desorption ionization mass spectrometry (MALDI-MS), sample was deposited by micromanipulator-assisted approach of the nanopipette into a drop of water on a MALDI target plate. After the tip of the nanopipette was immersed into the drop of water, sample was dispensed, and the tip was then retracted. For these experiments, a hydrophobic AnchorChipTM plate was used. The hydrophobic coating proved beneficial to form small water droplets, with high contact angles, which facilitated ease of insertion of pipettes into the drop. Also, after solvent evaporation, small droplet size concentrated analyte in a smaller geometric footprint, which can enhance signal. Scanning transmission electron microscopy (STEM) images acquired post-sample deposition to verify the integrity of the pipettes. Fragile pipettes were found to remain intact throughout the sampling and deposition process, and hence this strategy approves an interesting route to sample collection with extremely fine-tipped pipettes. Figure 13.4a shows a mass spectrum of angiotensin I that was sampled with a 112 nm i.d. nanopipette. Images of the pipette tip before and after the experiment are shown in Figure 13.4b,c. Application of similar pipettes for collection of samples with spatial resolution is discussed in the following text for (i) analysis of oligosaccharides in single Allium cepa cell and (ii) analysis of lipids in rat brain.

Figure 13.4 (a) MALDI-MS spectra of 20 μM angiotensin I aspirated into a 112 nm i.d. nanopipette. Volume of analyte aspirated was 32 nL, or 644 fmol, of angiotensin I (matrix: α-cyano-4-hydroxycinnamic acid). Scanning transmission electron micrograph of the nanopipette before (b) and after (c) sampling. Pipette i.d. before and after sampling was ∼112 nm.
(Reprinted from Ref. [35].)
13.5.1 Single Allium cepa Cell Analysis
The small size of nanopipette tips makes them suitable tools for sample collection from single cells. To demonstrate sample collection, nanopipettes (600 nm i.d.) were mounted on a micromanipulator and approached to a cell of interest (Figure 13.5a). The cell was punctured and cytoplasm was aspirated by application of negative pressure. Sampled cytoplasm was dispensed on a MALDI plate, and 2,5-dihydroxybenzoic acid matrix was then applied for analysis of hydrophilic metabolites, such as oligosaccharides (see spectra Figure 13.5b). Peaks were tentatively assigned from mass matches (mass accuracy <25 ppm) to metabolites previously identified in A. cepa [32, 65, 66]. A list of metabolites identified is provided in Table 13.2. On the basis of accurate mass measurement, prominent peaks were assigned to hexose oligosaccharides with degrees of polymerization 3–7. Oligosaccharide peaks were observed as potassium adducts, consistent with previous reports on carbohydrate analysis of A. cepa [65].
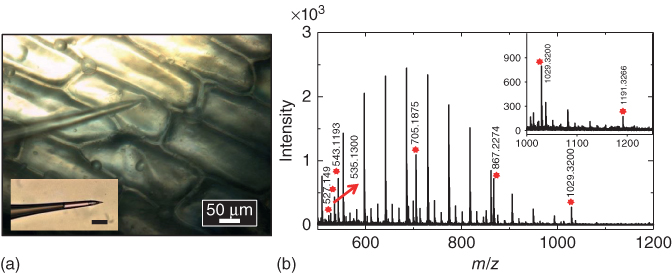
Figure 13.5 (a) Optical micrograph showing a nanopipette used to sample cytoplasm from an Allium cepa epidermal cell. Inset shows an optical micrograph of the pipette post sampling. The sampled volume was calculated to be ∼8 nL and was subjected to positive ion MALDI-TOF mass spectrometry to obtain the mass spectra as shown in (b).
(Reprinted from Ref. [35].)
Table 13.2 Tentative peak assignments in mass spectrum of a single Allium cepa cell
| Assignment | Exact mass | Observed mass | Δppm |
| Glutamine+sucrose+K+ | 527.1490 | 527.1424 | 12.5 |
| Cyanidin malonyl glucoside | 535.1087 | 535.1300 | 39.8 |
| Trisaccharide+K+ | 543.1328 | 543.1193 | 28.8 |
| Tetrasaccharide+K+ | 705.1875 | 705.1815 | 2.6 |
| Pentasaccharide+K+ | 867.2384 | 867.2274 | 12.6 |
| Hexasaccharide+K+ | 1029.2913 | 1029.3200 | 27.8 |
| Heptasaccharide+K+ | 1191.3440 | 1191.3266 | 14.6 |
13.5.2 Lipid Analysis in Mouse Brain
Analysis of flat tissue sections to build a chemical map is of utmost importance in the study of clinical samples. Modifications to the procedure described previously enabled analysis of flat tissue sections with nanopipette probes. Tissue section sampling was performed by approaching the sample with a solvent-filled pipette. The small tip orifice of the pipette enabled dispensation of a small volume of solvent, which was confined to a small area, thus enabling local extraction of biomolecules. This solvent with solubilized biomolecules was then aspirated back into the pipette for MALDI-MS analysis. Lipid analysis from mouse brain sections were accomplished with nanopipettes filled with a chloroform/methanol solution. The solvent mixture was chosen based on Folch method for lipid extraction [67]. Matrix used for this study was 2,5-dihydroxybenzoic acid dissolved in a mixture of 50% methanol–water. Drop size at the tip was manipulated by pressure to obtain spot diameters of 50–1000 µm. Figure 13.6a shows a mass spectrum of lipids extracted from a 50 µm diameter spot of mouse brain cerebrum. The spot size for sample extraction can be easily determined by post-sample extraction mark as shown in Figure 13.6b formed due to contact of organic solvent with the tissue section. Phosphotidylcholine peaks were the major peaks observed in positive ion mode. Peaks were assigned based on accurate mass and previous reports of lipid analysis from mouse brain and include PC 32 : 0, PC 34 : 1, PC 36 : 1, and PC 36 : 4, lipids found in abundance in the cerebral cortex [68]. The spatial resolution of sampling for these studies was on the order of 50 µm, which compares well to present state-of-the-art surface sampling techniques, such as liquid extraction surface analysis (LESA) [69] and pressurized liquid extraction surface analysis (PLESA) [70], which can have typical spot sizes >400 µm.

Figure 13.6 (a) Positive ion MALDI-MS of extracted lipids from a ∼50 µm diameter spot of mouse brain tissue section. (b) Optical micrograph of the brain tissue section from which lipids were extracted. The damage created by solvent extraction can be seen in the image.
(Reprinted from Ref. [35].)
To advance the scope of these techniques for chemical mapping, improvement of experimental throughput was desired. Our efforts in this regard are detailed in the next section.
13.6 Development of Segmented Flow Sampling
To facilitate the study of sample heterogeneity and increase throughput of analysis, segmented flow sampling with pipettes was developed. In this strategy, multiple layers of sub-nanoliter aqueous samples were sandwiched between immiscible perfluorodecalin (PFD) plugs to address challenges associated with manipulation and transport of molecules without dispersion or dilution. Maintaining the integrity of each sample enables preservation of time resolution. In this study, push–pull theta pipettes were shown to enable registration of chemical information in sub-nanoliter plugs, which are subsequently delivered to the mass spectrometer for dilution-free analysis of molecular signals. The small size of the sample inlet enables registration of local information with spatial resolution. Theta pipettes of nominally 800 nm to 1 µm i.d. (each barrel) were converted to push–pull nanofluidic devices through the connection of pressure controllers to each barrel. Shown in Figure 13.7a is an SEM image of a typical theta pipette used to fabricate push–pull probes. The glass septum separating the pipette into two barrels is shown in the STEM image in Figure 13.7b. Both barrels of a double-barrel pipette were filled with PFD, and spray solution-filled polyethylene tubing was connected to each barrel of the capillary via stainless steel needles to form push–pull probes. A conductive carbon tape was connected to the metal needle to form a contact pad for potential application during electrospray. Finally, the tubing glass capillary junction was sealed with epoxy glue to form two independent microchannels (see Figure 13.7c). The pipette was mounted on a pipette positioning system built from an x–y–z stepper motor with 3 µm resolution, which enabled motorized movement of the pipette. Steps involved in formation of segments inside the pipette are shown in Figure 13.8. In a typical experiment, the pipette is approached close to the sample of interest, and a negative pressure was applied to the first barrel of the pipette to aspirate a small volume of sample (Figure 13.8a). A positive pressure was then applied to the second barrel to form a drop of fluorous solvent at the pipette tip, which was then aspirated into the first barrel (Figure 13.8b). This process was repeated multiple times to create alternating segments of aqueous sample and PFD. After sample collection, application of negative and positive pressure was terminated to prevent further ingress of aqueous solution or dispensation of PFD. Positive and negative pressure to the push–pull probe was applied through a microinjector and a syringe pump, respectively. The microinjector for application of pulsed push was triggered by a function generator. Shown in Figure 13.9a is the input waveform applied to the function generator for triggering the microinjector. Peaks in the waveform correspond to the application of positive pressure, and the minima represent quiet time when no positive pressure was applied. Aspiration was continuously performed on the second barrel by application of negative pressure through the syringe pump in withdrawal mode. Optimized push–pull parameters enabled formation of regular segments as shown in Figure 13.9b. Positive pressure was applied in two bursts of 1.5 s instead of a 3 s pulse to prevent the PFD drop at the tip of the pipette from becoming too large and falling off due to gravity. The aforementioned dispensed volume of PFD was aspirated inside the sampling barrel, which was maintained at negative pressure. Positive pressure pulses were followed by a quiet time when no PFD was dispensed, which enabled aspiration of aqueous sample. Push–pull theta pipettes were easily converted to electrospray emitters by application of potential (1.5 kV) to the pipette. This method enabled analysis of aqueous segments as small as 170 pL, an order of magnitude smaller than other segmented flow ESI-MS methods presently found in literature [49, 54, 56]. (Other similar methods, such as droplet microfluidics [44, 48, 57, 58] and segmented flow ESI-MS [49, 54, 56], utilizing glass capillaries have reported analysis volumes greater than 3 nL, while 15 nL and above are common.) The input waveform (to the microinjector) can be easily manipulated to obtain segments of 200 pL to several nanoliters.

Figure 13.7 (a) Scanning electron micrograph (end-on view) of a typical theta probe, used for segmented flow sampling. (b) Scanning transmission electron micrograph of the probe (side-on view) showing the septum that separates the probe into two barrels. (c) Schematic of steps involved in fabrication of push–pull probe.
(Saha-Shah et al. (2016) [36]. Copyright 2016. Reproduced with permission of Royal Society of Chemistry.)
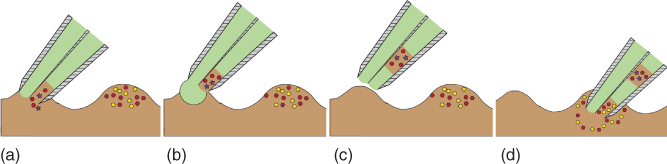
Figure 13.8 Schematic showing the steps involved in segmented flow sampling. The process of aspiration of first segment (into the first barrel) (a) is followed by dispensation of PFD from the second barrel (b). After aspiration of the PFD and formation of an immiscible plug, the pipette is retracted (c) and moved to new location for aspiration of second segment (d).
(Saha-Shah et al. (2016) [36]. Copyright 2016. Reproduced with permission of Royal Society of Chemistry.)

Figure 13.9 Segmented flow sampling was automated by applying a pulsed push with a microinjector and a constant programmed pull through a syringe pump. Schematic of pulsed push is given in (a). Fluoresence micrograph of regular picoliter volume segments in (b).
(Saha-Shah et al. (2016) [36]. Copyright 2016. Reproduced with permission of Royal Society of Chemistry.)
The volumes of these segments are appropriate for analysis of single cells and nanoscale materials. Before application of our push–pull pipettes to study cell samples, a model system was utilized to evaluate the potential of this device toward measurement of local heterogeneity in sample. Since neurotransmitter release from a single nerve cell is an active area of research [71–73], our probes can, in future, find application in the study of dopamine release. Hence, the model system used for this study was a gold microelectrode immersed in a dopamine solution to study the electrochemical oxidation of dopamine to dopamine quinone. The gold microelectrode embedded in a glass chip was immersed in a 1 mM dopamine solution (prepared in 70 : 29 : 1 methanol–water–acetic acid) and was biased at 1.5 V versus Ag/AgCl to oxidize dopamine (Dop) (m/z 154.08) to dopamine ortho-quinone (DopQ) (m/z 152.07). The push–pull theta pipette was then approached close (10–20 µm from surface) to the gold substrate. Dopamine solutions were collected close to the electrode and away from the electrode. Shown in Figure 13.10 are the mass spectra of sample collected close to (a) and away from (b) the gold microelectrode. The segment collected close to the microelectrode had a higher DopQ concentration as a result of the oxidation of dopamine at the gold electrode, and solution collected close to the insulating (glass) surface had a very small DopQ peak, which could be a result of diffusion. This observation supports the effectiveness of this probe toward registration of spatial chemical information from a solution with heterogeneous concentration. This result motivated us to further advance the scope of the probe toward intercellular heterogeneity studies as discussed in the following text.
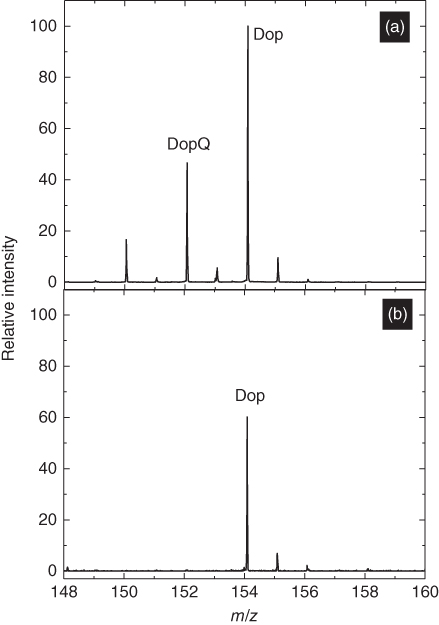
Figure 13.10 Mass spectra of aqueous segments collected close to a gold microelectrode (a) and close to an insulating surface (b) of a gold-printed glass chip immersed in dopamine.
(Saha-Shah et al. (2016) [36]. Copyright 2016. Reproduced with permission of Royal Society of Chemistry.)
13.7 Study of Intercellular Heterogeneity
Understanding cell-to-cell heterogeneity in a population has been a major area of research investigation in recent years. Studies have revealed that individual cells in a population can vary significantly and can have important impacts on health and function of the entire population [74]. A mass spectrometric method to analyze metabolite profiles of individual cells in a population could be extremely beneficial for investigation of intercellular heterogeneity in a nontargeted fashion. A study of intercellular heterogeneity among A. cepa cells was undertaken to determine the efficacy of our method. Some A. cepa cells, when observed under the optical microscope, are bright red and others are colorless (Figure 13.11a). Red flavonoids, popularly known as anthocyanins, are responsible for this bright red color [75]. Our study focuses on the determination of metabolites from individual red and white cells and correlates the color of the cell to the abundance of anthocyanin peaks in the mass spectra. Push–pull theta pipettes of ∼3 µm i.d. (each barrel) were used for this study. The viscosity of cell cytoplasm was significantly higher than standard solutions; as a result, larger pipettes with less hydrodynamic resistance were used for operational convenience. Cells were located and punctured with theta push–pull pipettes under an optical microscope. Cell cytoplasm was aspirated inside the first barrel by application of a negative pressure. After sampling, PFD was dispensed from the second barrel to fill up the punctured and deflated cell (after cytoplasmic aspiration the cells were deflated), and PFD was then aspirated into the sampling barrel. The pipette was retracted and moved to the vicinity of the next cell. The same process was repeated to sample two cells with a single probe. After sampling, the cytoplasmic samples were delivered to a mass spectrometer for chemical analysis via ESI-MS, as described previously.
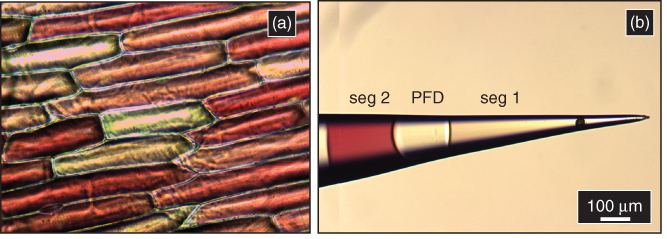
Figure 13.11 (a) Optical micrograph of Allium cepa cells showing the intercellular heterogeneity in color. (b) Optical micrograph of a pipette (taken in two frames) with two segments (seg) containing cytoplasm from a colorless (seg 1) and a red (seg 2) Allium cepa cell.
(Saha-Shah et al. (2016) [36]. Copyright 2016. Reproduced with permission of Royal Society of Chemistry.)
Shown in Figure 13.11b is the optical micrograph of the pipette after sampling cytoplasm from A. cepa cells. The pipette was placed such that the segmented barrel is faced up. Segment 2 is bright red in color, since it was collected from a red cell. Segment 1 was collected from a colorless cell and, hence, was colorless. Shown in Figure 13.12a is the total ion chromatogram of the pipette (shown in Figure 13.11b) during sample delivery. Figure 13.12b,c is the mass spectra of segments 1 and 2, respectively. The peaks labeled by (*) are tentatively assigned based on accurate mass measurement to previously identified red anthocyanins [31, 32, 76–79], such as cyanidin, delphinidin, anthocyanin derivatives, and other colored flavonoids (see assignments in Table 13.3), which are found in abundance in the red cells and are mostly absent in colorless A. cepa cells [32]. Peaks labeled by (**) are hexose oligosaccharides commonly found in both red and white cells [65]. Comparison of mass spectra of each cell revealed that anthocyanins are not detected in colorless cells and strong peaks corresponding to anthocyanins are observed in red cells, as per our expectation. To understand the effect of carry-over on cell sampling, the sequence of cell sampling was reversed in the second trial, meaning a red cell was sampled first, followed by a white cell. In both trials, minimal carry-over of red dyes (anthocyanins) was observed during analysis of colorless cell cytoplasm. The rate of carry-over was found to be less than 5% for very concentrated solution of analyte. In other biological samples analyte concentration may be more dilute, and carry-over between segments may be lower than 5%. Thus, segmented flow sampling is an effective method to study intercellular heterogeneity among cells. This study demonstrates that our push–pull theta pipettes are suitable for capturing and registering chemical information in sub-nanoliter plugs and can find possible applications in studies of surface mapping, sample heterogeneity, and spatio-temporal dynamics of biological samples.

Figure 13.12 (a) Total ion chromatogram showing the delivery of two segments collected from a colorless (seg 1) and a red (seg 2) cell. Mass spectrum of seg 1 is shown in (b) and seg 2 in (c). The peaks labeled by (*) correspond to anthocyanins (red dyes found in red cells only) and peaks by (**) are hexose oligosaccharides (found in all cells).
(Saha-Shah et al. (2016) [36]. Copyright 2016. Reproduced with permission of Royal Society of Chemistry.)
Table 13.3 Tentative peak assignments from the red Allium cepa epidermal cell in Figure 13.12c
| Assignment | Exact mass | Observed mass | Δppm |
| Cyanidin | 287.0515 | 287.0545 | 10.4 |
| Delphinidin/quercetin+H+ | 303.0505 | 303.0478 | 12.2 |
| Disaccharide+K+ | 381.0799 | 381.0798 | 0.2 |
| Cyanidin glucoside | 449.1006 | 449.1072 | 14.6 |
| Delphinidin glucoside/quercetin glucoside+H+ | 465.1033 | 465.1034 | 0.2 |
| Cyanidin glucoside pyruvic acid | 517.082 | 517.0914 | 13.1 |
| Cyanidin malonyl glucoside | 535.1087 | 535.1089 | 0.3 |
| Trisaccharide+K+ | 543.1328 | 543.1330 | 0.3 |
| Tetrasaccharide+K+ | 705.1875 | 705.1856 | 2.6 |
13.8 Conclusion and Outlook
We have described development of nano- and micropipettes as easy-to-fabricate, mobile nanofluidic devices that hold potential to overcome some present limitations in delivering, capturing, storing, and analyzing chemical analytes. The volume and length scale of these devices are commensurate with applications in life sciences and can provide a platform for capturing molecular signals from multiple locations with high spatial resolution. Device fabrication was directed to facilitate analysis of molecules by mass spectrometry, which serves as a universal detector. Incorporation of MS enabled simultaneous detection of multiple analytes in a nontargeted manner, and, in the future, the scope of such devices could be expanded toward “omic” studies. The application of micropipettes in ESI is well developed and salient features such as native electrospray and high salt tolerance translate to or are improved with the use of nanopipettes. As a result, samples collected by these devices can be introduced to mass spectrometer without any sample preparation steps or addition of acids to assist in ionization.
These devices were shown to be applicable for selective desorption of analytes for targeted analysis of lipids and hydrophobic molecules. To extend the application of this device, efforts are currently underway to develop strategies for microscale chemical and biochemical reactions on biological interfaces. This will provide a route for targeted analysis of specific class of molecules from a cell or tissue section.
A significant challenge lies in automation of the sample collection process that, if addressed, can enable the device to raster across a surface and collect multiple samples to generate a chemical map. This process can be facilitated by combining the mobile nanofluidic device platform with scanning probe techniques. Nanopipettes are widely used as probes for several scanning probe microscopy techniques and provide opportunity for development of hybrid techniques such as their combination with scanning ion conductance and scanning electrochemical microscopy. Although this study demonstrated the ESI-MS analysis of smallest segments, the limits can be pushed further to enable manipulation of smaller volumes. Moreover, strategies must be devised for the collection of a greater number of sample segments. Multiple opportunities exist to improve this technology, which if addressed can enable future applications of similar devices toward the investigation of extracellular communications, secretion of signaling molecules, response to a stimulus, metabolic exchanges in biofilms, and related applications.
We envision that the simplicity of sample manipulation by pressure actuation will make it easily adoptable by researchers from various disciplines. We also envision the combination of this technology with other detection platforms such as fluorescence albeit no detection platform can provide the wealth of information that MS can provide in a single-cell analysis. But sensitivity of MS is far from single-molecule detection; hence, there is definitely a value in combining this technology with other detection platforms.
Application of these probes can also be extended toward droplet generation and can prove to be an interesting avenue for study of single-molecule reaction kinetic and generation of droplet arrays. Droplet arrays can potentially be combined with electrostatic spray ionization mass spectrometry (ESTASI-MS) for high spatial resolution ambient mass spectrometry and may be extended toward mass spectrometry imaging applications. Thus, the pipette-based mobile nanofluidic device holds significant promise for application in numerous fields of science.
Acknowledgments
Support of Indiana University is acknowledged. The Nanoscale Characterization Facility and Mass Spectrometry Facility at Indiana University are appreciated for SEM, FIB (acquired through the National Science Foundation MRI program (0923064)), and MALDI mass spectrometer use for this study. The authors would like to acknowledge IU Electronic and Mechanical Instruments Services for help in building tools necessary for this work. Critical suggestions and assistance from Prof. Gary M. Hieftje, Prof. Steven J. Ray, Dr Jonathan A. Karty, Dr Jonathan C. Trinidad, Curtis M. Green, and David H. Abraham are appreciated. Selected portions of this work were originally reported in publications by the Royal Society of Chemistry, specifically Chemical Science (DOI: 10.1039/C5SC00668F) and Analyst (DOI: 10.1039/C6AN00028B).
References
- 1 Actis, P., McDonald, A., Beeler, D., Vilozny, B., Millhauser, G., and Pourmand, N. (2012) RSC Adv., 2, 11638.
- 2 Umehara, S., Karhanek, M., Davis, R.W., and Pourmand, N. (2009) Proc. Natl. Acad. Sci. U.S.A., 106, 4611.
- 3 Fu, Y., Tokuhisa, H., and Baker, L.A. (2009) Chem. Commun., 4877.
- 4 Adam Seger, R., Actis, P., Penfold, C., Maalouf, M., Vilozny, B., and Pourmand, N. (2012) Nanoscale, 4, 5843.
- 5 Laforge, F.O., Carpino, J., Rotenberg, S.A., and Mirkin, M.V. (2007) Proc. Natl. Acad. Sci. U.S.A., 104, 11895.
- 6 Rodolfa, K.T., Bruckbauer, A., Zhou, D., Korchev, Y.E., and Klenerman, D. (2005) Angew. Chem. Int. Ed., 44, 6854.
- 7 Rodolfa, K.T., Bruckbauer, A., Zhou, D., Schevchuk, A.I., Korchev, Y.E., and Klenerman, D. (2006) Nano Lett., 6, 252.
- 8 Hansma, P.K., Drake, B., Marti, O., Gould, S.A., and Prater, C.B. (1989) Science, 243, 641.
- 9 Ebejer, N., Güell, A.G., Lai, S.C.S., McKelvey, K., Snowden, M.E., and Unwin, P.R. (2013) Annu. Rev. Anal. Chem., 6, 329.
- 10 Takahashi, Y., Shevchuk, A.I., Novak, P., Murakami, Y., Shiku, H., Korchev, Y.E., and Matsue, T. (2010) J. Am. Chem. Soc., 132, 10118.
- 11 Yuill, E.M., Shi, W., Poehlman, J., and Baker, L.A. (2015) Anal. Chem., 87, 11182.
- 12 Sakmann, B. and Neher, E. (1984) Ann. Rev. Physiol., 46, 455.
- 13 Hamill, O.P., Marty, A., Neher, E., Sakmann, B., and Sigworth, F.J. (1981) Pflugers Arch., EJP, 391, 85.
- 14 Graessmann, M. and Graessmann, A. (1983) Methods Enzymol., 101, 482.
- 15 Sakmann, B. and Neher, E. (2009) Single-Channel Recording, 2nd edn, Springer, New York.
- 16 Siwy, Z.S. (2006) Adv. Funct. Mater., 16, 735.
- 17 White, H.S. and Bund, A. (2008) Langmuir, 24, 2212.
- 18 Wei, C., Bard, A.J., and Feldberg, S.W. (1997) Anal. Chem., 69, 4627.
- 19 Bayley, H. and Martin, C.R. (2000) Chem. Rev., 100, 2575.
- 20 Actis, P., Maalouf, M.M., Kim, H.J., Lohith, A., Vilozny, B., Seger, R.A., and Pourmand, N. (2014) ACS Nano, 8, 546.
- 21 Wilm, M. and Mann, M. (1996) Anal. Chem., 68, 1.
- 22 Wilm, M.S. and Mann, M. (1994) Int. J. Mass Spectrom. Ion Processes, 136, 167.
- 23 Lorenzo Tejedor, M., Mizuno, H., Tsuyama, N., Harada, T., and Masujima, T. (2011) Anal. Chem., 84, 5221.
- 24 Masujima, T. (2009) Anal. Sci., 25, 953.
- 25 Aerts, J.T., Louis, K.R., Crandall, S.R., Govindaiah, G., Cox, C.L., and Sweedler, J.V. (2014) Anal. Chem., 86, 3203.
- 26 Gholipour, Y., Erra-Balsells, R., Hiraoka, K., and Nonami, H. (2013) Anal. Biochem., 433, 70.
- 27 Zhang, L., Foreman, D.P., Grant, P.A., Shrestha, B., Moody, S.A., Villiers, F., Kwak, J.M., and Vertes, A. (2014) Analyst, 139, 5079.
- 28 Fujii, T., Matsuda, S., Tejedor, M.L., Esaki, T., Sakane, I., Mizuno, H., Tsuyama, N., and Masujima, T. (2015) Nat. Protoc., 10, 1445.
- 29 Phelps, M., Hamilton, J., and Verbeck, G.F. (2014) Rev. Sci. Instrum., 85, 124101.
- 30 Ovchinnikova, O.S., Nikiforov, M.P., Bradshaw, J.A., Jesse, S., and Van Berkel, G.J. (2011) ACS Nano, 5, 5526.
- 31 Gong, X., Zhao, Y., Cai, S., Fu, S., Yang, C., Zhang, S., and Zhang, X. (2014) Anal. Chem., 86, 3809.
- 32 Shrestha, B., Patt, J.M., and Vertes, A. (2011) Anal. Chem., 83, 2947.
- 33 Stolee, J.A., Shrestha, B., Mengistu, G., and Vertes, A. (2012) Angew. Chem. Int. Ed., 51, 10386.
- 34 Pan, N., Rao, W., Kothapalli, N.R., Liu, R., Burgett, A.W.G., and Yang, Z. (2014) Anal. Chem., 86, 9376.
- 35 Saha-Shah, A., Weber, A.E., Karty, J.A., Ray, S.J., Hieftje, G.M., and Baker, L.A. (2015) Chem. Sci., 6, 3334.
- 36 Saha-Shah, A., Green, C.M., Abraham, D.H., and Baker, L.A. (2016) Analyst, 141, 1958.
- 37 Wei, X. (2006) What is Human Hair? A Light and Scanning Electron Microscopy Study, http://www.optics.rochester.edu/workgroups/cml/opt307/spr06/xue/project.htm (accessed 20 September 2017).
- 38 Shim, J.U., Ranasinghe, R.T., Smith, C.A., Ibrahim, S.M., Hollfelder, F., Huck, W.T., Klenerman, D., and Abell, C. (2013) ACS Nano, 7, 5955.
- 39 Teh, S.-Y., Lin, R., Hung, L.-H., and Lee, A.P. (2008) Lab Chip, 8, 198.
- 40 Choi, K., Ng, A.H.C., Fobel, R., and Wheeler, A.R. (2012) Annu. Rev. Anal. Chem., 5, 413.
- 41 Zhu, Y. and Fang, Q. (2013) Anal. Chim. Acta, 787, 24.
- 42 Bui, M.-P.N., Li, C.A., Han, K.N., Choo, J., Lee, E.K., and Seong, G.H. (2011) Anal. Chem., 83, 1603.
- 43 Schneider, T., Kreutz, J., and Chiu, D.T. (2013) Anal. Chem., 85, 3476.
- 44 Volný, M., Rolfs, J., Hakimi, B., Fryčák, P., Schneider, T., Liu, D., Yen, G., Chiu, D.T., and Tureček, F. (2014) Anal. Chem., 86, 3647.
- 45 He, M., Edgar, J.S., Jeffries, G.D.M., Lorenz, R.M., Shelby, J.P., and Chiu, D.T. (2005) Anal. Chem., 77, 1539.
- 46 Mazutis, L., Gilbert, J., Ung, W.L., Weitz, D.A., Griffiths, A.D., and Heyman, J.A. (2013) Nat. Protoc., 8, 870.
- 47 Sun, S., Slaney, T.R., and Kennedy, R.T. (2012) Anal. Chem., 84, 5794.
- 48 Kelly, R.T., Page, J.S., Marginean, I., Tang, K., and Smith, R.D. (2009) Angew. Chem. Int. Ed., 48, 6832.
- 49 Slaney, T.R., Nie, J., Hershey, N.D., Thwar, P.K., Linderman, J., Burns, M.A., and Kennedy, R.T. (2011) Anal. Chem., 83, 5207.
- 50 Chen, D., Du, W., Liu, Y., Liu, W., Kuznetsov, A., Mendez, F.E., Philipson, L.H., and Ismagilov, R.F. (2008) Proc. Natl. Acad. Sci. U.S.A., 105, 16843.
- 51 Kaigala, G.V., Lovchik, R.D., and Delamarche, E. (2012) Angew. Chem. Int. Ed., 51, 11224.
- 52 Cors, J.F., Lovchik, R.D., Delamarche, E., and Kaigala, G.V. (2014) Rev. Sci. Instrum., 85, 034301.
- 53 Bondarenko, A., Cortés-Salazar, F., Gheorghiu, M., Gáspár, S., Momotenko, D., Stanica, L., Lesch, A., Gheorghiu, E., and Girault, H.H. (2015) Anal. Chem., 87, 4479.
- 54 Cellar, N.A., Burns, S.T., Meiners, J.-C., Chen, H., and Kennedy, R.T. (2005) Anal. Chem., 77, 7067.
- 55 Hatakeyama, T., Chen, D.L., and Ismagilov, R.F. (2006) J. Am. Chem. Soc., 128, 2518.
- 56 Zhu, Y. and Fang, Q. (2010) Anal. Chem., 82, 8361.
- 57 Shih, S.C.C., Yang, H., Jebrail, M.J., Fobel, R., McIntosh, N., Al-Dirbashi, O.Y., Chakraborty, P., and Wheeler, A.R. (2012) Anal. Chem., 84, 3731.
- 58 Fidalgo, L.M., Whyte, G., Ruotolo, B.T., Benesch, J.L.P., Stengel, F., Abell, C., Robinson, C.V., and Huck, W.T.S. (2009) Angew. Chem. Int. Ed., 48, 3665.
- 59 Yuill, E.M., Sa, N., Ray, S.J., Hieftje, G.M., and Baker, L.A. (2013) Anal. Chem., 85, 8498.
- 60 Juraschek, R., Dülcks, T., and Karas, M. (1999) J. Am. Soc. Mass. Spectrom., 10, 300.
- 61 Ogorzalek Loo, R.R., Lakshmanan, R., and Loo, J.A. (2014) J. Am. Soc. Mass. Spectrom., 25, 1675.
- 62 Heck, A.J.R. (2008) Nat. Methods, 5, 927.
- 63 Tritton, D.J. (1988) Physical Fluid Dynamics, 1st edn, John Wiley & Sons, Inc., New York.
- 64 Bird, R.B., Stewart, W.E., and Lightfoot, E.N. (1960) Transport Phenomenon, 2nd edn, Oxford University Press, New York.
- 65 Stahl, B., Linos, A., Karas, M., Hillenkamp, F., and Steup, M. (1997) Anal. Biochem., 246, 195.
- 66 Davis, F., Terry, L.A., Chope, G.A., and Faul, C.F.J. (2007) J. Agric. Food Chem., 55, 4299.
- 67 Folch, J., Lees, M., and Sloane Stanley, G.H. (1957) J. Biol. Chem., 226, 497.
- 68 Shrestha, B., Nemes, P., Nazarian, J., Hathout, Y., Hoffman, E.P., and Vertes, A. (2010) Analyst, 135, 751.
- 69 Eikel, D., Vavrek, M., Smith, S., Bason, C., Yeh, S., Korfmacher, W.A., and Henion, J.D. (2011) Rapid Commun. Mass Spectrom., 25, 3587.
- 70 Almeida, R., Berzina, Z., Arnspang, E.C., Baumgart, J., Vogt, J., Nitsch, R., and Ejsing, C.S. (2015) Anal. Chem., 87, 1749.
- 71 Amatore, C., Arbault, S., Guille, M., and Lemaître, F. (2008) Chem. Rev., 108, 2585.
- 72 Dong, Y., Heien, M.L., Maxson, M.M., and Ewing, A.G. (2008) J. Neurochem., 107, 1589.
- 73 Zhang, B., Adams, K.L., Luber, S.J., Eves, D.J., Heien, M.L., and Ewing, A.G. (2008) Anal. Chem., 80, 1394.
- 74 Snijder, B., Sacher, R., Ramo, P., Damm, E.M., Liberali, P., and Pelkmans, L. (2009) Nature, 461, 520.
- 75 Fuleki, T. (1969) J. Food Sci., 34, 365.
- 76 Nemes, P. and Vertes, A. (2012) TrAC, Trends Anal. Chem., 34, 22.
- 77 Shrestha, B. and Vertes, A. (2009) Anal. Chem., 81, 8265.
- 78 He, F., Liang, N.-N., Mu, L., Pan, Q.-H., Wang, J., Reeves, M.J., and Duan, C.-Q. (2012) Molecules, 17, 1483.
- 79 Donner, H., Gao, L., and Mazza, G. (1997) Food Res. Int., 30, 637.