
Chapter 7
Local Nucleic Acid Analysis of Adherent Cells
Aditya Kashyap, Deborah Huber, Julien Autebert and Govind V. Kaigala
IBM Research – Zurich, Säumerstrasse 4, 8803 Rüschlikon, Switzerland
7.1 Introduction
7.1.1 Heterogeneity in Cells and Their Microenvironments
Most physiological processes are consequences of cells interacting with their microenvironment to perform healthy tissue-level functions [1–4]. This microenvironment can be the surrounding extracellular matrix or different cell types constituting a tissue. Interactions within the microenvironment predominantly comprise direct physical contact [4–6], migration [7], and multimodal signal transduction [8]. Understanding and elaborating the causes and effects of such interactions require studying cells in their varying microenvironments. Spatially resolved probing of cells in their native microenvironment on biological substrates, such as complex cocultures or heterogeneous tissue sections from biopsies, is therefore fundamental to understanding cell communication, signaling, and growth.
Accuracy in molecular profiles can be achieved by probing cells spatially and at varying length scales, from a single cell to subpopulation of cells to entire tissues. Understanding cellular signaling using single-cell analysis platforms provides a way to understand the internal biochemistry of the cells through which they react to external stimuli. Thus, single-cell studies allow categorical testing of a range of stimuli, providing statistical information on the cell's individual identity.
However, a cell in its native setting is surrounded by complex cellular organization and different matrix compositions influencing the microenvironment. A single cell can recover from a stimulus with time, but the microenvironment is responsible for a sustained tissue response. In the context of cancer, for instance, tumors are often characterized by an abnormal microenvironment. Therefore, testing the effect of a drug on single cell does not provide the response representative of the tumor. To account for this, bulk tissue analysis is performed in diagnostics. More tissue material is analyzed to obtain a disease response because a treatment will be performed on populations and not on single cells. This approach is effective provided that the malignant cells in the tumor are homogeneously distributed. With a fairly heterogeneous tissue, both approaches are impractical. Therefore, we need to develop flexible strategies to spatially probe cells in their native microenvironment at different length scales. Moreover, these strategies also need to be flexible for multimolecular probing to address sample scarcity.
The completion of the human genome project and the corresponding increase in detail of unique RNA transcripts in bioinformatics databases have led to advancements that allow early detection and targeted treatment for a range of diseases. On the protein level, aside from their direct impact on cellular functions, modifications caused by genomic and transcriptomic mutations may, in effect, lead to new functions in cells and tissues. Information on nucleic acids (NA) (DNA and RNA) is traditionally gleaned from samples that are homogenized prior to analysis. If that sample is heterogeneous, such an analysis leads to a loss of local information where accuracy is sacrificed in favor of having higher quantities of the NA. The local information obtained on the NA would provide information at the code and expression level, thus providing context and new insights into a heterogeneous biological sample.
Methods to interrogate NA also have to be performed at multiple scales. In situ hybridization (ISH) methods (Box 7.1) are used to determine aberrations at the chromosomal level – translocations, fusions, and deletions. Somatic and spontaneous mutations at the DNA level, gene expression profiles, and splicing variations at the mRNA level are usually studied by means of amplification-based NA sequencing and quantification (Box 7.2). To obtain a comprehensive profile, it is therefore necessary to integrate methods at these distinct levels. In this chapter, we focus on methods that exploit the microfluidic probe (MFP) technology to locally analyze NA. We present two MFP-based approaches [9, 10] for:
- 1. Local fluorescence in situ hybridization (µFISH) for detection of chromosomal aberrations
- 2. Local cell lysis and sampling (Spatialyse) for DNA quantification and profiling
- 3. Local cell lysis and sampling (Spatialyse) for mRNA quantification and relative gene expression studies
7.2 State of the Art: Microfluidic Devices for Nucleic Acid Analysis
To obtain complete molecular profiles from biological samples, strategies have to be developed that enable the analysis of cells in culture locally and in situ. An ideal technology for spatial probing should be local, noninvasive, aqueous based, flexible, and interactive. A few microfluidic technologies [15–21] have achieved several of these positive traits for local NA analysis of cells, but do not have all the necessary attributes to perform spatially resolved probing. For clarity, we classify the current technologies into those that present the biological substrate to the device [15, 16] and vice versa [17].
The substrate-to-device category includes flow cytometric methods and lab-on-a-chip platforms that flow and analyze cells in channels [18, 19]. In the context of methods for in situ analysis of cells using hybridization probes (ISH), microfluidic platforms have been developed for automated analysis [22, 23] and to increase throughput [24], for instance. Within such platforms, interphase FISH has been integrated with a range of analytical techniques, such as flow cytometry [25], chemistrode [26], Förster resonance energy transfer (FRET) [27], and immunostaining [28]. These methods have been used for the analysis of specific chromosomal translocations within spread metaphases on slides [29, 30], prenatal diagnostics [31], and the analysis of circulating tumor cells [32–34] and cancer malignancies [35–37]. In the context of methods for DNA/RNA analysis of cells, microfluidic platforms have been integrated with qPCR, rtPCR [38], RNAseq [39], and mass cytometry [40]. These methods have been used to study transcriptional heterogeneity in colon cancer [41] as well as genetic and functional diversity in glioblastoma [38] and have been integrated with mass cytometry to study myeloma [40], for instance. Limitations of such substrate-to-device approaches include difficulties in handling native biological substrates, complex culture conditions, and long assay times owing to diffusion-based transport of the biomolecules being investigated.
The device-to-substrate category includes devices that either use microfluidic channels directly affixed over a biological substrate [42, 43] or selectively scan and process native biological substrates without physical contact [20, 21, 44]. HistoFlex [42], for example, implements localized and multiplex RNA FISH by placing an elastomeric lid patterned with microfluidic channels on tissue sections and then flowing reagents over certain cells. The microfluidic tissue processor Lunaphore [43] uses microfluidic capillary networks on glass–silicon devices to expose underlying tissues to multiple biochemicals. However, these approaches are not flexible in adapting to morphological variations on samples. Scanning devices that function directly over biological surfaces have been developed to overcome this particular challenge and are especially useful for local sampling and analysis. Examples of such devices are microfabricated hollow cantilevers, such as FluidFM [20, 45], and platforms that use laser-based ablation for laser capture microdissection (LCM) [21, 46]. FluidFM does not confine chemicals on a substrate and can either inject or aspirate a given chemical, thereby decoupling treatment and sampling. The LCM-based sampling method for adherent cells requires culture on specialized substrates as well as specialized training. Another approach that localizes liquid on a substrate is the chemistrode [44], which confines the processing chemical using a multiphase system, albeit with direct physical contact between probe and substrate.
7.3 Microfluidic Probe for Spatial Probing of Standard Biological Substrates
The MFP technology relies on microfabricated heads and platforms for localizing liquids on biological surfaces using hydrodynamic flows and enables handling, analyzing, and interacting with native biological samples [47–49]. Liquid localization is implemented by simultaneous injection and aspiration of a processing liquid, a principle termed hydrodynamic flow confinement (HFC). The locally confined processing liquid interacts with the biological substrate without the probe physically contacting the substrate, making this approach nondestructive to the surrounding sample. Local confinement of the liquid over the biological substrate increases the number of spatially resolved investigations that can be performed on the same sample. The spatial resolution is dictated by the dimensions of the microchannels and the microfluidic technique that defines the shape of the confined liquid [50]. Control over spatial resolution enables the MFP to probe substrate properties at varying levels of complexity, for example, probing single cells or hundreds of cells simultaneously for their molecular characteristics. In addition, real-time visual feedback of substrate processing allows the user to adapt the operating conditions of the MFP, for example, the probe-to-surface distance, coordinates of the probe on the substrate, and flow rates. This provides the user with a high degree of control and flexibility while operating on delicate biological substrates. The MFP and its variants have been used for patterning protein microarrays and complex chemical gradients [47, 51], patterning DNA on surfaces [50], performing micro-immunohistochemistry of tissue sections [52], local perfusion of brain slices [53], single-cell pharmacology [54], probing enzyme activity [55], and studying cell interactions in monocultures for mRNA analysis [56].
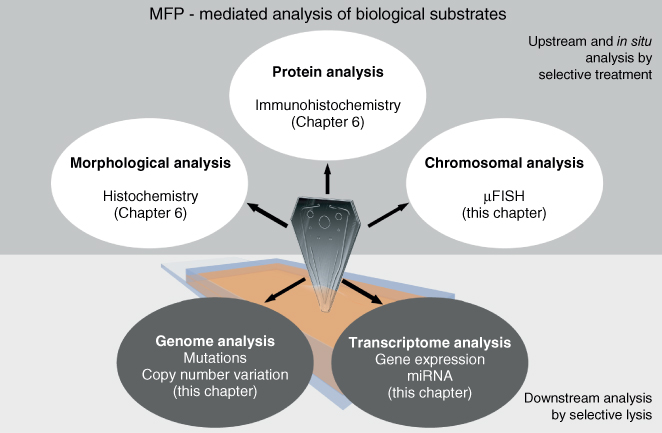
Figure 7.1 Multimodal analysis of biological samples using MFP-mediated selective treatment and lysis.
In this chapter, we exploit a particular variant of the MFP, namely, the vertically oriented MFP [48], to perform µFISH and selective spatial sampling of cells from adherent cultures for NA analysis. We implement hHFC [50], in which we simultaneously confine multiple liquids on a substrate for locally processing biological substrates. In µFISH, we incubate FISH probes on selected areas on a cell monolayer to perform localized FISH. For DNA and mRNA profiling, we obtain lysates by locally and rapidly lysing cells using the inner confinement of the hHFC while shielding the sampled lysate from the surrounding sample using an outer confinement (Chapter 2).
Using both approaches in concert provides a method for both identification and retrieval of analytes (Figure 7.1). The body of methods described in this chapter and the preceding chapters enables rapid overall workflows for accurate and comprehensive NA analysis of heterogeneous biological substrates.
7.2 Methods
7.2.1 MFP Platform, Head, and Handling
The standard MFP platform includes motorized scanning stages, peripherals for liquid handling, and a microfabricated head. This platform is placed on top of an inverted microscope for real-time observation.
The microfabrication of the silicon–glass head and the associated platform have been described elsewhere [48] and also in Chapters 1 and 2. The heads used for the experiments described in this chapter have channels having dimensions of 200 × 100 µm2 (forming the outer apertures), 100 × 100 µm2 (forming the inner apertures), and 500 × 100 µm2 (forming the immersion channels), with 100 µm spacing between apertures (Figure 7.2).
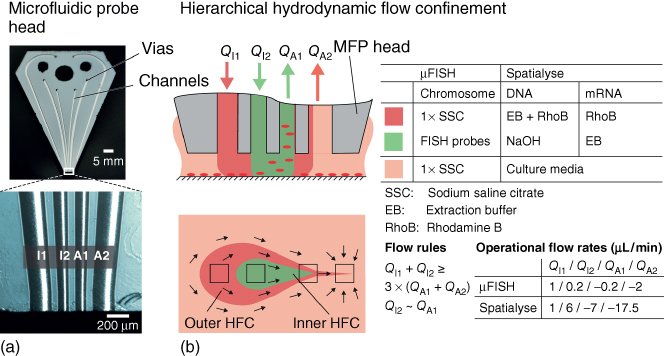
Figure 7.2 Operational parameters and liquid handling for local nucleic acid analysis using the MFP. (a) Photograph of an MFP head. (b) Scheme showing the use of hHFC to confine solutions required for µFISH and cell lysis.
During operation, the vias in the head were connected to liquid-handling peripherals, which include pumps (neMESYS, CETONI GmbH, Korbussen, DE), syringes (Hamilton 1705 TLLX, Bonaduz, CH), and associated tubing and connectors (Upchurch Scientific, IDEX Health & Science LLC, Oak Harbor, WA, USA) providing the required fluid flow. The high-precision motorized stage (LANG GmbH, Hüttenberg, DE) was connected to the head holder, thereby allowing precise movement in the three axes. Zero leveling was done as described in the literature [48] and in Chapter 1 using a glass slide, and the MFP was scanned during hHFC operation at a height of 30–50 µm above the substrate.
The µFISH platform [9] was mounted atop the stage of an inverted microscope (Nikon Ti-E with objectives Plan Fluor 10×, Plan Fluor 40×, and Plan Fluor 60×) equipped with a camera (ORCA-Flash4.0 camera). An environmental chamber (Life Imaging Services GmbH, “The Cube and the Box”) enclosed the µFISH platform and the microscope. The Spatialyse platform [10] was mounted atop the stage of an inverted microscope (Nikon Eclipse TE300 with objectives Plan Apo 4× and Plan Apo 10×) equipped with a camera (Nikon DS-Fi2 CCD). A 3D printed sampling station comprising a PCR tube holder (eight tubes) was mounted to the edge of the substrate holder to allow direct purging of the sample into tubes after lysis on the cell culture to introduce the sample into PCR workflow.
7.2.2 Cell Handling
Human breast cancer cell lines MCF7 (HTB-22) and MDA-MB-231 (HTB-26) were purchased from ATCC, cultured in T75 flasks, and treated according to supplier's recommendations.
For µFISH experiments, MCF7 cells at 0.1 M cells/cm2 were seeded onto four chamber slides (CS4) (Fisher Scientific, Reinach, CH) and cultured over 2 days prior to the experiment. The monolayer was washed with phosphate-buffered saline (PBS) (pH 7.4, Thermo Fisher Scientific, MA, USA) and heat immobilized at 82 °C for 2 min. Next, the cells were rinsed with PBS and digested using pepsin (Leica Biosystems, Muttenz, CH) at 37 °C for 8–10 min. Then, they were rinsed with 2× saline-sodium citrate (SSC) and fixed using Carnoy's fixative (ethanol–acetic acid 3 : 1 (v/v), Sigma-Aldrich Chemie GmbH, Buchs, CH) at 4 °C for 40 min. Finally, the cells were dried for 5 min at room temperature (RT), washed twice with 2× SSC for 1 min, and finally renatured in 2× SSC at 37 °C for 20 min.
For DNA profiling experiments, MCF7 cells at 0.1 M cells/cm2 (in 1 mL of DMEM) were seeded onto two chamber slides (CS2) (Fisher Scientific, Reinach, CH) and cultured over 2 days prior to the monoculture experiments. The live/dead viability/cytotoxicity kit for mammalian cells (Thermo Fisher Scientific, MA, USA) was used to visualize the lysis of viable cells. The concentrations were in line with the manufacturer's instructions. 10 µM of CellTracker Green (CMFDA) in DMEM can also be used to visualize local lysis.
For mRNA profiling from coculture experiments, the protocol described by Javaherian et al. [57] was modified (Figure 7.5a). The CS2s were first selectively blocked for half the culture area with 0.5% (w/v) BSA by incubating them over an angular support at 37 °C for 2 h in a humidified incubator. MCF7 cells were seeded at 0.5 M cells/cm2 (in 500 µL of DMEM) on the selectively blocked CS2s, and the cells were left to sediment for 100 min. The cultured surface was then gently washed, resulting in delamination of the unbound cells on the blocked half of the CS2s. The blocked region was then reactivated by incubating with 50 µg/mLfibronectin from bovine plasma (Sigma-Aldrich Chemie GmbH, Buchs, CH) for 30 min. Post-reactivation, the MCF7s on the CS2 were cultured overnight in complete DMEM. MDA-MB-231 in T-flasks and the MCF7s contained in the CS2 were then labeled using 10 µM CMRA and CMFDA dyes in DMEM for 45 min. The CMRA-labeled MDA-MB-231 was then harvested from the T-flasks, seeded at 2 M cells/mL (in 500 µL complete DMEM) into the CS2 containing CMFDA-labeled MCF7s, and incubated for 180 min. Finally, the CS2s were washed to remove unbound cells and cultured for 2 days.
7.2.3 µFISH Protocol
The compartments of the chamber slides were removed, the cells immersed in 10 µL FISH buffer and sealed with a coverslip, and the chromosomes denatured at 75 °C for 5–10 min in FISH buffer. 5 µL FISH mix (1 µL FISH probes in 4 µL FISH buffer) was denatured separately at 75 °C for 5 min in a PCR tube (VWR, Dietikon, CH). Hoechst dye was added to the probes at a concentration of 0.2 µg/mL (Thermo Fisher Scientific, MA, USA). These probes were pipetted onto a sheet of parafilm and aspirated into the inner aperture (I2) of the head. Concurrently, the coverslip was removed from the chamber slide, and the cells were immersed in 1 × SSC. The chamber slide was then transferred to the sample holder of the MFP platform, and the head positioned ![]() above the monolayer. To establish an hHFC, the flow rules are conventionally set to be
above the monolayer. To establish an hHFC, the flow rules are conventionally set to be ![]() and
and ![]() . To account for the viscous FISH probes in the processing liquid, flow rates were set to 1, 0.2 µL/min (QI1, QI2), and
. To account for the viscous FISH probes in the processing liquid, flow rates were set to 1, 0.2 µL/min (QI1, QI2), and ![]() ,
, ![]() (QA1, QA2) (Figure 7.2b).
(QA1, QA2) (Figure 7.2b).
The probes were injected from I2, and 1 × SSC is injected from I1. Aspiration of probes and injection of 1 × SSC were performed from A1 and A2, respectively. After 10 min of the cells interacting with the hHFC (equivalent to 10 min incubation), QI2 and QA1 were stopped, and the cells were washed with 1 × SSC flowing between the outer apertures for 2 min (QI1 and QA2). The head was then positioned away from the slide before imaging.
For multiplexing, the head was positioned away from the substrate after the first probe hybridization wash, and 20 µL of 1 × SSC was purged from A1 and I2, and 50 µL from A2 and I1, to avoid cross-contamination of the different probes used. Subsequently, the probe loading procedure explained earlier was repeated. Buffer (KBI-FHB) and centromeric probes with a PlatinumBright 550 dye (KBI-20017R and KBI-20007R) were purchased from Leica Biosystems, Muttenz, CH. These cells with the probes were coverslipped (Menzel, Braunschweig, DE) .
7.2.4 Local Lysis and Sample Retrieval Protocol
All experiments described use the hHFC [50] with flow rates of 1, 6, −7, and ![]() for the I1, I2, A1, and A2 channels, respectively. The flow rates were chosen in line with the flow rules described in Figure 7.2.
for the I1, I2, A1, and A2 channels, respectively. The flow rates were chosen in line with the flow rules described in Figure 7.2.
50 mM NaOH was used as processing liquid for the local lysis of cells with the MFP. The shielding solution used for these experiments was 10 µM rhodamine B, 0.5% Tween 20, 1 mM EDTA, and 10% proteinase K in 50 mM Tris at pH 8 (extraction buffer (EB)).
For the DNA analysis studies, 50 mM NaOH was used as processing liquid and EB as the visualization/shielding liquid. Multiple footprints were sampled in 23 µL, and the lysate was collected by purging it into the cap of a 200 µL PCR tube through A1.
For the local RNA analysis studies, EB without rhodamine B was used as the processing liquid and a 10 µM solution of rhodamine B as the shielding/visualization solution. Collected lysate ![]() was purged directly into a 200 µL PCR tube. The RNA was then isolated from the lysate using the RNeasy Plus Micro Kit (Qiagen, Hilden, DE) according to the manufacturer's protocol in 12 µL RNase-Free Water.
was purged directly into a 200 µL PCR tube. The RNA was then isolated from the lysate using the RNeasy Plus Micro Kit (Qiagen, Hilden, DE) according to the manufacturer's protocol in 12 µL RNase-Free Water.
7.2.5 DNA and RNA Quantification
DNA quantification from local lysates was performed using qPCR. The NaOH lysates were first boiled at 95 °C for 10 min and then neutralized using 1 : 1 50 mM tris-Cl at pH 8. The lysate was directly introduced as the template for qPCR. This method leads to high yields of DNA by circumventing the use of column-based isolation. qPCR used in the work described here was performed on the Rotor-Gene Q thermocycler platform in combination with the Rotor-Gene SYBR Green Kit (Qiagen, Hilden, DE) for genomic β-actin using forward primer TCCCTGGAGAAGAGCTACGA and reverse primer AGCACTGTGTTGGCGTACAG, leading to a 194-bp product.
The cycling conditions used were an initial activation step (95 °C for 5 min) followed by 35 cycles of denaturation (95 °C for 5 s) and a combined annealing/extension (60 °C for 10 s). Reaction contents included 50% of 2× master mix, 1 µM of primers, and 4 µL of the lysate in a reaction volume of 20 µL. Standard curves for the DNA were obtained for a serial dilution of 10 pg to 10 ng of DNA isolated from cultured MCF7. All samples were run in triplicate.
Extracted lysates were normalized for relative quantification by using a single MFP footprint extraction lysate with every multi-footprint extraction lysate (5, 10, and 15 footprints in different experiments). All MFP extractions were run in triplicate, and stated errors were standard deviation with ![]() for the various footprints.
for the various footprints.
Relative quantification of E-cadherin expression (CDH1) on the isolated RNA from selective lysates of MCF7 and MDA-MB-231 MFP was performed by rtPCR on the Rotor-Gene Q platform in combination with Rotor-Gene Probe PCR mix (Qiagen, Hilden, DE). PrimeTime mixes from Integrated DNA Technologies (IDT, Iowa, USA) for probe-based rtPCR of CDH1 and ActB were purchased and resuspended to a 20 × stock, which contains ready mixes of probes, forward and reverse primers. The sequences are available on the manufacturer's website.
The cycling conditions consisted of a reverse transcription step (50 °C for 10 min) followed by the standard two-step cycling PCR as describe earlier. Reaction contents included 50% 2 × Rotor-Gene Probe rtPCR Master Mix, 5% PrimeTime stock mix (CDH1 or ActB), 1% Rotor-Gene RT mix, and 2 µL RNA sample in a 20 µL reaction volume.
The relative quantification was performed by the 2ΔΔCt method [58] using the Rotor-Gene Q software provided with the machine, with β-actin (ActB) expression as the normalizing housekeeping gene and expression of MDA-MB-231 cultured in T-flasks as the calibrator.

Figure 7.3 Chromosomal analysis using µFISH with the MFP. (a) Schematic of singleplex and multiplex FISH using the MFP. (b) Micrograph of cells being incubated with FISH probes (left) and footprints of hybridization after multiplex µFISH (right). Nuclei were stained with Hoechst dye during the assay. (c) Post-incubation results for (i) singleplex and (ii, iii) multiplex µFISH.
7.3 Results
7.3.1 Genomic Analysis
7.3.1.1 Study of Chromosomal Characteristics of Adherent Cells Using µFISH
We performed the sequence-specific hybridization of cells with FISH probes, a key step in FISH, using an MFP. As the model system, we used an immobilized MCF7 cell monolayer and the centromeric FISH probes (satellite enumeration probes) CEP7 and CEP17 to visualize chromosome 7 and 17, box 1. Centromere-specific probes are used in diagnostics, for example, in the assessment of the HER2 status in breast cancer cells. CEP17 probes are used to normalize the ERBB2 gene to the chromosome 17 counts. A selected subset of cells in the monolayer were incubated with probes (Figure 7.3a). We confined the probes within a footprint (region of the cells that interact with the processing liquid) covering ∼1000 cells and ∼0.096 mm2. We detected a FISH signal in this subpopulation of cells and found no detectable signal beyond this footprint. In contrast, in conventional FISH, the entire monolayer is covered with probes during the incubation step.
7.3.1.2 Operational Parameterization for µFISH
In basic operation of the MFP, a processing liquid is injected through one aperture and then along with the immersion liquid aspirated via another aperture at a higher flow rate (e.g., ![]() ). In contrast, the hHFC [50] (Figure 7.2) uses two injection (I1 and I2) and two aspiration (A1 and A2) apertures to confine two liquids on the substrate. Therefore, the outer HFC nests and confines the processing liquid in the inner HFC, thereby shielding the sample surrounding the hHFC from the processing liquid.
). In contrast, the hHFC [50] (Figure 7.2) uses two injection (I1 and I2) and two aspiration (A1 and A2) apertures to confine two liquids on the substrate. Therefore, the outer HFC nests and confines the processing liquid in the inner HFC, thereby shielding the sample surrounding the hHFC from the processing liquid.
A specific challenge to implement µFISH with the MFP is the viscosity of the probe mix. The high viscosity is largely caused by dextran sulfate, which serves to increase the effective probe concentration and consequently improves the hybridization efficiency [59]. Localizing this viscous probe mix with the MFP brings with it two important considerations: shear on the biological substrate and stability of the confinement. The localization of a liquid by HFC at the apex of the head is due to the nonsymmetric flow rates between injection and aspiration, as described earlier. This interaction of the localized viscous processing liquid exerts increased shear (shear increases linearly as a function of viscosity), which leads to delamination of the cell monolayer. We used an hHFC configuration that allowed symmetric flow rates between the injection and aspiration ports for the FISH probes. To prevent delamination of cells, we operated the MFP at 0.2 µL/min, the lowest flow rate permitted by our fluidic system. At these flow rates, we increased the injection and aspiration flow rates of the shaping liquid (QI1, QA2) to ensure stable confinement of viscous processing liquid. By operating the MFP under these conditions, we were able to confine the FISH probes on MCF7 cells without any cell delamination even during extended incubation time >2 h.
7.3.1.3 Improved Probe Incubation and Consumption Using µFISH
A useful attribute of the MFP-based µFISH [9] implementation is the capability to observe the evolution of the FISH signal in real time. We observed centromere-specific FISH signals within 3 min of initiating the probe incubation step with the MFP, which is approximately a 120-fold reduction of the incubation time recommended by the probe supplier (>6 h). This 3 min incubation translates into a probe consumption of 0.6 µL with QI2 of 0.2 µL/min. Up to 16 slides can be processed using our device, with 3 min incubation each and a total volume of 10 µL FISH probes, which is the volume used in conventional FISH for a single slide. Moreover, we compared the FISH signals under three different conditions: (i) conventional FISH with 8 h incubation, (ii) conventional FISH with 10 min incubation, and (iii) µFISH with 10 min incubation. We observed that the µFISH results with 10 min MFP-based incubation were better (higher intensity of spots and lower background) than those for 10 min of conventional incubation and comparable with those of 8 h of conventional incubation. We hypothesize that the reduced incubation time is largely due to the continuous replenishment of the FISH probe mix on the cell monolayer. In contrast, in conventional FISH, the probes diffuse overnight on top of the cells, resulting in a depletion layer, further lowering the concentration of probes accessing the cells.
Using the MFP-based FISH implementation, we independently also observed a significant reduction in the cell rinsing time compared with conventional rinsing. We substituted a single rinsing step for conventional rinsing methods comprising three 6 min steps and buffers containing detergents. We stopped the flow of FISH probes between the inner two apertures after probe incubation and continue flowing the shaping liquid between the outer apertures (SSC). This continuous flow of SSC removes unbound probes within 1 min of rinsing, resulting in a very low background. Efficient rinsing with the MFP obviates the use of such detergents, thereby leaving the cytoskeleton minimally affected, which might be critical in certain applications, and eliminates the need for further manual manipulations of the cells prior to optical inspection.
7.3.1.4 µFISH Allows for Spatial Multiplexing of Probes
Spatially multiplexed µFISH is particularly relevant for sequentially resolving multiple targets adjacent in a biological sample. We chose two probes (CEP7 and CEP17), and incubated one probe after the other, on two distinct areas on the MCF7 cell monolayer (Figure 7.3b and c). The footprints chosen were spaced by ∼200 µm, and the cells in both areas were incubated for 10 min with CEP7 and CEP17 probes, respectively. The dyes on the CEP7 and CEP17 probes were spectrally equivalent. We obtained comparable results for µFISH signals with 10 min MFP-based incubation and for multiplex µFISH results with 10 min MFP-based incubation. In practice, with spatially multiplexed µFISH, it may now be possible to multiplex a large number of FISH probes on a single substrate in order to probe different regions across heterogeneous tissue samples. Moreover, because of the precise localization of the FISH signal, spectrally equivalent probes can be used for multiplex analysis, whereas in conventional FISH, probe dyes have to be spectrally distinct. Thus, in multiplex µFISH, a low-cost, mono-wavelength imaging device can now potentially be used.
7.3.1.5 Selective Local Lysis for DNA Analysis Using the MFP (Spatialyse)
High-resolution molecular analysis of NA requires extraction of the analytes from the nuclei of cells. In Spatialyse, we use cell lysis to free the NA from their respective cell compartments. The quality of the NA isolated is affected by the method used to extract them from cells. We identified four imperatives that need to be fulfilled when adapting standard extraction methods for use with the MFP. The method should (i) not denature the NA, (ii) not adversely affect the yield of the NA, (iii) be compatible with the analysis workflow, and (iv) allow selective lysis and sampling of cell subpopulations. To address the aforementioned requirements, we investigated the interaction of hHFC with cells, chemical systems for local lysis, and the downstream analysis of NA in the context of using the MFP for local lysis.
7.3.1.6 Operational Parameterization and Liquid Handling for Spatialyse
Standard operation of an HFC requires a higher aspiration flow rate (i.e., ![]() ) (see Chapter 2). Implementing the HFC in this configuration for lysing and sampling purposes results in the dilution of the lysate retrieved. This dilution impedes the action of the chemical agents used for lysing the cells in the aspirate.
) (see Chapter 2). Implementing the HFC in this configuration for lysing and sampling purposes results in the dilution of the lysate retrieved. This dilution impedes the action of the chemical agents used for lysing the cells in the aspirate.
In contrast, with the hHFC, the nesting of liquids relaxes the requirement of a higher aspiration flow rate in the inner aspiration aperture (A1), allowing nearly equal injection and aspiration flow rates (i.e., ![]() ), therefore providing an optimal flow strategy for local sampling. In the context of such local sampling, the chemical components of the hHFC have multiple functions. The processing liquid injected from I2 is the component of the hHFC that performs cell lysis, whereas the shaping liquid injected from I1 shields the processing liquid from collecting cell debris from beyond the hHFC. Note that the continuous flow of the processing liquid, which is inherent to the hHFC, enables simultaneous lysis and sample collection.
), therefore providing an optimal flow strategy for local sampling. In the context of such local sampling, the chemical components of the hHFC have multiple functions. The processing liquid injected from I2 is the component of the hHFC that performs cell lysis, whereas the shaping liquid injected from I1 shields the processing liquid from collecting cell debris from beyond the hHFC. Note that the continuous flow of the processing liquid, which is inherent to the hHFC, enables simultaneous lysis and sample collection.
Local cell lysis depends on multiple parameters, for example, the time spent by the processing liquid in contact with cells, the chemical system (see next paragraph), and the flow velocities. These parameters are coupled, and here we discuss their contribution in the context of local lysis. We define the time spent by the processing liquid interacting with the adherent cells causing complete cell lysis as the residence time (TR). TR strongly depends on the choice of lysing chemicals. For example, trypsin, often used to detach adherent cells from culture, is a weak lysing agent and would lead to higher TR. As expected, TR also depends on the flow velocities: a lower flow velocity results in lower shear on the cell surface and therefore a higher TR. However, in the context of the lysate concentration, the higher the TR, the larger is the sample collection volume and the lower the lysate concentration. There is a trade-off between the flow rates and the lysing chemical to obtain concentrations of the NA that can be analyzed. To establish operational parameters, we investigated these coupled parameters using MCF7 cells monolayers as a model system.
To obtain DNA that can be used for quantitative analysis using qPCR, we adapted the heat-induced alkaline retrieval method [60]. This method uses sodium hydroxide (NaOH) to simultaneously extract and lyse cultured cells. NaOH facilitates lysis by locally changing the pH on the cells, thus denaturing cellular components, leaving the DNA intact. However, denaturation of proteins using NaOH leads to a slurry, which can cause perturbations in the hHFC. Therefore we choose the flow rates such that the lysate is primed with a small volume of EB containing proteinase K (provided by channel I1), resulting in digestion of the slurry in the lysate. A NaOH concentration of 50 mM was determined empirically for the lysate to be compatible with direct PCR loading.
We chose the flow rates considering the tradeoffs between the flow velocity on the cell monolayer, the dilution, TR, and practicality of operating the hHFC for sampling. The flow confinement is minimally perturbed when the aspiration rates in each aspiration aperture are between 3 and 20 µL/min. A NaOH injection flow rate (QI2) of 6 µL/min was considered suitable for continuous operation because higher flow rates yielded only an incremental improvement in TR.
The TR needed for lysis of a single footprint can be used to characterize the interaction of different NaOH concentrations with cells. To establish this TR, we injected processing liquid with 10, 25, and 50 mM NaOH to lyse MCF7 cells. During lysis, we scanned the probe over the monolayer at exponentially increasing velocities from 1 to 1000 µm/s. The scanning velocity inversely correlates with TR. An exponential velocity profile allowed the use of a range of velocities over short distances to establish the TR for complete local lysis.
We obtained suitable local lysis of cells using 50 mM NaOH as the processing liquid, for which TR and veff were 16.9 s and 70 µm/s, respectively [10]. Subsequently, we used a TR of 20 s to address sample-to-sample variations. For this TR, the lysate volume aspirated in channel A1 for a single footprint is 2.3 µL (i.e., ![]() ). This 2.3 µL lysate can be used as sample for PCR-based DNA quantification. Collecting the lysate in such small volumes ensures a high concentration of DNA. The use of DNA isolation methods (e.g., column-based purification) would significantly affect the DNA recovery yield. We therefore circumvent the need for DNA isolation methods by performing crude boiling of the high-pH lysate and using the neutralized lysate as sample for the qPCR. This ensures that low-concentration artifacts are avoided during analysis because the concentration of retrieved DNA is orders of magnitude higher than the sensitivity of the PCR method.
). This 2.3 µL lysate can be used as sample for PCR-based DNA quantification. Collecting the lysate in such small volumes ensures a high concentration of DNA. The use of DNA isolation methods (e.g., column-based purification) would significantly affect the DNA recovery yield. We therefore circumvent the need for DNA isolation methods by performing crude boiling of the high-pH lysate and using the neutralized lysate as sample for the qPCR. This ensures that low-concentration artifacts are avoided during analysis because the concentration of retrieved DNA is orders of magnitude higher than the sensitivity of the PCR method.
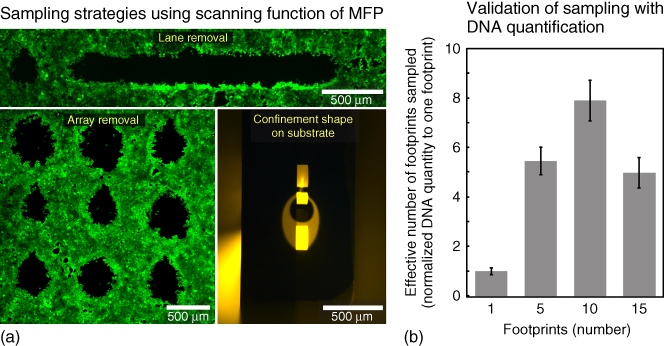
Figure 7.4 Sampling versatility and quality of extracted DNA using selective cell lysis. (a) Fluorescence micrograph of adherent cell layer processed for array and lane cell lysis. (b) Quantity of DNA from extracted cells in a fixed volume quantified by qPCR. ( ; error bars show standard deviation).
7.3.1.7 Quantitation of DNA in Local Lysate
We sampled multiple footprints (5, 10, and 15), with ∼400 cells in each footprint from an MCF7 confluent cell layer (Figure 7.4a). We specifically analyzed the DNA quantity in the lysate using qPCR for the β-actin gene. A 23 µL lysate (![]() at 7 µL/min aspiration) was collected and quantified from each multi-footprint sample. In these extractions, the TR per footprint is varied and corresponds to 40, 20, and 13 s for 5, 10, and 15 footprints, respectively. Experimental controls were extracted between each multi-footprint sampling by residing the probe on “holes” on the monolayer, which are previously lysed spots. These negative controls showed negligible DNA quantities in all experiments.
at 7 µL/min aspiration) was collected and quantified from each multi-footprint sample. In these extractions, the TR per footprint is varied and corresponds to 40, 20, and 13 s for 5, 10, and 15 footprints, respectively. Experimental controls were extracted between each multi-footprint sampling by residing the probe on “holes” on the monolayer, which are previously lysed spots. These negative controls showed negligible DNA quantities in all experiments.
Each multi-footprint (5, 10, or 15) sampling was performed concomitantly with a single-footprint extract ![]() on a given monolayer for normalization. The effective number of footprints for the multi-footprint extracts was calculated as a multiple of the single-footprint extract using their respective absolute DNA quantities (mass). DNA quantities increased, as expected, between 1, 5, and 10 footprints, but dropped for 15 footprints (Figure 7.4b). The quantity was lower for 15 footprints owing to incomplete lysis of cells in each footprint because of suboptimal TR.
on a given monolayer for normalization. The effective number of footprints for the multi-footprint extracts was calculated as a multiple of the single-footprint extract using their respective absolute DNA quantities (mass). DNA quantities increased, as expected, between 1, 5, and 10 footprints, but dropped for 15 footprints (Figure 7.4b). The quantity was lower for 15 footprints owing to incomplete lysis of cells in each footprint because of suboptimal TR.
The quantity of DNA obtained from 10 footprint extracts was comparable with the expected quantity (![]() from 1 footprint), which corroborates a TR of 20 s. We manually counted the cells in 10 footprints prior to local lysis and obtained
from 1 footprint), which corroborates a TR of 20 s. We manually counted the cells in 10 footprints prior to local lysis and obtained ![]() cells in each footprint. qPCR quantification of these 10 footprints led to a DNA equivalent of
cells in each footprint. qPCR quantification of these 10 footprints led to a DNA equivalent of ![]() cells/footprint and a 83.2 % DNA recovery yield.
cells/footprint and a 83.2 % DNA recovery yield.
The quality and quantity of DNA obtained suggest that (i) the collected lysate contains only the sampled footprints evidenced by the varying quantities of DNA obtained in a fixed volume, (ii) the DNA collected can be amplified and quantified, and (iii) the sampled quantity can be varied based on the requirements of the downstream process.
7.3.2 Transcriptomic Analysis
7.3.2.1 Spatially Resolved Probing of Gene Expression in Adherent Cocultures
Local cell lysis for mRNA extraction requires an adaption of the chemical system compared with the chemical system used for DNA because a high pH affects the quality of mRNA. Here we used the EB containing a combination of detergent (Tween® 20), a chelating agent (EDTA), and a broad-spectrum protease (proteinase K). With an extended TR, this solution allows dissolution of the cell membrane, protein digestion, and detachment of the exposed cells but keeps the NA intact. The lysate was then introduced into columns for isolation and purification of RNA.
To validate local and selective lysis using this chemical system and the quality of the isolated mRNA, we demonstrate lysis of individual cell types in a coculture of cells with variant expression of a gene. Two phenotypically distinct breast ductal carcinoma cell lines – MCF7 and MDA-MB-231 – were chosen for the coculture. MCF7 is known to be weakly tumorigenic and migratory in vivo with an overexpression of the cell–cell interaction protein E-cadherin (CDH1 gene), whereas MDA-MB-231, a strongly tumorigenic and migratory cell line, has a more mesenchymal phenotype with a marked underexpression of CDH1. We modified a coculture method developed by Javaherian et al. [57] to obtain a stable coculture interface (Figure 7.5a) of the two cell types.
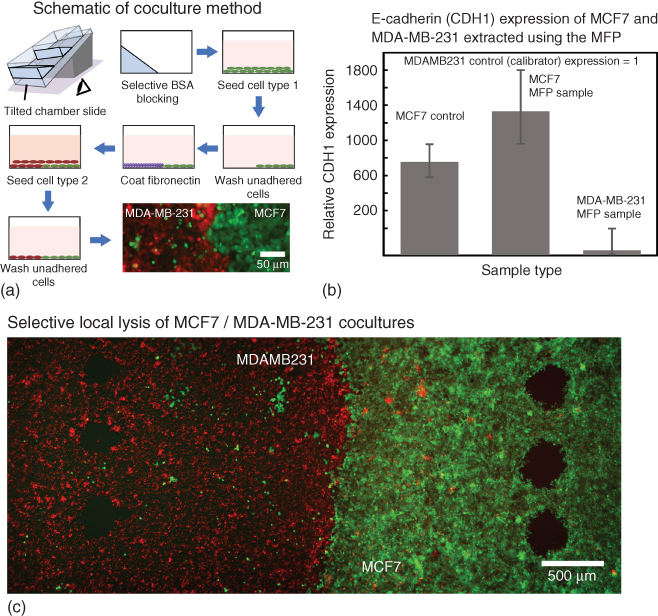
Figure 7.5 Selective cell lysis and sampling of heterotypic cell cultures for gene expression analysis. (a) Scheme of steps to generate a coculture of MCF7 and MDA-MB-231. (b) Representative graph of gene expression in the selectively sampled cells showing a higher E-cadherin (CDH1) expression of MCF7 than in MDA-MB-231 ( ; error bars show standard deviation). (c) Image of the cocultured substrate post-MFP-based selective sampling of MCF7 (green) and MDA-MB-231 (red).
Five footprints (∼2000 cells) were locally lysed and sampled from each cell type on the substrate ![]() in 150 µL
in 150 µL ![]() (Figure 7.5c). Experimental controls were extracted between each five-footprint sampling by residing the probe on an already sampled spot on the coculture substrate. RNA was isolated using column-based extraction for each selective lysate, and the sample was introduced as template for rtPCR for CDH1 with β-actin as the normalizing housekeeping gene
(Figure 7.5c). Experimental controls were extracted between each five-footprint sampling by residing the probe on an already sampled spot on the coculture substrate. RNA was isolated using column-based extraction for each selective lysate, and the sample was introduced as template for rtPCR for CDH1 with β-actin as the normalizing housekeeping gene ![]() . mRNA was also isolated from monoculture to provide the required controls and calibrators. We were able to obtain a lysate of about 13 cells/µL prior to RNA reconcentration and isolation using column-based purification.
. mRNA was also isolated from monoculture to provide the required controls and calibrators. We were able to obtain a lysate of about 13 cells/µL prior to RNA reconcentration and isolation using column-based purification.
We observed a 1000-, 1400-, and 50-fold overexpression of CDH1 in MCF7 in monoculture, MFP extracts of MCF7 and MDA-MB-231, respectively, normalized with the expression in MDA-MB-231 monoculture (calibrator) (Figure 7.5b). The controls showed negligible amplification of the gene. The expression profiles obtained for different cell types validate the quality of the mRNA and the presence of individual cell types in the lysate.
7.4 Discussion
Molecular biology assays that aim at probing molecular characteristics often process heterogeneous samples without selectivity, thus reducing the accuracy of the information obtained.
FISH is a technique that, in general, aims to improve the specificity of molecular characteristics by implementing highly specific NA probes. Specifically, MFP-based µFISH with CEP7 probes on MCF7 cells resulted in ∼120-fold reduction of the hybridization time compared with a conventional FISH implementation, likely because of convection-enhanced transport of probes and more efficient rinsing than in conventional FISH implementations. Approaches to further improve these characteristics include optimizing flow rates; pinching the flow confinement, including agents to influence molecular crowding; and optimizing the temperature. Moreover, the capability to perform real-time observation makes it feasible to periodically measure the evolution of the FISH signal and estimate optimal signal-to-background values. Probe consumption can be further reduced by implementing liquid recirculation, that is, by circulating the probes back and forth between the inner apertures of the head as described [61]. However, we note that recirculation of viscous probes within the MFP is yet to be explored and may impose special restrictions on the fluid-handling system.
In the context of lysate analysis, conventional molecular biology assays that retrieve analytes for performing local multimodal genomic and transcriptomic analyses usually require high concentrations of NA for artifact-free analysis. This is challenging for local sampling strategies as they inherently contain only a small quantity of NA. The MFP and the hHFC in conjunction with the chemical system described in this work address this challenge and provide significant improvements in processing times and local analysis of NA. The HFC overcomes diffusion limitations that are characteristic of most molecular biology assays performed on benchtop platforms by means of convectively replenishing the liquid processing the surface. In addition, on account of only a minimal dilution of the processing liquid, the hHFC enables continuous lysing action on the cells on the substrate and in the aspiration channel, which results in highly concentrated lysates.
The residence time is the parameter that characterizes the extraction method, as it depends on the chemistry and the flow rates and thus determines lysate concentration and volume. Potential approaches to modulate and tune TR based on the application required include recirculation of the chemical system between the inner apertures [61] during sampling operation, use of alternate chemistries to obtain shorter TR, modification of the channel geometries, and increase in the temperature of operation. Because TR is independent of the size of the area of interest on the cell surface, rapid sampling of adherent cells at varying levels of spatial resolution is possible.
Molecular analysis of adherent cells is generally performed on several different scales, from 3D spheroidal cultures containing hundreds of cells to a single cell, depending on the objective of the investigation. Here, we perform µFISH on ∼1000 cells and lyse ∼400 cells to avoid method-based and statistical artifacts in genomic and transcriptomic studies. At this scale, µFISH provides a more accurate profile across a sample, which is likely to be useful in the context of specific research questions. With Spatialyse, we were able to obtain quantities of DNA that are sufficient for DNA sequencing studies [62, 63]. With respect to mRNA analysis of selectively lysed cells in coculture, we were able to obtain the expected gene expression profiles for the cell types isolated. Because rtPCR was used for the analysis, the quality of the mRNA is compatible with RNAseq studies with appropriate scaling of the spatial resolution. Purified DNA and mRNA can be used for non-PCR-based analytical methods, such as MALDI-TOF, to improve the molecular resolution of the profiles obtained. For the particular case of studying a single cell in its microenvironment, we might be able to scale down the spatial resolution. For example, in our earlier work [48], we fabricated apertures as small as ![]() ; with such aperture dimensions, however, we cannot exclude rapid clogging of channels during regular operation. Another approach includes modulating the shaping liquid to have a small fraction of the processing liquid make contact with a surface, as detailed by Autebert et al. [50]. Furthermore, with the current footprint dimensions, it is in practice possible to perform several hundred individual tests on a 1 cm2 biological sample by using spectrally equivalent probes with short incubation times in µFISH and collecting lysates individually from multiple regions of interest.
; with such aperture dimensions, however, we cannot exclude rapid clogging of channels during regular operation. Another approach includes modulating the shaping liquid to have a small fraction of the processing liquid make contact with a surface, as detailed by Autebert et al. [50]. Furthermore, with the current footprint dimensions, it is in practice possible to perform several hundred individual tests on a 1 cm2 biological sample by using spectrally equivalent probes with short incubation times in µFISH and collecting lysates individually from multiple regions of interest.
In addition to the probing of local genomes and transcriptomes of cells in culture at the end point of a specific study, we can perform temporal studies as the MFP is nondestructive to the unsampled regions on the cell layer. By enabling chronological investigations on the effects of various stimuli, this provides an additional dimension to the information obtained from adherent cell experiments. Furthermore, most molecular biology protocols perform multistep chemistry on biological substrates. With the hHFC, we can perform such multistep chemistry by injecting liquids sequentially as well as process a surface with different chemicals simultaneously. This holds for both µFISH and Spatialyse. Therefore, the strategies developed can be used in combination to first identify chromosomal aberrations and subsequently sample the inner and the outer HFCs individually for simultaneous DNA and RNA analysis. We believe that such a multiplex analysis will significantly improve the range of cytological tests feasible not only on cell monolayers but also on tissue sections, resulting in improved and more accurate spatially resolved mutation profiles of heterogeneous tissues for diagnostic applications.
7.5 Concluding Remarks
µFISH and Spatialyse implementations demonstrated here are versatile techniques for performing rapid, spatial multiplex analysis of NA in adherent cells. µFISH is characterized by significantly shorter incubation times and better probe budgeting and facilitates performing multiple tests adjacently on a given budget of sample. With Spatialyse, we demonstrate a strategy for spatially resolved and selective lysis of cells from adherent mono- and coculture substrates for local DNA and mRNA analysis. Moreover, these methods can be applied to perform temporally and spatially resolved probing of gene expression in adherent cultures, thus improving our understanding of multicellular interactions significantly. Furthermore, combining next-generation sequencing with the techniques described herein can provide a more complete molecular profile of cells interacting with their native microenvironment with single-molecule resolution.
Acknowledgments
This work was in part supported by the European Research Council (ERC) Starting Grant, under the 7th Framework Program (Project No. 311122, BioProbe). We thank Julien Cors, Robert Lovchik, Ute Drechsler, Radostina Pirovska and Deborah Huber for technical assistance, and continuous support from Bruno Michel, Emmanuel Delamarche and Walter Riess.
References
- 1 Bissell, M.J. and Hines, W.C. (2011) Why don't we get more cancer? A proposed role of the microenvironment in restraining cancer progression. Nat. Med., 17, 320–329.
- 2 Yamada, K.M. and Cukierman, E. (2007) Modeling tissue morphogenesis and cancer in 3D. Cell, 130, 601–610.
- 3 Gattazzo, F., Urciuolo, A., and Bonaldo, P. (2014) Extracellular matrix: a dynamic microenvironment for stem cell niche. Biochim. Biophys. Acta, Gen. Subj., 1840, 2506–2519.
- 4 Bhatia, S.N., Balis, U.J., Yarmush, M.L., and Toner, M. (1999) Effect of cell-cell interactions in preservation of cellular phenotype: cocultivation of hepatocytes and nonparenchymal cells. FASEB J., 13, 1883–1900.
- 5 Fagotto, F. and Gumbiner, B.M. (1996) Cell contact-dependent signaling. Dev. Biol., 454, 445–454.
- 6 Nelson, C.M. and Chen, C.S. (2002) Cell-cell signaling by direct contact increases cell proliferation via a PI3K-dependent signal. FEBS Lett., 514, 238–242.
- 7 Lauffenburger, D.A. and Horwitz, A.F. (1996) Cell migration: a physically integrated molecular process. Cell, 84, 359–369.
- 8 Hancock, J.T. (2010) Cell signalling, in European Journal of Cell Biology, vol. 60, Oxford University Press.
- 9 Huber, D., Autebert, J., and Kaigala, G.V. (2016) Micro fluorescence in situ hybridization (µFISH) for spatially multiplexed analysis of a cell monolayer. Biomed. Microdevices, 18, 40.
- 10 Kashyap, A., Autebert, J., Delamarche, E., and Kaigala, G.V. (2016) Selective local lysis and sampling of live cells for nucleic acid analysis using a microfluidic probe. Sci. Rep., 6. doi: 10.1038/srep29579
- 11 Gall, J.G. and Pardue, M.L. (1969) Formation and detection of RNA-DNA hybrid molecules in cytological preparations. Proc. Natl. Acad. Sci. U.S.A., 63, 378–383.
- 12 Manning, J.E. et al. (1975) A new method of in situ hybridization. Chromosoma, 53, 107–117.
- 13 Bauman, J.G., Wiegant, J., Borst, P., and van Duijn, P. (1980) A new method for fluorescence microscopical localization of specific DNA sequences by in situ hybridization of fluorochromelabelled RNA. Exp. Cell. Res., 128, 485–490.
- 14 Evanko, D. (2007) Fully cooked FISH. Nat. Milestones, 490, S6.
- 15 El-Ali, J., Sorger, P.K., and Jensen, K.F. (2006) Cells on chips. Nature, 442, 403–411.
- 16 Andersson, H. and van den Berg, A. (2003) Microfluidic devices for cellomics: a review. Sens. Actuators, B, 92, 315–325.
- 17 Kaigala, G.V., Lovchik, R.D., and Delamarche, E. (2012) Microfluidics in the “open space” for performing localized chemistry on biological interfaces. Angew. Chem. Int. Ed., 51, 11224–11240.
- 18 Kim, L., Toh, Y.-C., Voldman, J., and Yu, H. (2007) A practical guide to microfluidic perfusion culture of adherent mammalian cells. Lab Chip, 7, 681–694.
- 19 Young, E.W.K. and Beebe, D.J. (2010) Fundamentals of microfluidic cell culture in controlled microenvironments. Chem. Soc. Rev., 39, 1036–1048.
- 20 Gabi, M. et al. (2009) FluidFM: combining atomic force microscopy and nano fluidics in a universal liquid delivery system for single cell applications and beyond. Nano Lett., 9, 2501–2507.
- 21 Emmert-Buck, M.R. et al. (1996) Laser capture microdissection. Science, 274, 998–1001.
- 22 Sieben, V.J., Debes-Marun, C.S., Pilarski, L.M., and Backhouse, C.J. (2008) An integrated microfluidic chip for chromosome enumeration using fluorescence in situ hybridization. Lab Chip, 8, 2151–2156.
- 23 Tai, C.-H., Ho, C.-L., Chen, Y.-L., Chen, W.L., and Lee, G.-B. (2013) A novel integrated microfluidic platform to perform fluorescence in situ hybridization for chromosomal analysis. Microfluid. Nanofluid., 15, 745–752.
- 24 Sieben, V.J. et al. (2007) FISH and chips: chromosomal analysis on microfluidic platforms. IET Nanobiotechnol., 1, 27–35.
- 25 Liu, P. et al. (2011) Microfluidic fluorescence in situ hybridization and flow cytometry (µFlowFISH). Lab Chip, 11, 2673–2679.
- 26 Liu, W., Kim, H.J., Lucchetta, E.M., Du, W., and Ismagilov, R.F. (2009) Isolation, incubation, and parallel functional testing and identification by FISH of rare microbial single-copy cells from multi-species mixtures using the combination of chemistrode and stochastic confinement. Lab Chip, 9, 2153–2162.
- 27 Packard, M.M., Shusteff, M., and Alocilja, E. (2012) Microfluidic-based amplification-free bacterial DNA detection by dielectrophoretic concentration and fluorescent resonance energy transfer assisted in situ hybridization (FRET-ISH). Biosensors (Basel), 2 (4), 405–416.
- 28 Zhang, Q. et al. (2006) Microbial detection in microfluidic devices through dual staining of quantum dots-labeled immunoassay and RNA hybridization. Anal. Chim. Acta, 556, 171–177.
- 29 Shah, P. et al. (2011) FISHprep: a novel integrated device for metaphase FISH sample preparation. Micromachines, 2, 116–128.
- 30 Vedarethinam, I. et al. (2010) Metaphase FISH on a chip: miniaturized microfluidic device for fluorescence in situ hybridization. Sensors (Basel), 10, 9831–9846.
- 31 Ho, S.S.Y. et al. (2012) Same-day prenatal diagnosis of common chromosomal aneuploidies using microfluidics-fluorescence in situ hybridization. Prenat. Diagn., 32, 321–328.
- 32 Lim, L.S. et al. (2012) Microsieve lab-chip device for rapid enumeration and fluorescence in situ hybridization of circulating tumor cells. Lab Chip, 12, 4388–4396.
- 33 Perez-Toralla, K. et al. (2015) FISH in chips: turning microfluidic fluorescence in situ hybridization into a quantitative and clinically reliable molecular diagnosis tool. Lab Chip, 15, 811–822.
- 34 Gogoi, P. et al. (2016) Development of an automated and sensitive microfluidic device for capturing and characterizing circulating tumor cells (CTCs) from clinical blood samples. PLoS ONE, 11, e0147400.
- 35 Zanardi, A. et al. (2010) Miniaturized FISH for screening of onco-hematological malignancies. Biotechniques, 49, 497–504.
- 36 Kurz, C.M., Moosdijk, S.V.D., Thielecke, H., and Velten, T. (2011) Towards a cellular multi-parameter analysis platform: fluorescence in situ hybridization (FISH) on microhole-array chips. Conf. Proc. IEEE Eng. Med. Biol. Soc., 2011, 8408–8411.
- 37 Mughal, F. et al. (2014) Microfluidic channel-assisted screening of hematopoietic malignancies. Genes Chromosomes Cancer, 263, 255–263.
- 38 Piccirillo, S.G.M. et al. (2015) Genetic and functional diversity of propagating cells in glioblastoma. Stem Cell Rep., 4, 7–15.
- 39 Achim, K. et al. (2015) High-throughput spatial mapping of single-cell RNA-seq data to tissue of origin. Nat. Biotechnol., 33, 503–509.
- 40 Hansmann, L. et al. (2015) Mass cytometry analysis shows that a novel memory phenotype B cell is expanded in multiple myeloma. Cancer Immunol. Res., 3, 650–660.
- 41 Dalerba, P. et al. (2011) Single-cell dissection of transcriptional heterogeneity in human colon tumors. Nat. Biotechnol., 29, 1120–1127.
- 42 Søe, M.J. et al. (2011) HistoFlex—a microfluidic device providing uniform flow conditions enabling highly sensitive, reproducible and quantitative in situ hybridizations. Lab Chip, 11, 3896–3907.
- 43 Ciftlik, A.T., Lehr, H.-A., and Gijs, M.A.M. (2013) Microfluidic processor allows rapid HER2 immunohistochemistry of breast carcinomas and significantly reduces ambiguous (2+) read-outs. Proc. Natl. Acad. Sci. U.S.A., 110, 5363–5368.
- 44 Chen, D. et al. (2008) The chemistrode: a droplet-based microfluidic device for stimulation and recording with high temporal, spatial, and chemical resolution. Proc. Natl. Acad. Sci. U.S.A., 105, 16843–16848.
- 45 Guillaume-Gentil, O., Zambelli, T., and Vorholt, J.A. (2014) Isolation of single mammalian cells from adherent cultures by fluidic force microscopy. Lab Chip, 14, 402–414.
- 46 Espina, V. et al. (2006) Laser-capture microdissection. Nat. Protoc., 1, 586–603.
- 47 Juncker, D., Schmid, H., and Delamarche, E. (2005) Multipurpose microfluidic probe. Nat. Mater., 4, 622–628.
- 48 Kaigala, G.V., Lovchik, R.D., Drechsler, U., and Delamarche, E. (2011) A vertical microfluidic probe. Langmuir, 27, 5686–5693.
- 49 Cors, J.F., Lovchik, R.D., Delamarche, E., and Kaigala, G.V. (2014) A compact and versatile microfluidic probe for local processing of tissue sections and biological specimens. Rev. Sci. Instrum., 85, 034301.
- 50 Autebert, J., Kashyap, A., Lovchik, R.D., Delamarche, E., and Kaigala, G.V. (2014) Hierarchical hydrodynamic flow confinement: efficient use and retrieval of chemicals for microscale chemistry on surfaces. Langmuir, 30, 3640–3645.
- 51 Qasaimeh, M.A., Gervais, T., and Juncker, D. (2011) Microfluidic quadrupole and floating concentration gradient. Nat. Commun., 2, 464.
- 52 Lovchik, R.D., Kaigala, G.V., Georgiadis, M., and Delamarche, E. (2012) Micro-immunohistochemistry using a microfluidic probe. Lab Chip, 12, 1040.
- 53 Queval, A. et al. (2010) Chamber and microfluidic probe for microperfusion of organotypic brain slices. Lab Chip, 10, 326–334.
- 54 Ainla, A., Jansson, E.T., Stepanyants, N., Orwar, O., and Jesorka, A. (2010) A microfluidic pipette for single-cell pharmacology. Anal. Chem., 82, 4529–4536.
- 55 Sarkar, A., Kolitz, S., Lauffenburger, D.A., and Han, J. (2014) Microfluidic probe for single-cell analysis in adherent tissue culture. Nat. Commun., 5, 3421.
- 56 Shiku, H. et al. (2009) A microfluidic dual capillary probe to collect messenger RNA from adherent cells and spheroids. Anal. Biochem., 385, 138–142.
- 57 Javaherian, S., Li, K.J., and McGuigan, A.P. (2013) A simple and rapid method for generating patterned co-cultures with stable interfaces. Biotechniques, 55, 21–26.
- 58 Livak, K.J. and Schmittgen, T.D. (2001) Analysis of relative gene expression data using real-time quantitative PCR and the 2(−delta delta C(T)) method. Methods, 25, 402–408.
- 59 Lederman, L., Kawasaki, E.S., and Szabo, P. (1981) The rate of nucleic acid annealing to cytological preparations is increased in the presence of dextran sulfate. Anal. Biochem., 117, 158–163.
- 60 Shi, S.-R. et al. (2004) DNA extraction from archival formalin-fixed, paraffin-embedded tissues: heat-induced retrieval in alkaline solution. Histochem. Cell Biol., 122, 211–218.
- 61 Autebert, J., Cors, J., Taylor, D., and Kaigala, G.V. (2016) Convection-enhanced biopatterning with hydrodynamically confined nanoliter volumes of reagents. Anal. Chem. doi: 10.1021/acs.analchem.5b04649
- 62 Liu, L. et al. (2012) Comparison of next-generation sequencing systems. J. Biomed. Biotechnol., 2012, 251364.
- 63 Bau, S. et al. (2009) Targeted next-generation sequencing by specific capture of multiple genomic loci using low-volume microfluidic DNA arrays. Anal. Bioanal. Chem., 393, 171–175.