
Chapter 17
Microfluidic Probes for Scanning Electrochemical Microscopy
Alexandra Bondarenko, Fernando Cortés-Salazar, Tzu-En Lin Andreas Lesch and Hubert H. Girault
École Polytechnique Fédérale de Lausanne (EPFL), EPFL Valais Wallis, Laboratory of Physical and Analytical Electrochemistry, CH-1951 Sion, Switzerland
17.1 Introduction
As discussed in Chapter 16, soft probes (i.e., probes made of flexible polymeric materials with integrated carbon microelectrodes (MEs)) found several applications in scanning electrochemical microscopy (SECM) in order to perform contact mode experiments on fragile and large substrate areas [1–3]. Despite these advantages, the application of soft probes in SECM experiments still requires to place the sample in an electrochemical cell with immersion of the sample into an electrolyte solution. The latter represents a significant limitation when studying chemically sensitive substrates, for example, surfaces prone to corrosion can get oxidized during the SECM experiment, leading to irreproducible and distrustful results. Moreover, conventional SECM with amperometric MEs is restricted to the detection of redox active species that can electrochemically be oxidized or reduced at the ME (for more details see Chapter 16) and/or at the sample.
In order to overcome such limitations and to expand the capabilities of SECM, different approaches have been proposed, for instance, to perform SECM experiments within a stationary droplet of electrolyte solution instead of using a conventional electrochemical cell [4, 5] or by using a theta pipette [6, 7]. The latter is based on the periodic deformation of the liquid meniscus that modulates the solution resistance and consequently produces independent direct and alternating current components for functional surface imaging. However, in all these cases solvent evaporation becomes a critical condition in terms of changes in analyte concentration or salt precipitation. In order to prevent these effects, a humidity chamber [6, 8], glycerin addition [9] to the electrolyte, or covering the solution with mineral or paraffin oil [5] has been reported. Alternatively, soft microfluidic SECM probes consisting of a ME and open microchannels to deliver and aspirate continuously small volumes of electrolyte solution in close proximity of the ME enable a continuous renewal of the measurement volume, providing the electrochemical characterization of any surface in the absence of a bulk electrolyte solution [10, 11].
The first soft microfluidic SECM probe – the fountain pen probe – contained only one open microchannel for electrolyte delivery (pushing of the electrolyte solution) and was developed to perform SECM experiments on initially dry surfaces [10]. Further, it was equipped with a second microchannel (for aspirating = pulling of the electrolyte solution) in order to obtain an electrochemical push–pull probe [11] for continuous renewal of the electrochemical cell and, additionally, for coupling SECM with mass spectrometry (MS) [12] as well as for controlling the microenvironment of live cells [13]. Moreover, the design of the microfluidic SECM probe (i.e., ME and microchannel dimensions or integration of the counter electrode/reference electrode (CE/RE)) was modified depending on the requirements of the desired application as it will be discussed in detail in the following sections (Figure 17.1) [10–13].
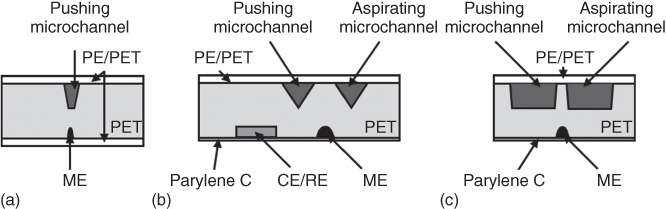
Figure 17.1 Schematic representation of (a) fountain pen probe, (b) electrochemical push–pull probe with an integrated CE/RE for scanning initially dry surfaces, and (c) electrochemical push–pull probe for altering the microenvironments of adherent cells.
17.2 Combining Microfluidics with SECM
17.2.1 Fountain Pen Probe
The first fountain pen probe consisted of one microfluidic channel (35 µm width and 40 µm depth) with an integrated CE/RE and an ME acting as working electrode (WE). Microchannel and ME were aligned and fabricated by laser ablation on the opposite sides of the PET film. For the CE/RE an additional microchannel was drilled perpendicularly and connected to the inner part of the microfluidic channel (Figure 17.2). Further, the microchannels designed for the electrodes were filled with carbon and Ag/AgCl paste for the WE and CE/RE, respectively. After thermal curing, both sides of the probe were laminated by a PE/PET film, and the cross section of the probe was exposed either by blade cutting or laser ablation (optionally followed by mechanical polishing) to create a microfluidic channel and the ME (15 µm width and 20 µm depth) at the tip of the probe (Figure 17.2) [10].
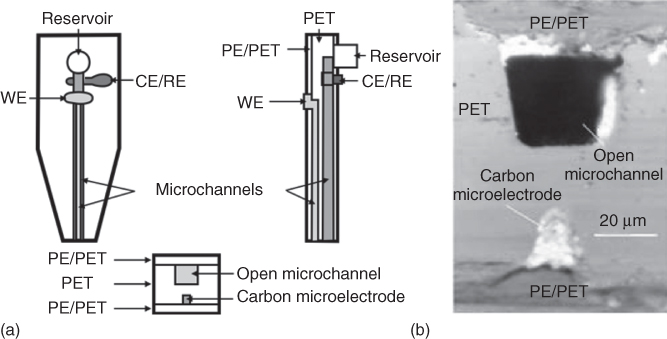
Figure 17.2 (a) Schematic representation of the fountain pen probe; (b) microscopic image of the tip of the fountain probe.
(Ref. [10]. Reproduced by permission of The Royal Society of Chemistry.)
Hence, the microfluidic channel and the WE shape are defined by the cross section of the prepared microchannels, which can easily be reproduced from probe to probe. Moreover, when the microfluidic channel is filled during operation with electrolyte solution and when a droplet of electrolyte solution at the tip of the probe covers the ME, a stand-alone two-electrode cell is formed where the electrical connection between the WE and the CE/RE is made by the electrolyte solution.
As a result, the fountain pen probe extends the scope of SECM toward the scanning of challenging samples (e.g., that cannot be fully immersed into an electrolyte solution or placed into a conventional electrochemical cell) in a contact mode. During scanning with a fountain pen probe, the liquid remained on the substrate, and therefore, in order to keep a constant cell volume at the probe tip, a continuous delivery of electrolyte solution was necessary. In this case, sample contamination after scanning due to precipitates upon solvent evaporation became a major issue, in particular when the samples were needed for further analysis. In order to overcome this limitation, a second generation of microfluidic SECM probes (i.e., electrochemical push–pull probes) was developed as discussed in the next section.
17.2.2 Electrochemical Push–Pull Probes
The electrochemical push–pull probe (in literature also called microfluidic push–pull probe or microfluidic push–pull device) was the second generation of the microfluidic SECM probes, which in comparison with the fountain pen probe contained an additional open microchannel employed for pulling the delivered electrolyte solution away from the substrate (Figures 17.3a) [11–13]. The design of the probe was adjusted in each case for better fitting the requirements of the selected application. For instance, when the probe was applied to investigate dry surfaces, the CE/RE was localized at the tip of the probe in order to reduce ohmic drops in the system and noise in the recorded signal partially due to air bubbles inside the microfluidic channels (Figure 17.3a) [11, 12]. Additionally, a 5 µm Parylene C coating of the carbon track was employed instead of the PE/PET lamination in order to gain a higher sensitivity due to the smaller working distance d between the ME and the substrate (Parylene C coated site is in contact with the substrate; Figure 17.3b). With such a configuration, a droplet of a permanently renewed redox mediator solution with defined volume was maintained just at the probe tip to carry out SECM measurements. Alternatively, when the electrochemical push–pull probe was applied for the local perturbation of the microenvironment of live cells, the cross-sectional area of the open microchannels was enlarged (100 µm width and 30 µm depth) in order to implement higher microfluidic flow rates. For the smaller channels, a flow rate increase could result in a PE/PET film delamination due to the pressure enlargement in the channel. Additionally, the size of the ME was decreased (30 µm width and 15 µm depth) to approach the dimensions of a mammalian cancer cell and to increase the lateral resolution of the SECM experiments. Finally, the carbon track was coated with an even thinner Parylene C layer (i.e., 2 µm; Figure 17.3c), and external, electronically separated CE and RE were employed, facilitating the probe positioning in a close proximity to the live cells under study [13].

Figure 17.3 (a) Schematic representation, (b) optical image of the electrochemical push–pull probe with an integrated CE/RE for scanning initially dry surfaces, and (c) optical image of the electrochemical push–pull probe for altering the microenvironment of adherent cells.
(Adapted with permission from Ref. [11]. Copyright 2011 American Chemical Society.)
Similarly to the fountain pen probes, electrochemical push–pull probes demonstrated the possibility to investigate dry samples with a high spatial resolution in a contact regime. The introduction of the pulling microchannel improved the control of the used volume of electrolyte solution, enhanced the focused flow control, minimized the liquid left on the substrate behind the scanning probe, and therefore lowered previous contamination issues. Furthermore, the coupling of SECM with MS was enabled and allowed the detection of chemical or electrochemical reaction products at the actual probe position [12]. The electrochemical push–pull probes were successfully applied for the SECM imaging of various test samples both in vertical and even in horizontal direction, as well as human fingerprints, for monitoring enzymatic activity and for locally altering live cell microenvironments. The applications are discussed in Section 17.4 after a discussion about the microfluidic SECM probe characteristics.
17.3 Electrochemical Characterization
17.3.1 Cyclic Voltammetry
Microfluidic SECM probes were electrochemically characterized by cyclic voltammetry (CV) in a redox mediator solution delivered through the microfluidic channel. In CV experiments the current iT at the WE is recorded as a function of the applied voltage (ET), which is ramped linearly forth and back within a given potential range until a cycle is completed [14]. Indeed, information about electron transfer and mass transport processes at the ME can be traced from the shape of the obtained curves in a CV experiment. Thus, when a ME is subjected to potentials where an electroactive species gets oxidized or reduced at a rate controlled by mass transport, the recorded current becomes constant no matter if the potential is further increased (i.e., steady-state current due to the hemispherical diffusion typically achieved at MEs). The latter is highly important for SECM experiments since it allows recording of a stable signal that responds quickly to concentration changes of the studied electroactive species. Additionally, a CV of a ME is typically characterized by only small current differences between the forward and backward scans, indicating a low capacitive current [15].
Thus, CVs carried out at fountain pen probes as well as at electrochemical push–pull probes placed far away from a substrate in an aqueous solution of ferrocenemethanol (FcMeOH) presented a behavior that is in good agreement with the expected one for a functional ME (Figure 17.4) [10, 11]. In case of the fountain pen probe, the slope of the rising part of the curve was lower than expected for a reversible redox couple (i.e., FcMeOH/FcMeOH+) due to a high ohmic drop between the CE/RE (positioned inside the microchannel) and the ME located at the tip of the probe (Figure 17.4a) [10]. In contrast, the electrochemical push–pull probe presented a better electrochemical behavior due to the transfer of the CE/RE to the tip of the probe (Figure 17.4b) [11]. It is important to notice that the CV results were only slightly influenced by the microfluidics (dashed and dotted lines in Figure 17.4a,b, respectively), indicating a minor contribution to the total flux of species sensed by the ME under the tested experimental conditions [10, 11].
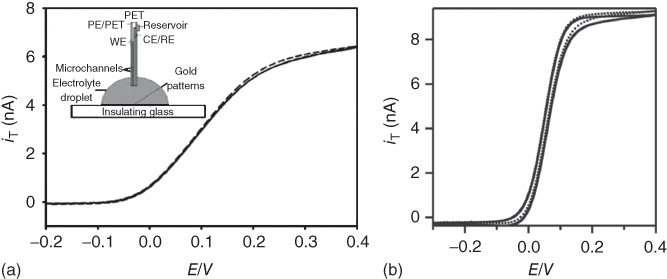
Figure 17.4 (a) Cyclic voltammetry at a fountain pen probe in 3.14 mM FcMeOH and 0.1 M KNO3 at a flow rate of 0.42 (dashed line) and 0 µL/min (continuous line). Scan rate 10 mV/s.
(Ref. [10]. Reproduced by permission of The Royal Society of Chemistry.) (b) Cyclic voltammetry at an electrochemical push–pull probe in 2.0 mM FcMeOH and 0.1 M KNO3 with microfluidics on (dotted line) and off (solid line). Microfluidic flow rates of 0.2 µL/min for pushing and 2.5 µL/min for pulling were employed.
(Adapted with permission from Ref. [11]. Copyright 2011 American Chemical Society.)
17.3.2 SECM Experiments
As discussed in Chapter 16, SECM belongs to the family of scanning probe microscopy (SPM) techniques and is widely applied for the spatial characterization of the reactivity of various interfaces (e.g., liquid/liquid, solid/liquid). Microfluidic SECM probes have a significant similarity with standard (i.e., non-microfluidic) soft SECM probes, for instance, when the soft probe contacts the substrate surface when approaching the soft probe bends and slides over the surface, resulting in a constant d (Figure 17.5a). The current recorded at the ME as a function of the tip–substrate position can be used to plot so-called approach curves. When approaching a non-microfluidic soft probe toward an insulating or electrochemically inactive substrate, the recorded current at the ME decreases (negative feedback due to the hindered diffusion of the redox active species caused by the blocking sample surface) and increases over a reactive surface (positive feedback due to the regeneration of redox active species at the active surface, causing an additional flux of redox active species toward the ME) [16]. However, when the microfluidic SECM probes were approached toward different substrates (before contacting the surface), a continuous increase of the current profile for both insulating and conductive substrates was observed (Figure 17.5b). Such phenomenon can be explained by the additional flux of electroactive species provided by the microfluidics that counterbalance the hindering of the redox mediator diffusion. Nevertheless, when the probe gets into close proximity to the substrate and even touches it, such effect is overcome, resulting in a current decrease for insulating substrates as expected [10, 11]. Therefore, contact mode scanning provides the highest current contrast between active and non-active zones within the same sample surface due to the defined flow conditions and the small and constant working distance of the ME.

Figure 17.5 (a) Schematic representation of a microfluidic SECM probe approached toward a surface. (b) Experimental approach curves of a fountain pen probe (continuous line) and a soft stylus probe (dashed line) over an unbiased gold electrode (1) and insulating glass substrate (2) in 2.1 mM FcMeOH and 0.1 M KNO3. Experimental conditions: ET = 0.4 V, translation rate 0.5 µm/s, and flow rate 0.42 µL/min. c) Experimental approach curves of a fountain pen probe over an unbiased gold electrode (1) and insulating glass substrate (2) at a flow rate of 0.42 µL/min (continuous line), 0.25 µL/min (dashed line), and 0.08 µL/min (pointed line). Experimental conditions: ET = 0.4 V, translation rate 0.5 µm/s, 2.1 mM FcMeOH, and 0.1 M KNO3 aqueous solution.
((b,c) Ref. [10]. Reproduced by permission of The Royal Society of Chemistry.)
As for the standard soft probes discussed in Chapter 16, the inclination angle γ with respect to the surface normal of the soft microfluidic SECM probes is important. For instance, when approaching the probe perpendicularly to the substrate (γ = 0°, i.e., 90° with respect to the substrate surface), the current contrast between positive and negative feedback is high due to an efficient blocking of the redox mediator diffusion by the parallel substrate surface. Despite this, the bending side and sliding direction of the probe become difficult to control and pose a clear threat to SECM line scans and imaging (vide infra). An angle of γ = 20°, which made a good compromise for soft probes between diminishing topographic artifacts, controlling the probe bending direction, and maintaining an adequate current contrast, can be applied as well for the microfluidic probes [17].
Another important parameter for the fountain pen probe is the flow rate, which can influence significantly the steady-state current when the probe is placed in close proximity to the substrate (Figure 17.5c). Indeed, when the probe is approached to a conductive substrate, a slightly higher current increase is observed for lower flow rates, which is probably due to a lower dilution factor of the redox mediator concentration. When approaching the probe to an insulating substrate, lower currents are recorded as lower flow rates are employed. This phenomenon is a consequence of a faster depletion of the redox species concentration when less species are delivered into the gap between the probe and the sample surface. Therefore, a higher current contrast between active and non-active surfaces is obtained when scanning with the fountain pen probe at low flow rates, for example, 0.08 µL/min. However, practically it turned to be difficult due to the evaporation and precipitation of the supporting electrolyte at the microchannel opening, causing even a blocking of the channel. For this reason, flow rates between 0.25 and 0.42 µL/min were employed for SECM imaging experiments. Flow rates higher than 0.42 µL/min could cause the delamination of the microchannels due to a relatively high pressure on the probe films and could consequently not be used [10]. For the electrochemical push–pull probes, the pushing and pulling flow rates were set to 0.2 and 2.5 µL/min, respectively, which was related to the change of the microchannel dimensions [11]. Such a significant difference in the pushing and pulling flow rates was necessary to establish an effective aspiration and formation of a droplet at the tip of the probe. Indeed, depending on the microchannel dimensions, the effective aspiration rate does not necessarily correspond to the nominal one (i.e., effective aspiration rate < nominal aspiration rate) due to the presence of air bubbles in the microchannels and dead volumes nearby the microfluidic connections.
The extraction of kinetic rate constants of the studied electrochemical reactions from the SECM approach curves (for more details see Chapter 16) becomes challenging in case of microfluidic SECM probes due to convection introduced by the microfluidics. Nevertheless, the SECM approach curves allow a precise positioning of the microfluidic probes over the sample surface (i.e., clear identification of the probe-sample contact point), permitting to carry out SECM line scans and imaging of dry surfaces in a contact mode.
Along with approach curves, SECM line scans and 2D images offer the possibility to map locally the surface reactivity. Lateral line scans were performed with the fountain pen probe over a dry glass–gold boundary applying different hP values (Figure 17.6a). By definition, hP is zero at the point of contact between soft probe and sample and becomes negative when the Fountain probe is slightly pressed against the surface for contact mode scanning (details in Chapter 16). While no current difference was observed between the insulating and the conductive substrates in contactless mode line scans (i.e. Fountain probe freely suspended in the electrolyte solution), a significant current contrast between the insulating and conductive regions was observed for hP values equal to −10 and −20 µm, confirming the applicability of the microfluidic probes for imaging dry surfaces.

Figure 17.6 (a) Lateral SECM line scans in feedback mode with a fountain pen probe over a glass partially covered by gold at a hp value of 10 µm (pointed line), −10 (dashed line), and −20 µm (continuous line). Experimental conditions: ET = 0.4 V, flow rate 0.42 µL/min, step size 5 µm and translation rate 25 µm/s, 2.1 mM FcMeOH, and 0.1 M KNO3 aqueous solutions. (b) SECM line scan over a vertical gold–glass border in feedback mode with the electrochemical push–pull probe. Experimental conditions: ET = 0.3 V, pushing flow rate 0.2 µL/min, pulling flow rate 2.5 µL/min, step size 20 µm and translation rate 50 µm/s, 2.0 mM FcMeOH, and 0.1 M KNO3 aqueous solutions. (c) Optical image of the gold micro EPFL logo (left) and its SECM image in feedback mode carried out with a fountain pen probe over the dry surface (right). Experimental conditions: hP = −30 µm, ET = 0.4 V, flow rate 0.33 µL/min, step size 20 µm and translation rate 20 µm/s, 2.6 mM FcMeOH, and 0.1 M KNO3 aqueous solutions.
((a,c) Ref. [10]. Reproduced by permission of The Royal Society of Chemistry). d) Optical photograph (top) of a gold printed interdigitated array of gold lines and its SECM image in feedback mode with the electrochemical push–pull probe carried over the dry surface (bottom). Experimental conditions: ET = 0.3 V, pushing flow rate 0.2 µL/min, pulling flow rate 2.5 µL/min, step size 50 µm and translation rate 20 µm/s, 2.0 mM FcMeOH, and 0.1 M KNO3 aqueous solutions.
((b,d) Ref. [11]. Copyright 2011 American Chemical Society.)
A very interesting feature of the microfluidic SECM probes is that besides imaging horizontally orientated surfaces, they can be applied for the electrochemical characterization of vertically placed samples. The latter becomes possible since electrochemical experiments can be performed within the delivered nanodroplet of a redox mediator solution continuously renovated by microfluidics and covering (and contacting) the ME and CE/RE active areas. The ME and microchannel openings are directed upward so that the droplet of electrolyte solution can sit on the probe and next to the substrate surface rather than flowing down the substrate due to gravity. Thus, vertical SECM feedback mode line scans performed along a gold–glass sample confirmed the versatility of the microfluidic SECM probes (Figure 17.6b).
Equally to the soft probes described in Chapter 16, a lift-off of the push–pull probe into the solution bulk is carried out during an imaging experiment for the displacement of the probe after a forward line scan and before starting the subsequent line scan. An EPFL logo, made of a gold structure on glass, was imaged in this way under dry conditions by using a fountain pen probe (Figure 17.6c). As a result, the logo can be clearly observed due to the recycling of the redox mediator obtained over the conductive gold film (positive feedback) and hindered diffusion of the redox mediator over the insulating areas (negative feedback). The obtained SECM image presented small positional shifts of the recorded current of the letters “P,” “F,” and “L” in the bottom part of the image. This issue is most likely due to the evaporation of the supporting electrolyte that resulted in the deposition of material over the sample and the possible modification in the degree by which the fountain pen was bended. Alternatively, when the push–pull probe was employed for SECM imaging, no supporting electrolyte precipitation was found on the sample during the complete experiment, even with experimental times as long as 6 h, resulting in images free of positional shifts (Figure 17.6d).
The electrochemical push–pull probes overcome the aforementioned limitations of the fountain pen probe and bring some further additional advantages. For instance, the thinner Parylene C coating of the carbon track (i.e., between 2 and 5 µm) allowed a smaller working distance between the ME and the sample surface, therefore resulting in a higher assay sensitivity. Furthermore, the second microchannel allowed the analysis of the extracted volumes by other analytical methods. An overview about various applications of these probes is given in the next section.
17.4 Applications
17.4.1 SECM Imaging of Human Fingerprints Contaminated with Explosive Traces
The visualization of human fingerprints is an important task in forensic science when speaking about the determination of a person's identity and also about the detection of illegal substances that have been in contact with the suspect's fingers [18, 19]. However, the correct analysis of real fingerprint samples is challenging due to the type of fingerprints (e.g., made of biological material) and surfaces (e.g., with strong color backgrounds or prone to corrosion) on which they are found. To date there is no universal strategy that can be applied to all situations, and the combination of different methodologies is often preferred. Recently, SECM in the feedback mode has been employed for the imaging of human fingerprints based on the detection of silver nanoparticles [20] or benzoquinone-tagged proteins [21].
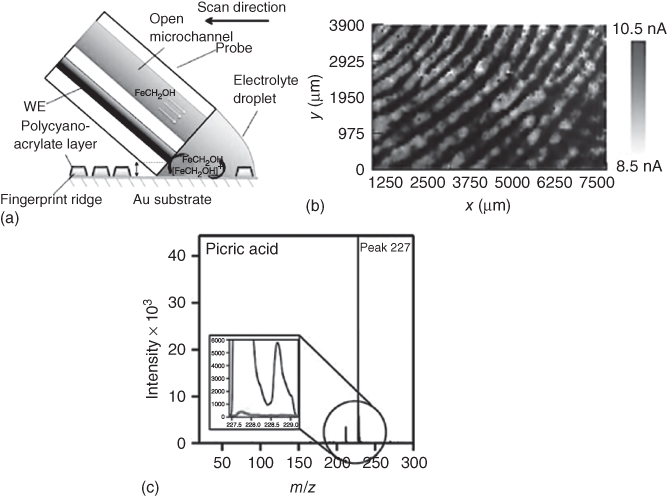
Figure 17.7 Fingerprint imaging with the electrochemical push–pull probe. (a) The concept implemented for fingerprint detection with push–pull probes (not to scale). (b) SECM image (ET = 0.4 V, step size of 25 µm in x and 75 µm in y directions, translation rate 300 and 75 µm/s, respectively) of a latent human fingerprint. (c) MALDI-MS spectra of the collected liquid portions.
(Adapted with permission from Ref. [12]. Copyright 2012 American Chemical Society.)
Furthermore, SECM has also been combined with the well-known cyanoacrylate protocol for the detection of human fingerprints on conductive surfaces using the electrochemical push–pull probe [12]. With this aim, a conductive substrate containing a fingerprint is placed inside a closed chamber where cyanoacrylate vapors are deposited specifically over the fingerprint residue, leaving the conductive surface untreated [22]. Thus, when a biased SECM probe is scanned over the substrate, the increase of the amperometric signal is attributed to the redox mediator (e.g., FcMeOH) recycling at the untreated conductive substrate. In contrast, a current decrease will be observed when scanning over the cyanoacrylate-covered fingerprint ridges due to the blocking of the redox mediator diffusion toward the ME (Figure 17.7a). The resulting positive and negative feedback currents plotted as a function of tip coordinate resulted in a highly resolved image of an analyzed fingerprint (Figure 17.7b), demonstrating the capabilities of the electrochemical push–pull probe for the SECM feedback mode imaging of human fingerprints. It is worth to notice that the SECM image presented in Figure 17.7b was obtained using a chemically stable conductive gold layer. However, the real advantage of the microfluidic probes becomes evident when the human fingerprint is deposited over a prone to corrosion substrate. For example, when a human fingerprint was placed on a copper substrate that was subsequently immersed in an electrolyte solution (2 mM FcMeOH and 40 mM KNO3), the whole sample was significantly destroyed after only 1 h. In contrast, no changes related to oxidation or dissolution of copper were observed when an SECM image of such sample was carried out inside a reduced volume provided by the electrochemical push–pull probe [12].
Furthermore, the electrochemical push–pull probe offers additional advantages for the SECM imaging of human fingerprints due to the possibility to couple the pulling microchannel to MS for complementary analysis. For instance, if during an SECM experiment the solution in contact with the fingerprint is aspirated and then deposited on a matrix-assisted laser desorption ionization (MALDI) target plate, the identification of relevant forensic species becomes possible. The latter was illustrated by investigating human fingerprints contaminated with an explosive compound (i.e., picric acid) with the electrochemical push–pull probe coupled to MALDI-MS. As a result, simultaneously to the electrochemical image, it was possible to detect down to 28.5 nmol of picric acid deposited on the volunteer's finger preparing the fingerprint (Figure 17.7c). Thus, the electrochemical push–pull probe opens the possibility for SECM to read out interfacial chemical events by measuring electrochemical and molecular signals.
17.4.2 Monitoring Enzymatic Reactions
Enzymatic reactions underlie many biological processes and therefore are widely employed to evaluate natural biological activity and to operate enzyme-based immunoassays. With this aim, the progression of an enzymatic reaction is monitored depending on the nature of its product, for instance, by optical or electrochemical means. Indeed, SECM has been employed to read out localized enzymatic activity in the sample generation/tip collection (SG/TC) mode as a detection step of heterogeneous immunoassays providing relevant information for the biological processes [23, 24] as well as for the visualization of various antigens in diverse samples [25–27]. In this type of experiments, the substrate with the immobilized enzyme will typically be immersed inside a solution of the appropriate enzymatic substrate. Afterwards, a ME is scanned over the surface in order to monitor the generation of the electrochemically active product of the enzymatic reaction, which results in a clear increase of the recorded SECM current. Alternatively, the electrochemical push–pull probe allows the readout of the activity of enzymes by delivering the substrate solution to the tip of the probe, as shown in Figure 17.8a where alkaline phosphatase (ALP) was adsorbed on a polyvinylidene difluoride (PVDF) membrane and a solution of p-aminophenol phosphate (PAPP) was locally supplied. Thus, p-aminophenol (PAP) (the product of the enzymatic reaction) was successfully detected electrochemically at the integrated ME, confirming the applicability of electrochemical push–pull probes for monitoring enzymatic reactions.
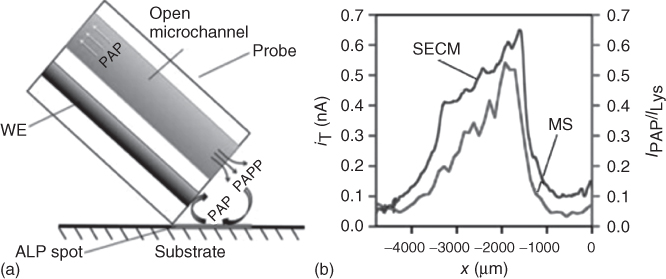
Figure 17.8 (a) Schematic representation of the push–pull strategy for simultaneous SECM and MS detection of a product of enzymatic reaction: the stimulant (PAPP) is delivered via microfluidics of the probe and is converted at the immobilized enzyme (ALP) to product (PAP), which is sensed at the WE and is pulled into an aspiration microfluidic channel for further MS identification. (b) Experimental SECM (ET = 0.35 V, step size of 10 µm, translation rate of 50 µm/s) and corresponding ESI-MS (axis on the right) line scans over ALP spot. The ESI-MS intensity of PAP IPAP is represented as relative to the ion current of lysine ILys used as internal standard.
(Adapted with permission from Ref. [12]. Copyright 2012 American Chemical Society.)
Similarly to the coupling of SECM with MALDI-MS described previously, the presence of the pulling microchannel allows combining SECM with further MS techniques such as electrospray ionization (ESI)-MS. For instance, as in the case described previously, the liquid in contact with the adsorbed enzyme was pulled into the microfluidic probe and further analyzed by ESI-MS for the detection of PAP. In order to maintain the spatial resolution achieved with the scanned electrochemical probe, the aspirated sample was separated successfully within the microfluidic system by a sequence of air plugs. As a result, the electrochemical push–pull probe could be employed for monitoring ALP activity by the simultaneous detection of PAP by electrochemical and MS means. The good agreement between the SECM and the ESI-MS profile (Figure 17.8b) confirmed the capabilities of push–pull scanning for parallel MS and electrochemical surface reactivity characterization of enzymatic reactions or other biological processes.
17.4.3 Local Manipulation of Adherent Live Cell Microenvironments
Recently, the local manipulation of the microenvironment of adherent cells has attracted considerable attention in order to study and understand better biological processes at a cellular level. With this aim, new platforms such as the multipurpose scanning microfluidic probes [28] (for more details see Chapter 11) or FluidFM [29] (combination of microfluidics with atomic force microscopy; for more details see Chapters 14 and 15) capable to perform spatiotemporal perturbations of single or few cells have been proposed. Furthermore, a glass nanopipette filled with electrolyte solution and a Ag/AgCl electrode plugged into it became the basis of the scanning ion conductance microscopy (SICM) – one of the SPMs widely applied for live cell investigations [30, 31].
The electrochemical push–pull probe can affect samples in a microfluidic mode, for instance, by infusion of a chemical effector compound from the pushing microchannel while simultaneously aspirating it through the pulling channel, thereby focusing the flow between the channels (Figure 17.9a). However, it can also be used in an electrochemical mode for the electrochemical generation of a chemical effector compound (Figure 17.9b). Theoretical calculations of the size and the shape of the areas affected by the electrochemical push–pull probe operated in the microfluidic and electrochemical modes were performed by using finite element analysis of coupled Navier–Stokes and diffusion–convection differential equations. In each case, the affected substrate area was represented by the concentration profile of a given chemical effector B delivered from an open microchannel or electrochemically generated from a non-active compound A at the ME. Finite element analysis demonstrated that the size and the shape of the affected area depends significantly on the probe–substrate distance, the angle on which the probe was positioned above the substrate and additionally, in case of the microfluidic mode, on the pushing/aspirating flow rate ratios (Figure 17.9).

Figure 17.9 Schematic representation of the electrochemical push–pull probe operated in (a) microfluidic focusing mode and (b) the electrochemical mode for the localized perturbation of living cells. Concentration profiles of the active compound B delivered over the sample surface by the electrochemical push–pull probe operated in (c–f) microfluidic and (g–h) electrochemical modes under different conditions. For the microfluidic mode for all the simulations, the pushing flow rate was 1 µL/min, and the probe angle with respect to the substrate surface was 70°. Aspirating flow rate and the working distance d were, respectively, (c) 1 µL/min and 50 µm, (d) 5 µL/min and 50 µm, (e) 5 µL/min and 100 µm, and (f) 5 µL/min and 250 µm. For the electrochemical mode, the angle of the probe was equal to 70° with respect to the substrate surface, and the working distance d was (g) 15 µm and (h) 2 µm.
(Adapted with permission from Ref. [13]. Copyright 2015 American Chemical Society.)
In order to verify experimentally the results obtained from the simulations, the electrochemical push–pull probe was employed for the localized fluorescent labeling of adherently grown A549 cancer cells in the microfluidic mode and for the temporary quenching of live cell fluorescence by introducing highly localized pH changes in the electrochemical mode. For the localized labeling of the adherent cells, the fluorescent dye acridine orange (AO) was delivered over the adherent cells, and as a function of the working distance, inclination angle, and aspiration rate, a tunable area of cells was affected. Thus, for a 50 µm working distance, 20 µL/min nominal aspirating flow rate, and a 20° inclination angle γ (i.e., 70° with respect to the substrate surface), the labeled area corresponded to 6.7 × 105 µm2 (Figure 17.10a). The increase of the probe–substrate distance up to 100 µm while keeping other parameters constant only introduced slight changes on the size of the affected area (i.e., 5.3 × 105 µm2) (Figure 17.10b). At the same time when a working distance of 250 µm was employed, the size and the intensity of the labeled area were drastically reduced (Figure 17.10c), and the labeling of cells under these conditions corresponded more to a random distribution. Further comparison of the experimental and the simulated results (Figure 17.10d–f) suggested that the effective aspiration rate achieved experimentally was lower than the nominal one (i.e., 20 µL/min) and was approximately equal to 3 µL/min [13].

Figure 17.10 (a–c) Fluorescence microscopy images of cancer cells labeled with AO (white spots) by the electrochemical push–pull probe operated in a microfluidic mode with a probe angle of 70° with respect to the substrate surface. (d–f) Overlapping between the numerically simulated affected area (color image) and the experimental results (presented as inverted black and white images; labeled cells are depicted as black spots). Gray and white dashed lines represent the position of the pushing and aspirating microchannels, respectively. Experimental nominal aspirating flow rate was 20 µL/min, whereas the one used for the simulations was 3 µL/min. Working distance d was 50 µm for (a) and (d), 100 µm for (b) and (e), and 250 µm for (c) and (f). The pushing flow rate was 1 µL/min for all experiments.
(Reprinted with permission from Ref. [13]. Copyright 2015 American Chemical Society.)

Figure 17.11 Fluorescence microscopy images (a) before and (b) after the perturbation of adherent cancer cells labeled with AO by using the electrochemical push–pull probe in an electrochemical mode. Working distance d was 2.5 µm, and the inclination angle was equal to 70°. The marked cells were significantly affected during the experiment. (c) Reversed fluorescence intensity profile of the AO-labeled cells during the electrochemically induced Morse code S−O−S signal.
(Adapted with permission from Ref. [13]. Copyright 2015 American Chemical Society.)
In the electrochemical mode, biasing the integrated ME at a constant potential of −2 V (vs. an Ag quasi-reference electrode) in an aqueous solution can induce a drastic increase of the local pH value due to OH− generation (2H2O + 2e− → H2 + 2OH−). This perturbation can be detected optically by the pH-induced quenching of the AO fluorescence. Indeed, when the electrochemical push–pull probe was biased to a potential of −2 V and positioned 2.5 µm over the labeled adherent cells, it induced a decrease on the fluorescence intensity of the cells placed in a close proximity (i.e., six cells, sample affected area ≈ 9000 µm2; Figure 17.11). It is important to notice that the AO-labeled cells that were affected by the pH-induced fluorescence quenching can recover the intensity of their signal when the probe is unbiased. As a consequence, the push–pull probe could further successfully be employed in the electrochemical mode to generate a Morse code S−O−S signal (i.e., three short signals, or dots, for “S”; three long signals, or dashes, for “O”; followed by three short signals for “S”) by purposely controlling the ME potential and as a result the fluorescence intensity of adherent cells. The analysis of the variation in the fluorescence intensity of the AO-labeled cell surface below the ME allowed describing the bioelectrochemically encoded S–O–S Morse signal (Figure 17.11c). Despite that the signal recovery decreased as a function of time and applied perturbations (most likely due to the longer exposition of the AO-labeled cells to higher pH values), it is clear that the electrochemical push–pull probe is a very useful tool for the spatiotemporal perturbation of live cell microenvironments and can therefore be further implemented to study the pH influence on the growth and proliferation of malignant cancer cells [13].
17.5 Conclusions and Outlook
As it was discussed in this chapter, soft microfluidic SECM probes represent a versatile tool for supporting various investigations ranging from the electrochemical characterization of different surfaces (reading) to the local perturbation of the microenvironment of adherently grown live cells (writing). For instance, the microfluidic SECM probes were successfully implemented to read out the surface reactivity at horizontal and vertical metal-on-glass structures, human fingerprints, and immobilized enzymes. Furthermore, the electrochemical push–pull probe demonstrated the ability to acquire simultaneously chemical and electrochemical information, which is useful in forensic science, for instance, in order to identify explosive traces adsorbed on a suspects' fingerprint. Furthermore, the application of the microfluidic SECM probes as a tool for spatiotemporal live cell perturbations has a significant potential toward biological applications, for example, for monitoring in vitro hypoxic tumor models toward the discovery of new therapeutic compounds and the understanding of effects induced by localized pH changes within malignant cells. Finally, the microfluidic SECM probes can be easily multiplexed (MEs as well as microchannels) in order to investigate large surfaces or increase the capacity toward drug screening. To conclude, the soft microfluidic SECM probe concept represents an all-in-one promising platform for the imaging, perturbation, and characterization of microenvironments at both electrochemical and chemical levels.
References
- 1 Cortés-Salazar, F., Trauble, M., Li, F., Busnel, J., Gassner, A., Hojeij, M., Wittstock, G., and Girault, H.H. (2009) Anal. Biochem., 81, 6889–6896.
- 2 Lesch, A., Vaske, B., Meiners, F., Momotenko, D., Cortés-Salazar, F., Girault, H.H., and Wittstock, G. (2012) Angew. Chem. Int. Ed., 51, 10413–10416.
- 3 Lesch, A., Momotenko, D., Cortés-Salazar, F., Roelfs, F., Girault, H.H., and Wittstock, G. (2013) Electrochim. Acta, 110, 30–41.
- 4 Lohrengel, M.M., Moehring, A., and Pilaski, M. (2000) Fresenius J. Anal. Chem., 367, 334–339.
- 5 Turcu, F., Schulte, A., and Schuhmann, W. (2004) Anal. Bioanal. Chem., 380, 736–741.
- 6 Spaine, T.W. and Baur, J.E. (2001) Anal. Chem., 73, 930–938.
- 7 Ebejer, N., Schnippering, M., Colburn, A.W., Edwards, M.A., and Unwin, P.R. (2010) Anal. Chem., 82, 9141–9145.
- 8 Day, T.M., Unwin, P.R., and Macpherson, J.V. (2007) Nano Lett., 7, 51–57.
- 9 Ball, J., Scott, D., Lumpp, J., Daunert, S., Wang, J., and Bachas, L. (2000) Anal. Chem., 72, 497–501.
- 10 Cortés-Salazar, F., Lesch, A., Momotenko, D., Busnel, J.-M., Wittstock, G., and Girault, H.H. (2010) Anal. Methods, 2, 817–823.
- 11 Momotenko, D., Cortés-Salazar, F., Lesch, A., Wittstock, G., and Girault, H.H. (2011) Anal. Chem., 83, 5275–5282.
- 12 Momotenko, D., Qiao, L., Cortés-Salazar, F., Lesch, A., Wittstock, G., and Girault, H.H. (2012) Anal. Chem., 84, 6630–6637.
- 13 Bondarenko, A., Cortés-Salazar, F., Gheorghiu, M., Gaspar, S., Momotenko, D., Stanica, L., Lesch, A., Gheorghiu, E., and Girault, H.H. (2015) Anal. Chem., 87, 4479–4486.
- 14 Girault, H.H. (2004) Analytical and Physical Electrochemistry, 1st edn, EPFL Press, Lausanne, Switzerland.
- 15 Bard, A.J. and Mirkin, M.V. (2012) Scanning Electrochemical Microscopy, 2nd edn, CRC Press.
- 16 Wipf, D.O. (1991) J. Electrochem. Soc., 138, 469–474.
- 17 Cortés-Salazar, F., Momotenko, D., Lesch, A., Wittstock, G., and Girault, H.H. (2010) Anal. Chem., 82, 10037–10044.
- 18 Becue, A., Champod, C., and Margot, P. (2007) Forensic Sci. Int., 168, 169–176.
- 19 Lauzon, N., Dufresne, M., Chauhan, V., and Chaurand, P. (2015) J. Am. Soc. Mass. Spectrom., 26, 878–886.
- 20 Zhang, M. and Girault, H.H. (2007) Electrochem. Commun., 9, 1778–1782.
- 21 Cortés-Salazar, F., Busnel, J.-M., Li, F., and Girault, H.H. (2009) J. Electroanal. Chem., 635, 69–74.
- 22 Lee, H.C. and Gaensslen, R.E. (1994) Advances in Fingerprint Technology, CRC Series in Forensic and Police Science, CRC Press, Boca Raton, FL.
- 23 Xue, Y., Ding, L., Lei, J., Yan, F., and Ju, H. (2010) Anal. Chem., 82, 7112–7118.
- 24 Takahashi, Y., Miyamoto, T., Shiku, H., Ino, K., Yasukawa, T., Asano, R., Kumagai, I., and Matsue, T. (2011) Phys. Chem. Chem. Phys., 13, 16569–16573.
- 25 Lin, T.-E., Bondarenko, A., Lesch, A., Pick, H., Cortés-Salazar, F., and Girault, H.H. (2016) Angew. Chem. Int. Ed., 55, 3813–3816.
- 26 Sciutto, G., Prati, S., Mazzeo, R., Zangheri, M., Roda, A., Bardini, L., Valenti, G., Rapino, S., and Marcaccio, M. (2014) Anal. Chim. Acta, 831, 31–37.
- 27 Song, W., Yan, Z., and Hu, K. (2012) Biosens. Bioelectron., 38, 425–429.
- 28 Kaigala, G.V., Lovchik, R.D., Drechsler, U., and Delamarche, E. (2011) Langmuir, 27, 5686–5693.
- 29 Meister, A., Gabi, M., Behr, P., Studer, P., Vörös, J., Niedermann, P., Bitterli, J., Polesel-Maris, J., Liley, M., Heinzelmann, H., and Zambelli, T. (2009) Nano Lett., 9, 2501–2507.
- 30 Hansma, P.K., Drake, B., Marti, O., Gould, S.A., and Prater, C.B. (1989) Science, 243, 641–643.
- 31 Gorelik, J., Zhang, Y., Shevchuk, A.I., Frolenkov, G.I., Sánchez, D., Lab, M.J., Vodyanoy, I., Edwards, C.R.W., Klenerman, D., and Korchev, Y.E. (2004) Mol. Cell. Endocrinol., 217, 101–108.