
You will analyze the quantity ordered to understand its distribution across regions and the price range.
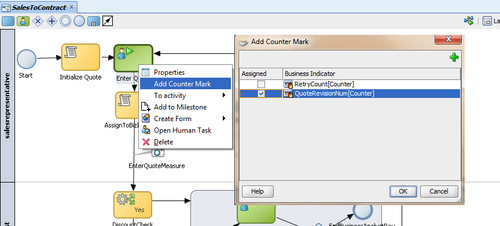
In this scenario, you add a counter to count the number of times the quote needs to be revised.
You will use Script Activity to assign data to the business indicators.
Open the version of the project youcreated in Chapter 8, Exception Management. For the sake of simplicity, remove the validation section and CustomerCheck rules. Remove the Exception section and the process should look as follows:
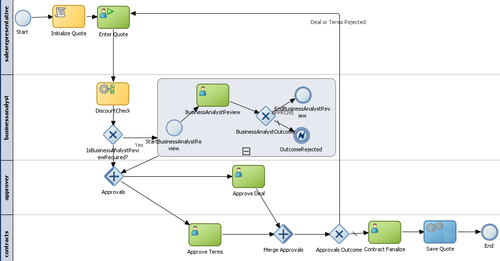
The process will now allow the salesrepresentative user to Enter Quote, and then the discounts will be checked.
If the discount is greater than 30 percent and customer type is Premium, then Business Practice Review is not required. The process token will move ahead for Approve deal and Approve Terms. Once approve deal and approve terms are approved, the contract waits to be finalized. Once it is finalized, a quote is saved to a file location.
Measurement marks are used to measure a business indicator of type Measure at a certain point in the process or in a section of the process. You can use one measurement mark to measure multiple business indicators.
When storing the value of a measure business indicator, the BPMN Service Engine also stores the value of the dimensions you defined in your process. Later on, when you build the dashboards to monitor your process, you can use these dimensions to group the values into different categories. For example, in the Sales Quote process you might want to view the total quantity ordered by region. Measurement marks are of single measurement type, interval start type, and interval stop type.
I. Create business indicator
- Open JDeveloper in default role.
- Go to Application Navigator | Project, and click on SalesToContract process.
- Go to View | Structure to open the structure window, if it's not open after step 2.
- In the Structure Windows, right click on Business Indicators.
- Click New | Dimension to open the create dimension dialog.
- Enter name PriceRangeDimensions to create a List price range dimension and enter range values as shown in the following screenshot. Set the Type to Int:
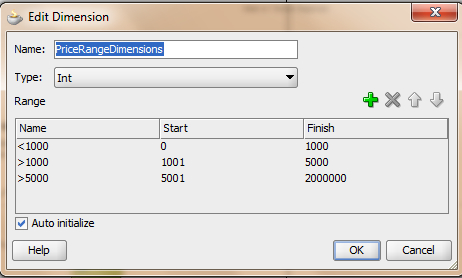
- Click on OK.
- Click on New | Dimension, to open the Create Dimension dialog. We will create another dimension for Region.
- Enter Name as Region and Type as String.
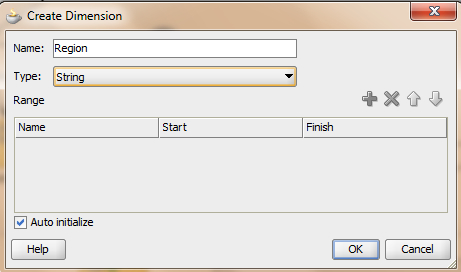
- Click on OK.
- In the structure window, click on Business Indicator | New | Measures.
You will create a measure business indicator for quantity.
- In the Create Measure dialog, enter Name as Quantity and set Type as Int.
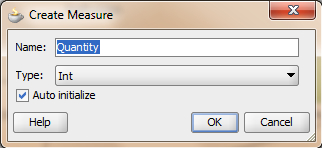
- Click on OK.
- In the structure window, click on Business Indicator | New | Counter . Add a counter business indicator for counting the number of times the quote is revised. Enter Name as QuoteRevisionNum.
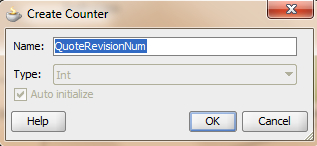
- Click on OK.
II. Data assignment to business indicators
- Open JDeveloper in the default role and open the SalesToContract process in the canvas.
- Go to Component palette | BPM | Activities and click on Script Activity.
You will use a script activity to assign data to the business indicators from the quote Data object.
- Click on the Sequence Flow between Enter quote human task and Discount check rule in the salesrepresentative swimlane.
This will open the Script task properties dialog.
- In the Basic tab, enterAssignToBizIndicators as the name of the script task.
- In the Implementation tab, check Use associations and click on the edit pencil sign.
This will open the Data association dialog.
- Drag-and-drop Quantity, Region, and PriceRangeDimensions into the variable section in the Data association dialog.
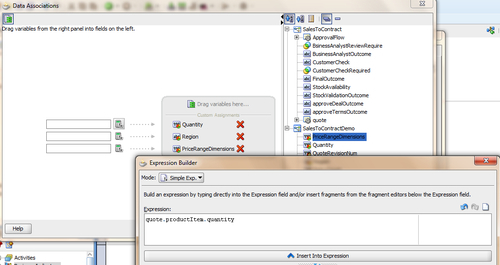
- To set the Quantity, Region, and PriceRangeDimensions values, click on Expression Builder, on the right of input box. This will open the Expression Builder.
- For the Quantity input box's Expression Builder, expand quote | productItem | quantity and click on the Insert into expression button.
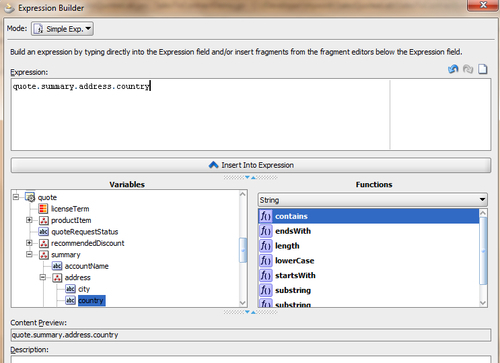
- For the region input box's expression builder, Expand quote | summary | address | country and click on OK.
- For the PriceRangeDimensions input box's Expression Builder, expand quote | Product Item | list price and click on OK.
- Click OK twice and, when you have finished the preceding steps, click on Save.
III. Creating measurement marks
You have to measure quantity values coming out of the enter quote details activity. To do that you need to create a measurement mark.
- Open the BPMN process.
- Go to Component Palette | BPM | Artifacts and click on measurement.
- Click between AssignToBizIndicators script task and DiscountCheck rules.
This will open Measurement Mark Properties.
- Set the Measurement Type as Single Measurement. As you have already defined business indicators in your process, you must add single measurement marks in the process where you want those business indicators.
- Enter Name as EnterQuoteMeasure.
- From the available business indicators, select Quantity[Measure].
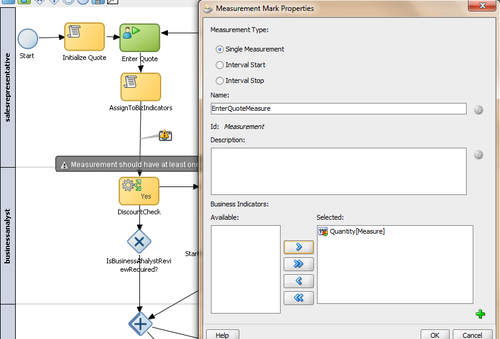
- Click on OK.
Note
Single measurement marks indicate the BPMN Service Engine to store the value of the measured business indicators associated to that measurement mark. The BPMN Service Engine also stores the values of the default process measures and the dimension business indicators at this point in the process.
IV. Adding counters
Counter marks are used to update the value of the counter business indicators defined for your process. Counter marks are used for auditing, identifying performance issues, and so on. When a token arrives at an activity that has a counter mark defined, the BPM Service Engine updates the value of its associated counters in the Process Analytics databases. Each time the BPM Service Engine updates a counter business indicator, it adds one unit to the current value. Here, you will track how many times a quote has to be revised due to rejections.
V. Deploying and Creating custom dashboards
- As all the ADF task forms are already available on the server, just deploy the SOA project.
- Log in to Oracle BPM workspace as a BusinessAnalyst user.
- Click on the new page icon in the top-right corner.
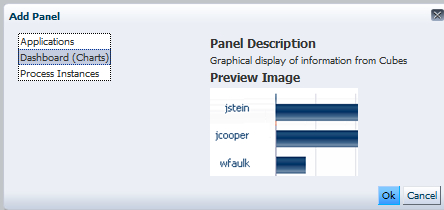
- Give the name of the panel as SalesQuoteCustomPage and click on the Add Panel button.

- In Add Panel, select Dashboard (Charts) and click on OK.
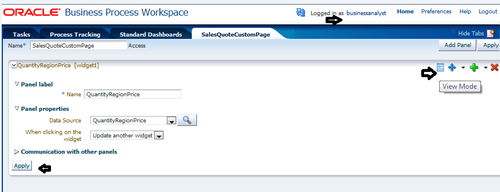
- Name the panel QuantityRegionPrice and click the magnifying glass ahead of Data Source.
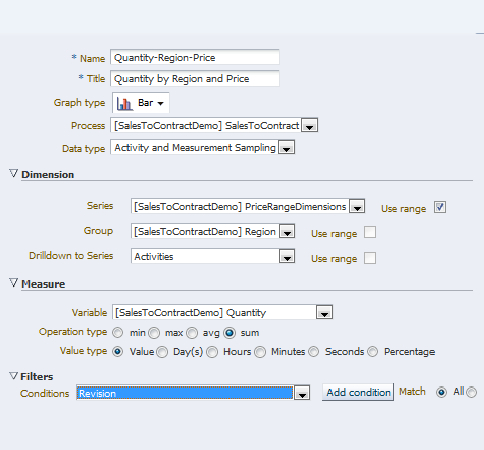
- Enter Quantity-Region-Price for Name and provide a Title as shown in the previous screenshot.
- Set the Graph type as Bar and select the SalesToContract process from the list.
- Data type must be Activity and Measurement Sampling.
- In the Dimension area, Series is PriceRangeDimensions and check Use range.
- Select Group as Region.
- In the Measure area, Variable will be Quantity and Value type will be Value.
- Click on OK.
- On the widget page, click on the Apply button.
- Click on View Mode in the top-right corner as shown in the following screenshot:
- You can find a new custom graph as shown in the following screenshot:
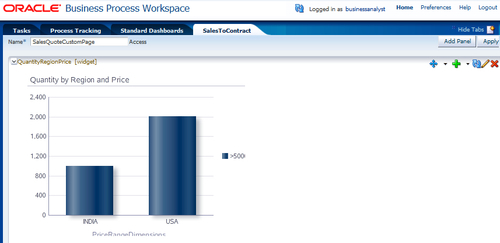
When the process token reaches measurement marks, it will measure the business indicators of type Measure in the process. While storing these values, the BPMN Service Engine will also store the value of the dimensions you defined in your process.
In the last section, you will build a custom dashboard using BPM workspace, which will be used to monitor your process. There you will use dimensions to group the values into different categories.
The BPMN Service Engine populates the predefined cubes each time it runs an activity or completes a process. The engine uses the sampling points configuration you defined to populate the cubes. If you configure a process not to generate sampling points, then the BPMN Service Engine does not store this information in the predefined cubes.
In this section, you will learn how to configure BPM process cubes.
If you use BPM process cubes to monitor the performance of your project, then you must enable the generation of the process cubes at developing time. When you deploy your application, Oracle BPM uses this configuration to enable BPM process cubes.
Use the following steps to enable BPM process cubes in a project:
- Go to BPM project navigator and right-click on the project.
- Select Project Preferences.
- In the Category tree, select Process Analytics Summary.
- In the Process Analytics Summary section, click on the Data Targets tab.
- Select Enable Cubes to enable cubes generation.
- Click on OK.