
R Shiny introduced a platform for R developers to create JavaScript-based web applications without having to get involved, or, for that, matter even be proficient in JavaScript.
In order to build our application, we will leverage R Shiny and create an interface to connect to the CMS Open Payments data we set up in the prior section.
If you are using your own R installation (locally), you'll need to install a few R packages. Note that if you are using a Linux workstation, you may need to install some additional Linux packages. For example, in Ubuntu Linux, you'll need to install the following. You may already have some of the packages, in which case you'll receive a message indicating that no further changes were needed for the respective package:
sudo apt-get install software-properties-common libssl-dev libcurl4-openssl-dev gdebi-core rlwrap
The Shiny application requires a few additional R packages to provide all its functionalities. Note that R packages are different from the Linux packages described previously. R packages, which number in the thousands, provide specialized functions for specific subject areas. For the web application, we will install a few R packages that will let us leverage some of the features in the web-based application.
The following steps outline the process of creating the web portal:
- Log in to RStudio. If you are using the Packt Data Science VM, go to http://localhost:8787/auth-sign-in. Log in with the user ID packt and password packt (same as user ID).

If you receive an error message stating that the site cannot be loaded, it may be due to the fact that the port forwarding has not been set up. To fix the issue, make the following changes:
- In VirtualBox, right-click on the VM and select Settings.
- Click on Network under Settings and expand the arrow next to Advanced:

- Click on Port Forwarding and add a rule to forward port 8787 from the VM to the host. The rule marked as Packt Rule has to be added, shown as follows:

- After logging in, you'll see the following screen. This is the interface for RStudio, which you'll be using to complete the exercise. We'll discuss R and RStudio in much more detail in later chapters, and this section illustrates the process to create the basic web application:

- Install the necessary R packages. Click on File | R Script and copy and paste the code below.
- Then, click on Source to execute the following lines:
install.packages(c("shiny","shinydashboard","data.table",
                   "DT","rjson","jsonlite","shinyjs","devtools"))

library(devtools)
devtools::install_github('kxsystems/rkdb', quiet=TRUE)

- Click on File|New File|Shiny Web App:

- Type in cmspackt under application name and click on Create:

This will create a cmspackt folder in the home directory, shown as follows:

- Copy and paste the following code into the app.R section:
# # This is a Shiny web application. You can run the application by clicking # the 'Run App' button above. # # Find out more about building applications with Shiny here: # # http://shiny.rstudio.com/

#
# This is a Shiny web application. You can run the application by clicking
# the 'Run App' button above.
#
# Find out more about building applications with Shiny here:
#
# http://shiny.rstudio.com/
#

library(shiny)
library(shinydashboard)
library(data.table)
library(DT)
library(rjson)
library(jsonlite)
library(shinyjs)
library(rkdb)

ui <- dashboardPage (skin="purple", dashboardHeader(title = "CMS Open Payments 2016"),
  dashboardSidebar(
  useShinyjs(),
  sidebarMenu(
  uiOutput("month"),
  uiOutput("company"),
  uiOutput("product"),
  uiOutput("state"),
  uiOutput("city"),
  uiOutput("showData"),
  uiOutput("displayColumns"),
  uiOutput("aggregationColumns"),
  actionButton("queryButton", "View Results")

  )
  ),dashboardBody(
  tags$head(tags$link(rel = "stylesheet", type = "text/css", href = "packt.css")),
  textOutput("stats"),
  dataTableOutput("tableData")
  ),
  title = "CMS Open Payments Data Mining"
)

# Define server logic required to draw a histogram
server <- function(input, output, session) {

  h <- open_connection("localhost","5001")

  minDate <- execute(h,"minDate")
  maxDate <- execute(h,"maxDate")
  startDate <- minDate
  endDate <- startDate + 31

cmsdata <- data.table(dbColumns=c("month","date","firstName","lastName","city","state","company","product","category","payment","paymentNature"), webColumns=c("Month","Date","First Name","Last Name","City","State","Company","Product","Category","Payment","Payment Nature"))

companyData <- execute(h,"exec distinct showCompany from alldata")

gbyVars <- c("Company","Product","State","City","Category","Payment Nature")

PLACEHOLDERLIST <- list(
    placeholder = 'Please select an option below',
    onInitialize = I('function() { this.setValue(""); }')
  )

PLACEHOLDERLIST2 <- list(
    placeholder = 'Select All',
    onInitialize = I('function() { this.setValue(""); }')
  )

output$month <- renderUI({
    dateRangeInput("date", label = 'PAYMENT DATE', start = startDate, end = endDate, min = minDate, max = maxDate)
  })

output$company <- renderUI({
    selectizeInput("company","COMPANY" , companyData, multiple = TRUE,options = PLACEHOLDERLIST)
  })

output$product <- renderUI({
    productQuery <- paste0("getShowInfo(`product;"",paste(input$company,collapse="|"),"")")
    productVals <- execute(h,productQuery)
    selectizeInput("product", "DRUG/PRODUCT" , productVals, multiple = TRUE,options = PLACEHOLDERLIST2)
  })

output$state <- renderUI({
    stateQuery <- paste0("getShowInfo(`state;"",paste(input$company,collapse="|"),"")")
    stateVals <- execute(h,stateQuery)
    selectizeInput("state", "STATE" , stateVals, multiple = TRUE,options = PLACEHOLDERLIST2)
  })

output$city <- renderUI({
    cityQuery <- paste0("getShowInfo(`city;"",paste(input$company,collapse="|"),"")")
    cityVals <- execute(h,cityQuery)
    selectizeInput("city", "CITY" , cityVals, multiple = TRUE,options = PLACEHOLDERLIST2)
  })

output$showData <- renderUI({
    selectInput("showData", label = "DISPLAY TYPE", choices = list("Show Data" = 1, "Aggregate Data" = 2), selected = 1)
  })

output$displayColumns <- renderUI({
    if (is.null(input$showData)) {selectInput("columns", "SHOW DATA",cmsdata$webColumns, selectize = FALSE, multiple = TRUE, size=11)}
    else if(input$showData == 1) {selectInput("columns", "SHOW DATA",cmsdata$webColumns, selectize = FALSE, multiple = TRUE, size=11) }
    else if(input$showData == 2) {selectInput("aggVars", "AGGREGATE DATA",gbyVars, selectize = FALSE, multiple = TRUE, size=6) }
  })

output$aggregationColumns <- renderUI ({ conditionalPanel(
    condition = "input.showData != 1",
    selectInput("aggData", "CALCULATE METRICS" , c("Total Payment","Number of Payments","Minimum Payment","Maximum Payment","Average Payment"), selectize = TRUE, multiple = TRUE)
  )})

getTableData <- eventReactive(input$queryButton, {
    disable("queryButton")
    queryInfo <- (list(date=as.character(input$date),company=input$company, product=input$product, state=input$state, city=input$city,columns=cmsdata$dbColumns(cmsdata$webColumns %in% input$columns),showData=input$showData))
    if (input$showData !=1) {queryInfo <- c(queryInfo, list(aggVars=cmsdata$dbColumns(cmsdata$webColumns %in% input$aggVars), aggData=input$aggData))} else {queryInfo <- c(queryInfo)}
    JSON <- rjson::toJSON(queryInfo)
    getQuery <- paste0("getRes "",URLencode(JSON),""")
    finalResults <- execute(h,getQuery)
    enable("queryButton")
    print (finalResults)
    fres <<- finalResults
    print (class(finalResults((1))))
    print (finalResults)
    finalResults
  })

 output$tableData <- renderDataTable({ datatable(getTableData()((1)))})
 output$stats <- renderText({(getTableData())((2))})

}

# Run the application
shinyApp(ui = ui, server = server)
- Click on New Folder in the lower-right box:

- Rename the new folder to cmspackt/www, shown as follows:

- Click on File | New File |Text File:

- Copy and paste the following code:
.shiny-text-output, .shiny-bount-output {
  margin: 1px;
  font-weight: bold;
}

.main-header .logo {
height: 20px;
font-size: 14px;
font-weight: bold;
line-height: 20px;
}

.main-header .sidebar-toggle {
  padding: 0px;
}

.main-header .navbar {
  min-height: 0px !important;
}

.left-side, .main-sidebar {
  padding-top: 15px !important;
}

.form-group {
  margin-bottom: 2px;
}

.selectize-input {
  min-height: 0px !important;
  padding-top: 1px !important;
  padding-bottom: 1px !important;
  padding-left: 12px !important;
  padding-right: 12px !important;
}

.sidebar {
  height: 99vh;
  overflow-y: auto;
}

section.sidebar .shiny-input-container {
    padding: 5px 15px 0px 12px;
}

.btn {
  padding: 1px;
  margin-left: 15px;
  color:#636363;
  background-color:#e0f3f8;
  border-color:#e0f3f8;
}

.btn.focus, .btn:focus, .btn:hover {
  color: #4575b4;
  background-color:#fff;
  border-color:#fff;
}

pre {
    display: inline-table;
    width: 100%;
    padding: 2px;
    margin: 0 0 5px;
    font-size: 12px;
    line-height: 1.42857143;
    color: rgb(51, 52, 53);
    word-break: break-all;
    word-wrap: break-word;
    background-color: rgba(10, 9, 9, 0.06);
    border: 1px rgba(10, 9, 9, 0.06);
    /* border-radius: 4px */
}

.skin-red .sidebar a {
    color: #fff;
}

.sidebar {
  color: #e0f3f8;
  background-color:#4575b4;
  border-color:#4575b4;
}
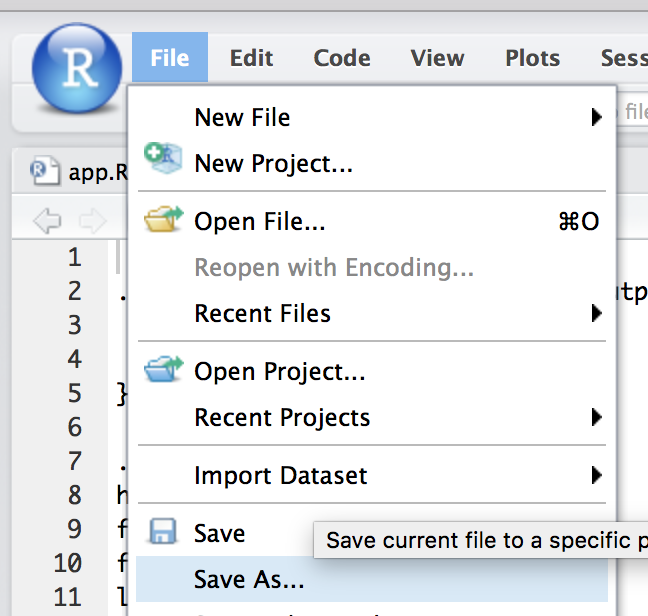
- Click on File | Save As to save the file, as follows:
- Save as /home/packt/cmspackt/www/packt.css, shown as follows:

Your application is now ready for use!