
In this section, we will use Hive to analyze the import prices of oil in countries across the world from 1980-2016. The data is available from the site of the OECD (Organisation for Economic Co-operation and Development) at the URL shown in the following screenshot:

The actual CSV file is available at https://stats.oecd.org/sdmx-json/data/DP_LIVE/.OILIMPPRICE.../OECD?contentType=csv&detail=code&separator=comma&csv-lang=en.
Since we'll be loading the data in Hive, it makes sense to download the file into our home directory via the terminal in our Cloudera Quickstart CDH environment. The steps we'd execute are as follows:
- Download the CSV file into the CDH environment:

# Download the csv file
cd /home/cloudera;
wget -O oil.csv "https://stats.oecd.org/sdmx-json/data/DP_LIVE/.OILIMPPRICE.../OECD?contentType=csv&detail=code&separator=comma&csv-lang=en"
- Clean the CSV file. Data cleansing is an area of core importance in data science. In practice, it is very common to receive files that will require some level of cleansing. This is due to the fact that there could be invalid characters or values in columns, missing data, missing or additional delimiters, and so on. We noted that various values were enclosed in double-quotes ("). In Hive, we can ignore the quotes by specifying the quoteChar property whilst creating the table. Since Linux also offers simple and easy ways to remove such characters, we used sed to remove the quotation marks:
[cloudera@quickstart ~]$ sed -i 's/"//g' oil.csv
Moreover, in our downloaded file, oil.csv, we observed that there were non-printable characters that could cause issues. We removed them by issuing the following command:
[cloudera@quickstart ~]$ tr -cd '11121540-176' oil_.csv > oil_clean.csv
(Source: http://alvinalexander.com/blog/post/linux-unix/how-remove-non-printable-ascii-characters-file-unix)
Finally, we copied the new file (oil_clean.csv) to oil.csv. Since the oil.csv file already existed in the same folder, we were prompted with an overwrite message and we entered yes:
[cloudera@quickstart ~]$ mv oil_clean.csv oil.csv
mv: overwrite `oil.csv'? yes
- Log in to Cloudera Hue:
Click on Hue on the Bookmarks bar in the browser. This will bring up the Cloudera login screen. Log in using ID cloudera and password cloudera:

- Click on Hue from the drop-down menu on Quick Start at the top of the Hue login window:

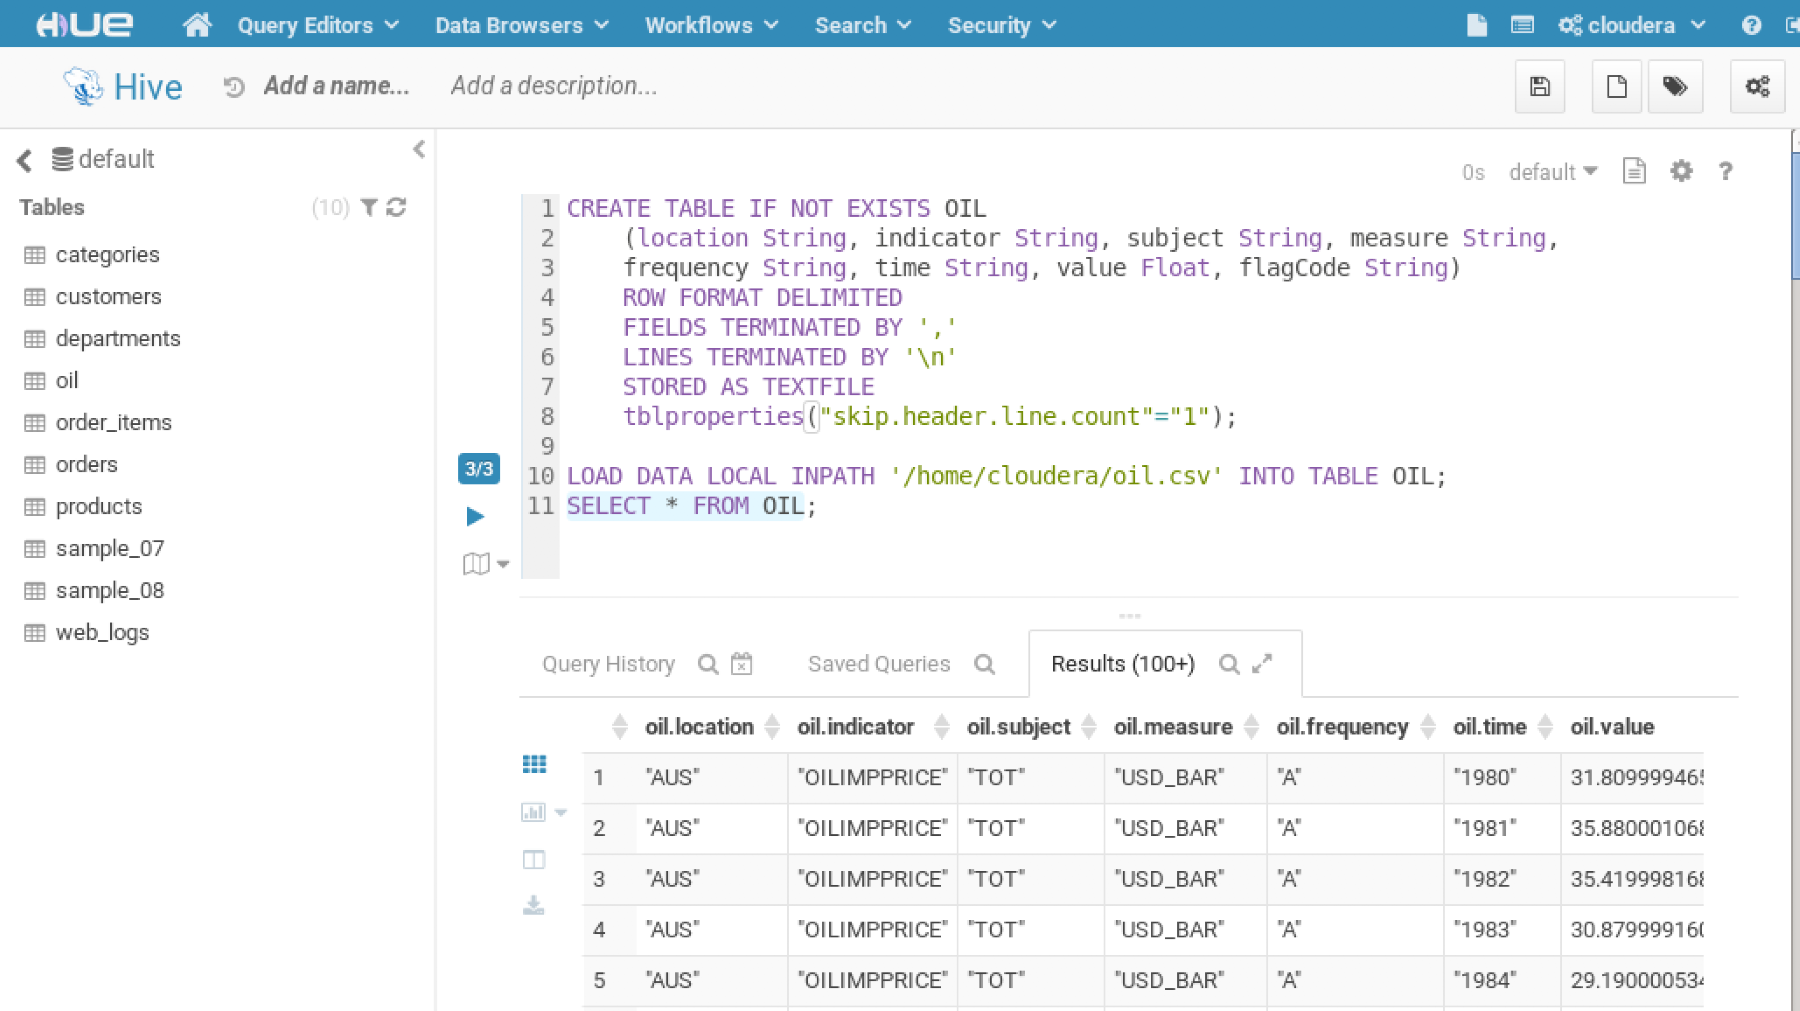
- Create the table schema, load the CSV file, oil.csv, and view the records:
CREATE TABLE IF NOT EXISTS OIL
   (location String, indicator String, subject String, measure String,
   frequency String, time String, value Float, flagCode String)
   ROW FORMAT DELIMITED
   FIELDS TERMINATED BY ','
   LINES TERMINATED BY '
'
   STORED AS TEXTFILE
   tblproperties("skip.header.line.count"="1");

LOAD DATA LOCAL INPATH '/home/cloudera/oil.csv' INTO TABLE OIL;
SELECT * FROM OIL;
- Load the oil file.
- Now that the table has been loaded into Hive, you can run miscellaneous Hive commands using HiveQL. A full set of these commands is available at https://cwiki.apache.org/confluence/display/Hive/LanguageManual.
For instance, to find the maximum, minimum, and average value of oil prices in each country from 1980-2015 (the date range of the dataset), we can use familiar SQL operators. The query would be as follows:
SELECT LOCATION, MIN(value) as MINPRICE, AVG(value) as AVGPRICE,
MAX(value) as MAXPRICE
FROM OIL
WHERE FREQUENCY LIKE "A"
GROUP BY LOCATION;
Here is the screenshot of the same:

In similar ways, we can use an array of other SQL commands. The Hive Manual provides an in-depth look into these commands and the various ways data can be saved, queried, and retrieved.
Hue includes a set of useful features such as data visualization, data download, and others that allow users to perform ad hoc analysis on the data.
To access the visualization feature, click on the visualization icon underneath the grid icon in the results section, as shown in the following screenshot:

Select Scatter. In Hue, this type of chart, also known more generally as a scatterplot, allows users to create multivariate charts very easily. Different values for the x and y axes, as well as scatter size and grouping, can be selected, as shown in the following screenshot:

The following is a simple pie chart that can be constructed by selecting Pie in the drop-down menu:
