
Applying center and scale function on numeric columns is often done in order to standardize data and remove the effect of large variations in the magnitude or differences of numbers. You may have encountered this in college or university courses where students would be graded on a standardized basis, or a curve.
For instance, say an exam paper was unusually difficult and half of all the students in a class of 10 students received scores below 60 - the passing rate set for the course. The professor can either a) make a determination that 50% of the students should re-take the course, or b) standardize the scores to find how students performed relative to one another.
Say the class scores were:
45,66,66,55,55,52,61,64,65,49
With the passing score set at 60, this implies that the students who scored 45, 55, 55, 52 and 49 will not successfully complete the course.
However, this might not be a truly accurate representation of their relative merits. The professor may alternatively choose to instead use a center-and-scale method, commonly known as standardization, which involves:
- Finding the mean of all the scores
- Subtracting the mean from the scores
- Dividing the result by the standard deviation of all the scores
The operation is illustrated below for reference.
The mean of the scores is 57.8. Hence, subtracting 57.8 from each of the numbers produce the numbers shown in the second row. But, we are not done yet. We need to divide the numbers by the standard deviation of the scores to get the final standardized values:
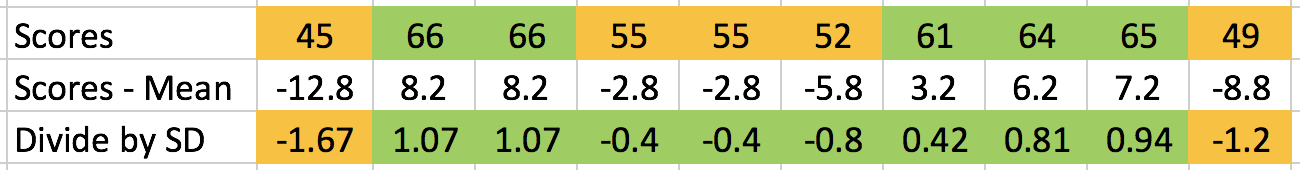
Dividing by the SD (standard deviation) shows that there were only two students whose scores were below one standard deviation across the range of all the test scores. Hence, instead of five students who do not complete the course successfully based on the raw numbers, we can narrow it down to only two students.
Although this is a truly simple operation, it is not hard to see that it is very effective in smoothing out large variations in data.
Centering and scaling can be performed very easily in R using the scale command as shown here:
> scores <- c(45,66,66,55,55,52,61,64,65,68)
> scale(scores)
            [,1]
 [1,] -1.9412062
 [2,]  0.8319455
 [3,]  0.8319455
 [4,] -0.6206578
 [5,] -0.6206578
 [6,] -1.0168223
 [7,]  0.1716713
 [8,]  0.5678358
 [9,]  0.6998907
[10,]  1.0960552
attr(,"scaled:center")
[1] 59.7
attr(,"scaled:scale")
[1] 7.572611