
You might have noticed the company which we are using in this project has five locations: New York, Amsterdam, Tokyo, Sydney, and Berlin. If you want to talk about these five locations in your presentation, you can present them in a list, but why not make it a bit more visual?
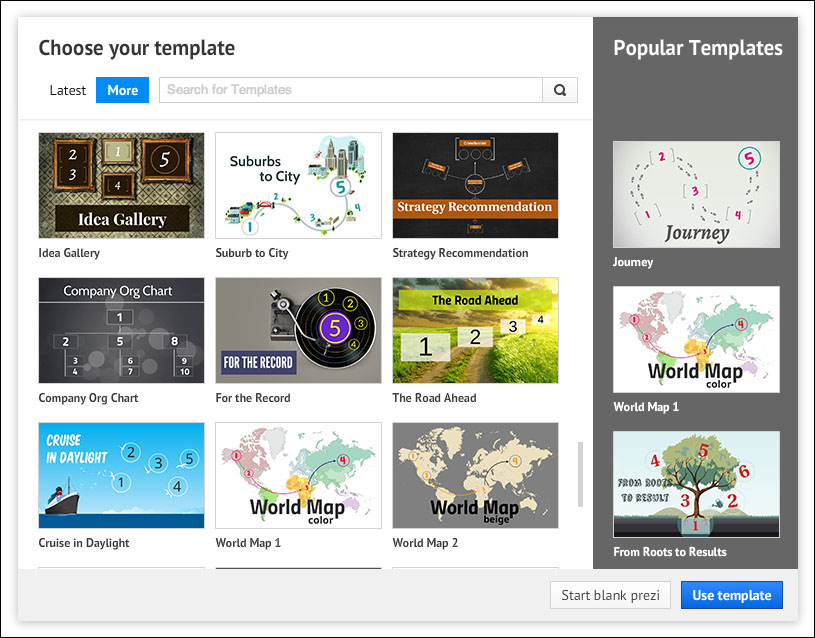
In this task, we'll be using an existing template of Prezi. You can use World Map 1 or World Map 2. You can find these templates in the Classic category.
- Go to Your prezis and open a New prezi.
- Choose the template category More and select either World Map 1 or World Map 2 as shown in the following screenshot:
- Delete the existing path from the prezi and remove all the unnecessary objects.
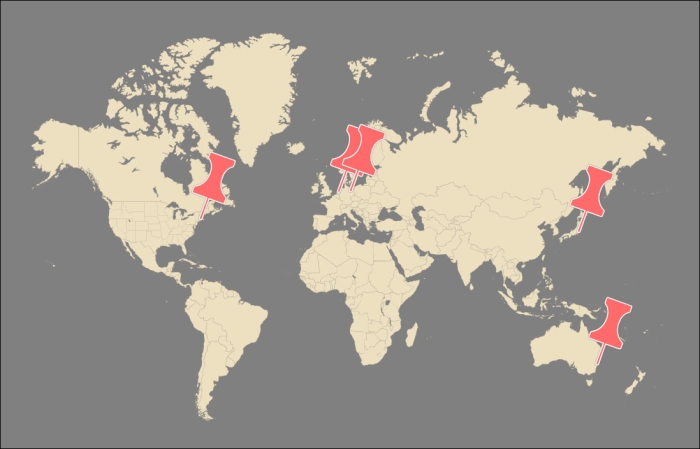
- Navigate to Insert | Symbols & shapes... and choose (for instance) the category Stickers. Drag a pin to the world map. Position the pin to a location, make it the right size, and rotate it a bit. Select it and duplicate it four times with the Ctrl/Command + D keys. Also position the other pins, as shown in the next screenshot.
You can use all kind of symbols to visualize locations. The most commonly used symbols are pins, flags, and markers.
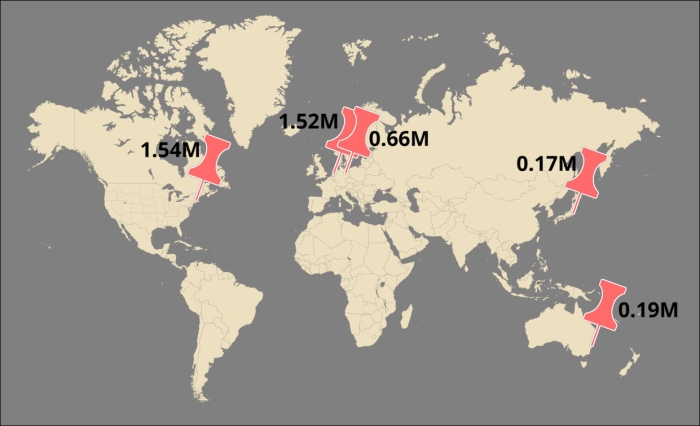
If it adds value, you can add additional information to the pins, for instance, the sales volumes per location for 2013.
..................Content has been hidden....................
You can't read the all page of ebook, please click here login for view all page.