
- Prezi HOTSHOT
- Table of Contents
- Prezi HOTSHOT
- Credits
- About the Author
- Acknowledgments
- About the Reviewers
- www.PacktPub.com
- Preface
- 1. The Fastest Way to Go from an Idea to a Prezi
- 2. Present Yourself with a Prezumé
- 3. I Want to Use Prezi for My Lessons
- 4. Designing a Serious Corporate Presentation
- Mission briefing
- Defining your strategy
- Brainstorming the content
- Defining the title and keywords
- Thinking of a good concept
- What's the story you want to tell?
- Creating your storyboard
- Defining colors, fonts, and other design issues
- Creating your presentation
- Mission accomplished
- A Hotshot challenge
- 5. Presenting in the PechaKucha Style
- 6. Presenting Boring Stuff in a Better Way
- 7. I Really Like Those Hand-drawn Prezis
- 8. Let's Animate Your Prezi
- 9. More Interactivity with the Prezi Player API
- 10. Creating an Award-winning Prezi
- Index
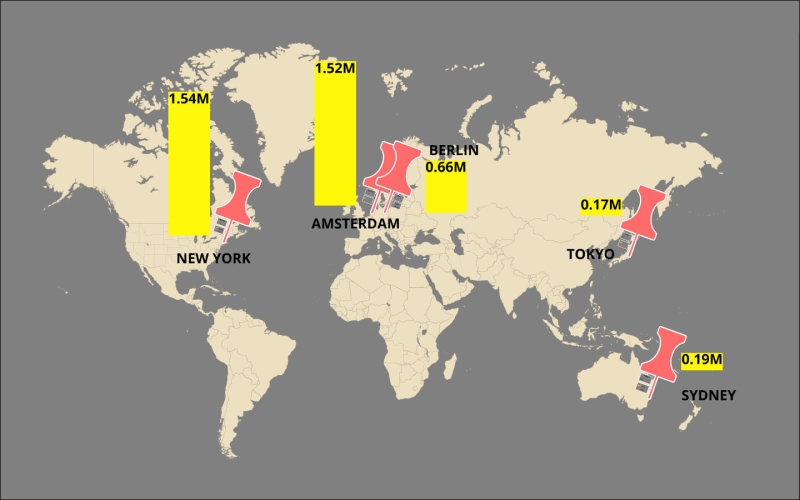
In this project, we taught you how to present data in a better more attractive way. It's important to not just show the numbers. Think carefully about what you want to show and then decide how you want to show it. The numbers should support your story, not kill it.
We showed you how to create great graphs, visualize locations, create interesting timelines, limit your lists, and visualize ratings. The following screenshot is an overview:
The following screenshot is a detailed view:

-
No Comment
..................Content has been hidden....................
You can't read the all page of ebook, please click here login for view all page.