Introduction
In this introduction
Jaw-Dropping New Excel Features 2
Where Are My Menus and Toolbars? 6
Conventions Used in This Book 17
I get to play the role of comic book superhero. As the “mighty man of macro,” I take the stage and wow people with the amazing things they can do in Excel. In small teaching settings, I ask everyone to answer the most pointless question: “What version of Excel are you using?”
Why is this a pointless question? Because it simply does not matter. If the answer is any version of Excel that has come out in the past decade—going back to Excel 97—then every tip I have to share will work.
Microsoft has asked us to upgrade from Excel 97 to 2000, 2000 to XP, and XP to 2003, all without giving Excel fans much new content. Yes, they changed the PivotTable Wizard in Excel 2000, added function tips in XP, and began to support XML in 2003. But there was really nothing new.
I have long theorized that once Microsoft had driven a stake through the heart of Lotus 1-2-3, there was simply no need to innovate. Today, Microsoft is aware that Star Office is becoming a credible threat, and the Excel development team has responded with a vengeance.
Jaw-Dropping New Excel Features
Excel 2007 is a complete rewrite of the program. The new feature set is amazing. You can now do far more with Excel and do it far faster than ever before. The following sections describe just a few of the new features of Excel 2007.
The Massive Grid
For the past decade, we’ve dealt with 65,536 rows by 255 columns on a worksheet. 16.7 million cells sounds like a lot, but it is amazing how many times people encounter a dataset with 70,000 rows or 300 columns. Excel was almost big enough, but not quite. For many people, Access was only used as a product of desperation when they had more rows than Excel could accommodate.
A few years ago, I was able to spend a few hours with the Microsoft Excel project managers. They revealed that they were thinking of adding more rows and asked what I thought would be a reasonable figure. I remember telling them that if they didn’t at least double the rows—going to at least 131,072—the increase would not be impressive. They also let on that many people wanted to have three years of daily dates plus totals stretching across the columns. I walked away from that meeting predicting a new grid of 131,000 rows by 1,024 columns.
At the MVP Summit in September 2005, Microsoft gave us the first look at the new version of Excel. I was blown away by the size of the grid: 1,048,576 rows by 16,384 columns. That is more than 17 billion cells on one worksheet! I was sitting next to Ken Wright, an Excel MVP from England. In his British accent, Ken dryly quipped, “...and if we fill that up, we could always just go to Sheet2.”
The enormity of 17 billion cells is staggering. There is not a PC you could buy today that would hold 17 billion formulas. Microsoft has truly come out with a new file format that will last for the next 10 to 15 years. I am sure that by the time Excel 15 comes out, everyone will think it is commonplace to load up a half million records of transactional data.
To help you picture the situation, Figure I.1 contains an XY chart. The solid black rectangle in the upper-left corner is the relative size of Excel 2003. The large white square that makes up the rest of the chart is the relative size of Excel 2007. For a decade, you’ve been living in a tiny patch of real estate, and now the bounds are nearly endless.
Figure I.1. The tiny black rectangle is the size of the old Excel compared to the new Excel.
To learn more about the Big Grid, see Chapter 7.
Fantastic Data Visualizations
Excel 97 introduced conditional formatting. It was hard to use. A number of gotchas made it hard to figure out whether your conditional formatting was really working. When you figured out how to successfully set up conditional formatting, the feature was limited to three conditions. I eventually dropped this out of my power Excel seminar: It was too obscure, too hard, and not worth the effort to try to teach it.
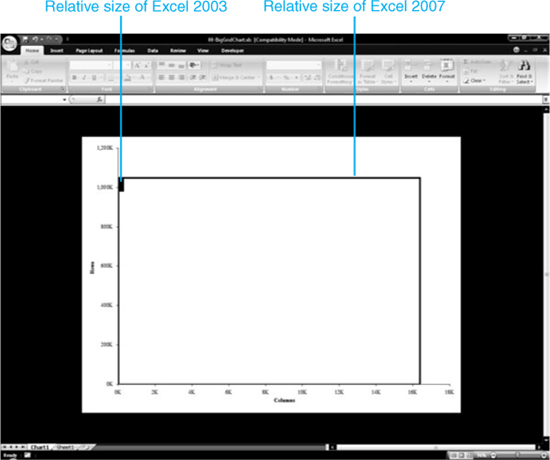
Conditional formatting gets a complete makeover in Excel 2007. You now have one-click access to gradients, heat maps, and in-cell data bars. Managers’ eyes tend to glaze over when they are presented with a table of numbers. Add a full-color data visualization, and the meaning of a table can spring to life, as shown in Figure I.2. For more about data visualization, see Chapter 9.
Figure I.2. Just a few clicks can create this heat map. While heat maps can measure any numeric range, this one ironically measures temperature.
Case Study: Backward Functionality Compatibility
The new data visualizations are designed to bring conditional formatting to the masses. What if you were one of the people who had taken the time to learn the old conditional formatting system?
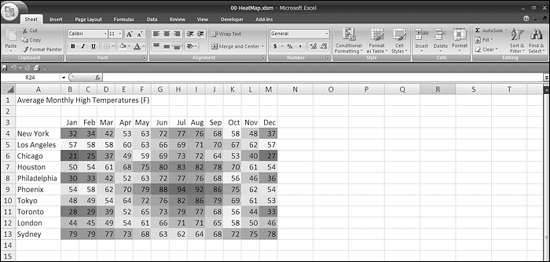
Figure I.3 shows the Excel 2003 method for highlighting all rows that are above average in a range. Finding the Formula Is version of the conditional formatting dialog was beyond 99% of the Excel customers.
Figure I.3. Figuring out conditional formatting in Excel 2003 was difficult.
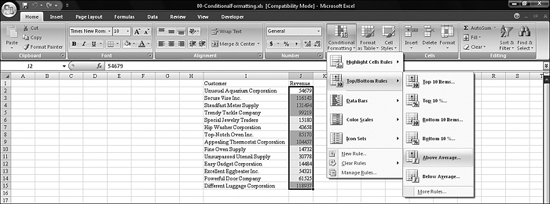
Excel 2007 provides options to highlight cells that are above average with just a few mouse clicks. A novice Excel customer could nearly duplicate Figure I.3 by selecting Home, Conditional Formatting, Top/Bottom Rules, Above Average, as shown in Figure I.4.
Figure I.4. Conditional formatting is now just a few clicks away.
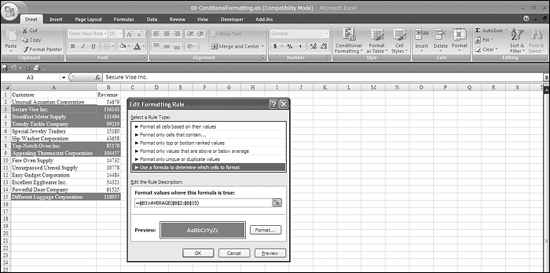
However, if you are a power user and still want to build conditional formatting the old way, you are more than welcome to. Near the bottom of each icon is a More Rules selection that takes you back to the familiar dialog boxes from prior versions of Excel. The new conditional formatting dialog, shown in Figure I.5, is not exactly like the old version shown in Figure I.3, but after you select the intuitive words Use a Formula to Determine Which Cells to Format, you are back in familiar territory.
Figure I.5. You can do old-style conditional formatting in the new dialog.
Power users should be relieved that they can easily get back to their familiar dialog boxes.
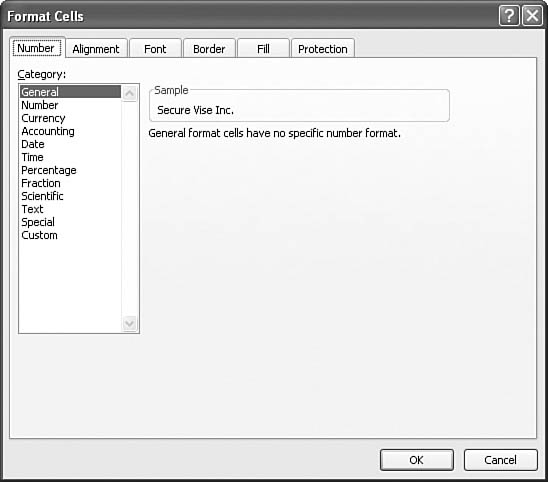
Look for the arrow icon in the bottom-right corner of many groups on the ribbon (you’ll learn more about ribbons later in this Introduction). Clicking this icon is the fast shortcut back to the old-style dialog box, which is shown in Figure I.6.
Figure I.6. You can click the expand icon in the lower right corner of most groups’ + sign in the triangle to access the old-style dialog boxes.
Twenty-First Century Charting
The charting in Excel 2003 is antique. It really had not changed in 15 years. Microsoft has provided a great new charting and diagramming engine and applied it to all Office 2007 components.
Features such as beveled edges, glow, and metallic bars are now just a click away. Rather than trying to format each element, you can simply hover over any of the 20 prepackaged themes to create charts that match your corporate color scheme and other designs. For more about charting, see Chapter 15.
Business Intelligence
Excel 2007 has a new, easier-to-use interface for the pivot table engine. You can now quickly apply data visualizations to a pivot table. In addition, if you regularly build pivot tables from OLAP cube datasources, you can now convert a pivot table into a range of high-powered formulas that will query certain dimensions of the cube. For more about Business Intelligence, see Chapter 10.
Easier-to-Enter Formulas and Functions
Anyone who dabbled with the VBA programming language in Excel has enjoyed the AutoComplete functionality in VBA for several versions of Excel. This technology now comes to the user interface side of Excel, with AutoComplete technology guiding you through the entry of functions and formulas. For more about tables and easier formulas, see Chapter 8.
All the functions formerly housed in the Analysis ToolPack have now been promoted to full-fledged members of the Excel family. It was frustrating to find a cool function in the Analysis ToolPack but not know whether someone in your recipient list had failed to enable this add-in.
Excel 2007 replaces the Excel 2003 list functionality with new table functionality. This powerful option renders obsolete the need to double-click the fill handle to copy formulas. It also makes the concept of English-language formulas automatic for formulas next to a table.
Where Are My Menus and Toolbars?
Everything we’ve discussed so far has been a good change. The grid size is amazing. The ease of use is amazing. So why did Microsoft have to drop the other shoe and remove the familiar File, Edit, View, Insert, Format, Tools, Data, Window, and Help menus from the top of the Excel window?
This is the single biggest problem with Excel 2007. I guarantee that by the time Excel 14 or Excel 15 rolls around, you will love it, but right now, right here, in the next two weeks, you will curse Microsoft more than you have ever cursed Microsoft.
The menu, toolbars, and task pane have been completely removed from Excel 2007.
Stop. Read that again.
The menu, toolbars, and task pane have been completely removed from Excel 2007.
If you are an intermediate Excel user, this change means that all the toolbar functionality you use everyday has been removed. This is a shocking change. It will take you a couple weeks to get used to it. Chapters 1 through 6 will cover this change in detail.
Although you won’t like it at first, it might help to understand why Microsoft had to do away with the old system.
Why Couldn’t They Leave Well Enough Alone?
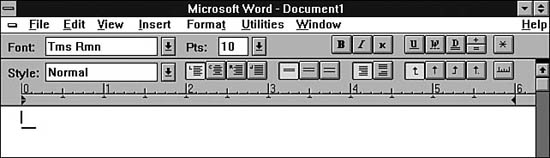
Figure I.7 shows a screenshot of Word for Windows 1.0 from 1989. There were 2 toolbars, sporting a total of 26 icons.
Figure I.7. Word 1.0 featured 26 icons on two toolbars.
Word 2.0 in 1992 grew slightly, to 37 icons on 2 toolbars. By 1994, the common screen resolution had jumped from 640×480 to 800×600, and the number of toolbars had grown to eight. Context (right-click) menus were added. The icons were so confusing that Microsoft added ToolTips to each toolbar. Plus, Microsoft let you opt out of toolbars altogether with the new context menus.
Word 95 had nine toolbars. Word 97 had 18 toolbars and introduced cascading menus; there were too many commands to fit on a single list of menus, so you had to go searching through fly-out menus that populated each toolbar.
As new functionality was added, the number of toolbars continued to grow. A whole new feature called the task pane was introduced in Excel 2002. Microsoft was now using the top, bottom, and right edges of the screen to try to shoehorn in all the features.
Excel 2003 had 1,223 commands on 127 commandbars. If you tried to display them all at once, you would not be able to see the Excel grid at all, as shown in Figure I.8.
Figure I.8. By Excel 2003, the number of toolbars had grown out of control.
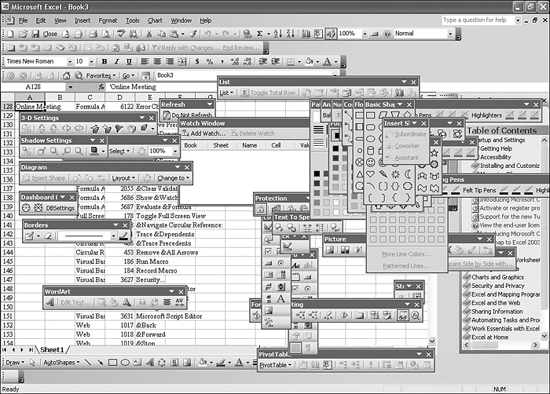
Furthermore, by Excel 2003, a lot of the toolbars were somewhat unpredictable. The Drawing toolbar was usually displayed at the bottom of the screen, but it could be moved anywhere on a particular computer. The List toolbar in Excel 2003 tended to come and go, without any rhyme or reason. Some toolbars would hang around long after they were needed (for example, there is no need to have the Picture toolbar displayed if there is not a picture on the worksheet, but Excel 2003 didn’t seem to know that). Some crazy add-in on my computer kept disabling the PivotTable toolbar, which meant I wrote a couple lines of VBA to get it back every time I wanted to create a pivot table.
Microsoft figured that if it didn’t make some sort of big change, this problem would only get worse in Excel 2007, Excel 14, Excel 15, and so on. Jensen Harris at Microsoft had predicted that there would be more than 100 different task panes shipping with Office 2007. Microsoft was, as always, intent on making the software more feature rich, but there was no real estate left in order to add these commands.
The Most Requested New Features...
Microsoft conducts many usability studies. It visits companies, watches people use Office, and then asks them what new features would make their jobs easier. The common thread: People asked for features that had been added in Excel 97. But no one could find them.
Imagine how frustrated you would be if your boss walked in and asked you to produce the XYZ report. You would respond for the 400 millionth time, “I already gave you that report!” The boss would keep repeating this routine every day for 10 years. Very frustrating, indeed.
I can judge audience reaction in my seminars by the gasps. If I hear a gasp, it means that someone in the audience has been wasting hours each day and will be able to reduce that to a button click tomorrow at work. The “gasp” items—for example, automatic subtotals, the fill handle—were all added 10 years ago. The people in my seminars aren’t stupid. There is clearly a problem when the average Joe can’t find the features that are in Excel.
Microsoft would win big if it could allow people to actually find the powerful features that it added a decade ago. For a whole generation of beginning to intermediate users, all the power in Excel would suddenly be “new to you.”
A Scientific Approach to Popular Features
Do you remember when Office introduced adaptive menus back in Excel 2000? The idea was that the menus had become too complex, so they would show you only the most popular menu items.
Do you have any idea how Microsoft decided what was most popular? It guessed. But it failed miserably.
A couple days after you installed Office 2003, an innocuous message would pop up, asking “Would You Like to Help Make Office Better?” If you chose Yes, Office collected information about how you selected commands—which toolbar buttons you pressed and in what order, whether you pasted by right-clicking or by pressing Ctrl+V? Since Office 2003 shipped, Microsoft has collected information on 1.3 billion sessions. Externally, this is called the Customer Experience Improvement Program. Internally, it is Service Quality Monitoring (SQM). The data from this program is SQM (pronounced “skwim”) data. This is a fantastic amount of information about how real people use the software in real-life situations.
One interesting example is that power users had a hunch that everyone pasted by using Ctrl+V or by using the right-click context menu. There was a move to remove the Paste icon from the ribbon. In response to this hunch, someone pulled out the SQM data. Despite there being much faster ways to execute a paste, the toolbar button for paste was the most-used button in all of Office! Rather than rely on a hunch and remove the Paste button, Microsoft has vast amounts of statistical data and knew which were the most popular commands.
Here’s another example: The Superscript button isn’t even installed on the Formatting toolbar in Word 2003. A person has to customize the toolbar to add the icon. However, this customized button is used more frequently than 30% of the default buttons on the Formatting toolbar.
When you understand that Microsoft wasn’t just being capricious in selecting the toolbar icons to use, the removal of the well-known top-level menus starts to make a lot more sense.
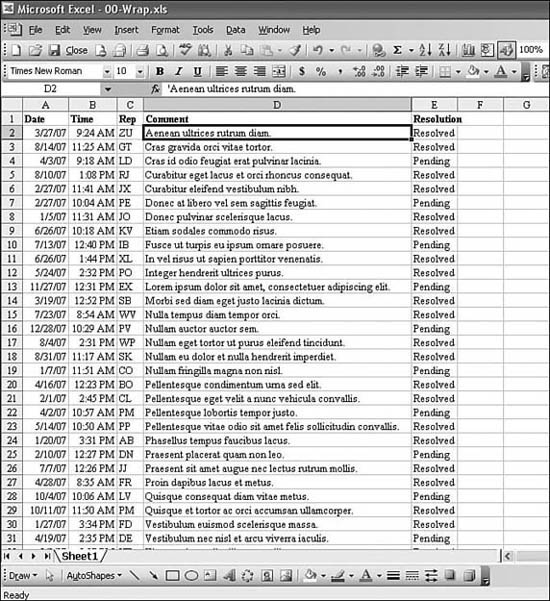
Let’s look at an example that affects Excel customers. Figure I.9 shows a typical dataset in Excel 2003. One column holds free-form text, so it ends up being too wide.
Figure I.9. Column D is too wide.
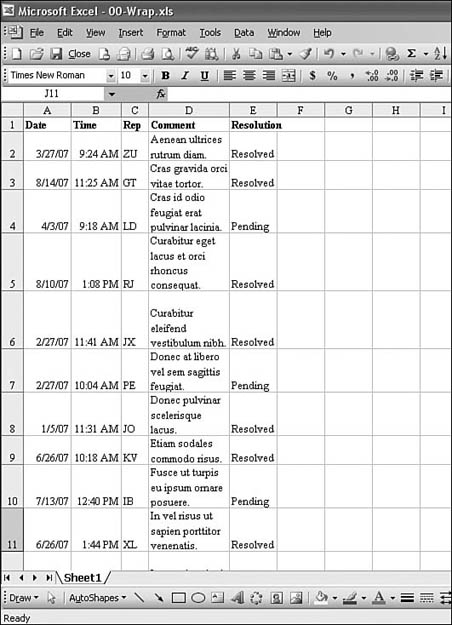
My usual tack in such a situation is to select Column D, turn on Word Wrap, and make the column narrower. As shown in Figure I.10, that fixes Column D, but then all the other columns have problems because I really want the words lined up with the top of each cell.
Figure I.10. Word Wrap is fine, but now all the other columns are bottom-justified, and they don’t line up with the top of the paragraphs in Column D.
To fix the problems that now exist in this example, I could select all cells and then choose Format, Cells, Alignment; change the vertical alignment to Top; and then click OK. I know most of the keyboard shortcuts, so I can accomplish all this with 19 keystrokes and two trips to the Format Cells dialog box. I’ve never complained about this. It is just the way I had to do it in Excel 2003. I bet that you’ve repeated these steps a few times in your career.
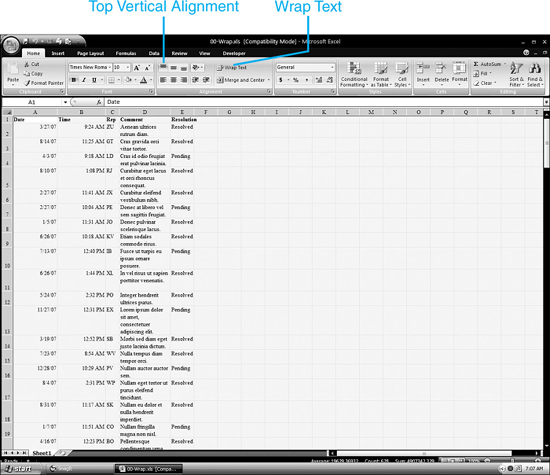
Well, a lot of people sending SQM data to Microsoft must have been having exactly the same problem! As shown in Figure I.11, Excel 2007 now has a group on the ribbon that contains an icon for Wrap Text as well as an icon for top vertical alignment. On the face of it, this is not a big thing. But it means I can fix the problem described earlier with 2 clicks instead of 19 keystrokes. This type of change will really make me hate going back to Excel 2003 every time I have to handle data there.
Figure I.11. Excel 2007 lets you handle the text wrapping and alignment task without ever touching a dialog box.
Clearly, enough people had SQM data turned on and had the same problem I had. Microsoft was able to detect that probably a million people were feeling the same pain on this issue, so it made life far easier for all Excel customers.
So although the initial reaction is to complain that Microsoft took away the old toolbars and menu, you need to stay calm and give the new design a chance. You will come to appreciate the thought (and data analysis) that was put into the decisions.
Introducing the Ribbon
Instead of the menus and Standard and Formatting toolbars, Excel now has the ribbon. The ribbon is designed based on the thought that most people are using 1,280×1,024, or even 1,024×768, monitors. Instead of being a meaningless array of tiny icons, the ribbon uses lots of words and icons. Instead of being a single horizontal row of icons, the ribbon supports a two-dimensional layout of icons. Really popular features are large icons. Other functions can be grouped into related groups of icons.
The ribbon is tall, but it is no taller than the old setup, with the menus and the Standard and Formatting toolbars. Furthermore, you can completely hide the ribbon by pressing Ctrl+F1.
Although only one ribbon is visible at a time, there are actually seven ribbons available all the time: Home, Insert, Page Layout, Formulas, Data, Review and View. The most important stuff is on the left-most ribbon, so when you are looking for something, you should start there.
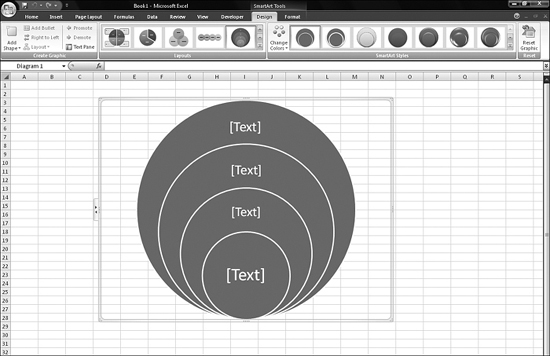
Depending on what is selected, more ribbon options appear. When you are adding a new business graphic (SmartArt), two new ribbons appear for SmartArt tools—Design and Format—as shown in Figure I.12. These ribbons appear only when the graphic is selected. When you go back to selecting a cell in your worksheet, the extra ribbons disappear.
Figure I.12. Two new ribbons appear anytime a SmartArt graphic is selected.
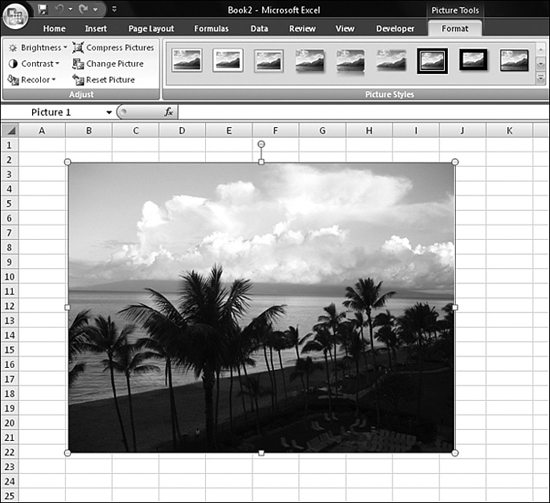
Extra ribbons appear for pivot tables, charts, pictures, and so on. In each case, the ribbon appears only as long as the pivot table, chart, picture, and so on is selected. As shown in Figure I.13, the Picture Tools ribbon offers functionality that is light-years ahead of previous versions of Excel, but it is not in the way until you actually insert a picture in your worksheet.
Figure I.13. The temporary ribbons often provide incredibly powerful tools.
Ribbon Limitations
The ribbon is always at the top. In recent versions of Excel, you could have toolbars docked at the bottom, the sides, or floating over your document. This functionality is no more. The ribbon is permanently at the top.
In previous versions of Excel, you could create a new custom toolbar with your favorite icons and have it floating over your document. This functionality is no more. There now is a Quick Access toolbar where you can add your favorite icons, but this toolbar is always at the top of the screen, either immediately below or immediately above the ribbon.
Ribbon Tricks
As you resize the Excel window, the ribbon becomes progressively more compact, but it does this intelligently. Figure I.14 shows the Home ribbon at a full 1,280 width. Figures I.15 and I.16 show the Home ribbon at progressively smaller window sizes. Even at a tiny window size, Excel still tries to intelligently group the major icons on the ribbon into a logical sequence, as shown in Figure I.17.
Figure I.14. The Home ribbon at full size shows every icon.

Figure I.15. Initially, some groups become smaller. Notice that the Cells group now has three small icons.
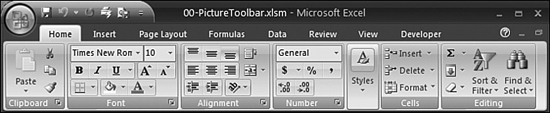
Figure I.16. The Quick Formatting and Cells groups now become drop-down icons to the entire toolsets.
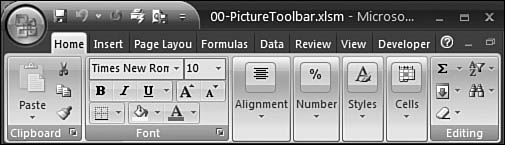
Figure I.17. Eventually, most groups become drop-down icons.
It is interesting to note that even as the icons get smaller, Microsoft opted to keep words and pictures for the icons. It has realized that people don’t learn or remember the functionality based on a single 16×16 unlabeled icon. Learn more about the ribbon in Chapter 1.
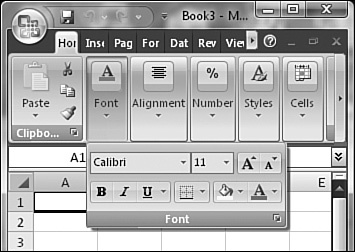
The Mini Toolbar
If you were lucky enough to use Outlook 2003, you know that Microsoft added one really cool feature to that version. When a new email arrives in Outlook 2003, a small rectangle appears in the lower-right corner of your screen. The rectangle fades into view and lists the sender of the email and the first few sentences of the message. If you move your mouse toward the rectangle, it becomes solid and stays around. You can use quick icons to instantly delete or open the email. However, if you ignore the rectangle and just keep working in the other application, the rectangle quickly fades away.
Microsoft has added this feature to Excel 2007. It is sort of like popping up a context menu, except you don’t have to right-click. The Mini Toolbar occasionally appears just above the active cell. If you move your mouse toward the Mini Toolbar, it solidifies and hangs around. Otherwise, the Mini Toolbar fades away. Learn more about the Mini Toolbar in Chapter 3.
Live Preview
Another amazing new feature in Excel 2007 is Live Preview. Say you are selecting fonts for a range. As you hover over each font in the list, the view of the spreadsheet instantly updates to show how the change would appear in the spreadsheet.
The Live Preview feature works for charts, images, and cells. It is amazing how fast the preview works. Learn more about Live Preview in Chapter 5.
Where Is the Classic Mode?
Don’t feel bad. Bill Gates asked this same question. Certainly, with changes this radical, there would be a way to switch back to a classic view, right?
There is not.
I am convinced that Microsoft took away the floating commandbar in order to prevent every Excel guru out there from bringing back the classic mode.
Classic Mode for Keyboard Users
There is some relief for those who love keyboard shortcuts (also known as hotkeys). Consider the menus in Excel 2003. Notice that the E in Edit is underlined. If you hold down the Alt key while typing E, Excel opens the Edit menu. Within the Edit menu is the Fill command. The i in Fill is underlined. Typing Alt+I within the Edit menu brings up the Fill submenu. In the Fill submenu, the J in Justify is underlined. Typing Alt+J therefore invokes the Justify command.
Thus, without using the mouse, you can type Alt+EIJ to invoke the Edit, Fill, Justify command. I use these commands all the time, so I’ve memorized this keystroke combination.
If you have favorite keystroke combinations that you use all of the time, Microsoft will honor your knowledge. You can type Alt+EIJ to invoke Edit, Fill, Justify—or use your favorite hotkeys to invoke your favorite commands. A pop-up rectangle at the top of the screen shows the Office 2003 access key that you typed. You can continue typing access keys or press escape to cancel.
The Journey
It is difficult to predict how the press will react to the ribbon. Will there be praise or ridicule of Microsoft’s bold new user interface? That is a big question.
If you are reading this paragraph, I presume that you’ve made the leap and are at least trying out Excel 2007. This book will guide you on a journey through the new features in Excel 2007, hopefully easing the transition.
The book is organized into the following parts:
- Part I, “Mastering the New User Interface”—This first part of the book shows you in detail how best to deal with the ribbon.
- Part II, “A Tour of What’s New”—This part walks you through the amazing new features in Excel 2007. There might be topics here that would generally be found later in an Excel book. For example, pivot tables are usually in the advanced chapters of a book. In this case, they are up front because they are new.
- Part III, “Working in a Legacy Environment”—In a perfect world, you, all your co-workers, and everyone you share files with will have switched to Excel 2007 at the same time. In reality, you are going to have to share files with people who don’t have 1.1 million rows in their spreadsheets. This part of the book addresses how to enjoy the benefits of the new version while working with people who still use old ones.
- Part IV, “Calculating with Excel”—This part covers all the stuff that needs to be in an Excel book, from formulas to functions to linking.
- Part V, “Formatting and Sharing Information”—This part discusses how to make a workbook look good and how to share your workbooks by printing, creating PDFs, or publishing to the Web.
- Part VI, “More Power”—This part provides an introduction to VBA and information on customizing the ribbon, Excel Server, and more.
Conventions Used in This Book
The special conventions used throughout this book are designed to help you get the most from the book as well as Excel 2007.
Text Conventions
Different typefaces are used to convey various things throughout the book. They include those shown in Table I.1.
Table I.1. Typeface Conventions
Ribbon names, dialog box names, and dialog box elements are capitalized in this book (for example, Add Formatting Rule dialog, Sheet ribbon).
In this book, key combinations are represented with a plus sign. If the action you need to take is to press the Ctrl key and the T key simultaneously, the text tells you to press Ctrl+T.
Special Elements
Throughout this book, you’ll find tips, notes, cautions, cross-references, case studies, Excel in Practice boxes, sidebars, and Troubleshooting Tip boxes. These elements provide a variety of information, ranging from warnings you shouldn’t miss to ancillary information that will enrich your Excel experience but isn’t required reading.
Tip From
![]()
Tips point out special features, quirks, or software tricks that will help you increase your productivity with Excel 2007.