Adding a Chart
The fastest way to add a chart to your PowerPoint presentation is to apply a slide layout that contains a chart. To do so, click the New Slide button on the Formatting toolbar and then choose an appropriate layout from the Slide Layout task pane. The next step varies depending on the slide layout you choose.
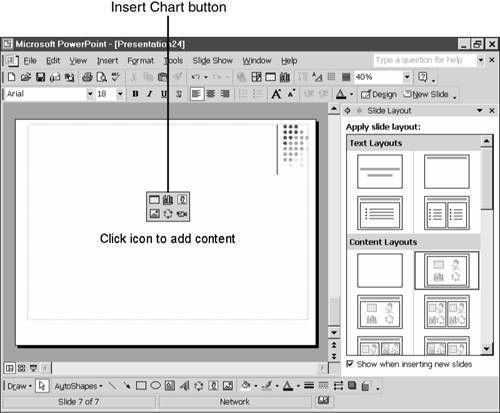
If you choose any of the layouts in the Content Layouts or Text and Content Layouts sections, you need to click the Insert Chart button on the content palette that displays (see Figure 11.2) to activate the chart and Microsoft Graph.
Figure 11.2. Click the Insert Chart button to start creating a chart.
If you choose one the layouts containing a chart in the Other Layouts section, you need to double-click the chart placeholder to activate the chart and Microsoft Graph. Figure 11.3 shows a sample chart slide with a chart placeholder.
Tip from
If you want to create a slide with a single chart and no other content, choose the Title and Chart slide layout.
→ To learn more about how slide layouts affect your presentation, see “Understanding Slide Layouts” in Chapter 2, “Creating a Basic Presentation.”
Note
If you use the AutoContent Wizard to create your presentation, it might already have a slide that contains a chart.
Figure 11.3. You can start adding a chart by double-clicking the placeholder.

![]() Figure 11.4 illustrates a preliminary chart in Microsoft Graph, which you'll see after either clicking the Insert Chart button on the content palette or double-clicking the chart placeholder. You can also insert a chart into an existing slide by clicking the Insert Chart button on the Standard toolbar or by selecting Insert, Chart.
Figure 11.4 illustrates a preliminary chart in Microsoft Graph, which you'll see after either clicking the Insert Chart button on the content palette or double-clicking the chart placeholder. You can also insert a chart into an existing slide by clicking the Insert Chart button on the Standard toolbar or by selecting Insert, Chart.
Figure 11.4. PowerPoint displays a chart with sample data.

A sample 3D clustered column chart displays by default and the related datasheet opens. The menu bar and toolbars are also customized for Microsoft Graph. The menu bar now includes Data and Chart menu items, and the Standard toolbar includes several new options, explained in Table 11.2.
→ To learn more about object-formatting options in PowerPoint, see “Using the Format Dialog Box” in Chapter 14, “Creating and Formatting Objects.”
If you don't see these menu and toolbar options, Microsoft Graph isn't active. To activate it, double-click the chart in PowerPoint and you'll then be able to view the Data and Chart menus and chart toolbar options.
Note
Many of these toolbar buttons act as a toggle. For example, clicking the View Datasheet button displays the datasheet if it's closed, but closes it if the datasheet already displays.
To determine what each object is in a chart you've created, place the mouse on that object or part of the chart and a chart tip displays its name. Figure 11.5 shows an example of a chart tip with the name and numeric value for a data series.
Figure 11.5. This chart tip lets you know the name of the chart object as well as its value.

If the chart tip doesn't display, activate Microsoft Graph by double-clicking the chart, choose Tools, Options, and then verify that the Show Names and Show Values check boxes are selected on the Chart tab of the Graph Options dialog box (see Figure 11.6).
Figure 11.6. PowerPoint displays names and values in chart tips by default.

Modifying Your Chart
You can create a basic chart quickly in PowerPoint or you can make numerous enhancements and formatting changes. After you activate Microsoft Graph to create a chart, it's easiest to proceed in the following order:
Change the chart type if you don't want to use the default (a 3D column chart).
Edit the datasheet data (the text and numbers for your chart).
Enter a title for the chart slide.
Modify and format chart objects as needed.
Tip from
Before creating an actual chart, design a paper sketch of the chart you want to create. This can help you understand which chart type is right for your specific chart.
Note
For help in using Microsoft Graph, choose Help, Microsoft Graph Help. This opens the help file specific to this application.