
4.5 LGM with Categorical Outcomes
In Section 2.4 we discussed that the categories of an observed ordered categorical variable y are observed measures of an underlying continuous latent variable y*. For an observed variable with M categories, there would be (M − 1) unknown thresholds, ![]() ,
, ![]() , . . . , and
, . . . , and ![]() , that separate the adjacent categories and link the latent continuous y* variable to the observed categorical variable y. When categorical outcomes are involved in a SEM model, rather than the variances/covariances of the observed indicators, the correlations among the latent continuous variables y* are analyzed. As the special correlation matrices do not follow Wishart distribution (Wishart, 1928), special estimation procedures are needed for model estimation. When categorical outcomes are involved, Muthén's robust estimator WLSMV is used for model estimation by default in Mplus (Muthén and Muthén 1998–2010).
, that separate the adjacent categories and link the latent continuous y* variable to the observed categorical variable y. When categorical outcomes are involved in a SEM model, rather than the variances/covariances of the observed indicators, the correlations among the latent continuous variables y* are analyzed. As the special correlation matrices do not follow Wishart distribution (Wishart, 1928), special estimation procedures are needed for model estimation. When categorical outcomes are involved, Muthén's robust estimator WLSMV is used for model estimation by default in Mplus (Muthén and Muthén 1998–2010).
For LGM with categorical outcomes, Mplus provides two parameterization approaches: the Delta parameterization and the Theta parameterization (Muthén and Muthén, 1998–2010). When the default Delta parameterization is used, the scale factors of the latent variables (![]() ) are treated as free parameters, while the residual variances of
) are treated as free parameters, while the residual variances of ![]() are not estimated. Usually, the scale factor is standardized to 1.0 at a reference time point (e.g., baseline time point), and set free for other time points. In contrast, when the Theta parameterization is used, the residual variances of
are not estimated. Usually, the scale factor is standardized to 1.0 at a reference time point (e.g., baseline time point), and set free for other time points. In contrast, when the Theta parameterization is used, the residual variances of ![]() are treated as free parameters, while the scale factors are not estimated. The residual variance of the response variable is fixed to 1.0 at a reference time point (e.g., baseline time point), while they are free parameters at the other time points.
are treated as free parameters, while the scale factors are not estimated. The residual variance of the response variable is fixed to 1.0 at a reference time point (e.g., baseline time point), while they are free parameters at the other time points.
In both Delta parameterization and Theta parameterization, the mean of the intercept growth factor (![]() ) is usually fixed at zero, the mean of the slope growth factor (
) is usually fixed at zero, the mean of the slope growth factor (![]() ), the variances of the intercept and slope growth factors, as well as their covariance, are estimated by default. The default estimator for LGM with categorical outcomes is WLSMV and PROBIT function is used by default to link the observed categorical indicators to their underlying latent growth factors.
), the variances of the intercept and slope growth factors, as well as their covariance, are estimated by default. The default estimator for LGM with categorical outcomes is WLSMV and PROBIT function is used by default to link the observed categorical indicators to their underlying latent growth factors.
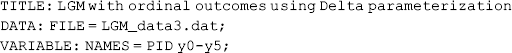
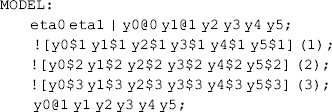
In this section, we demonstrate a LGM with ordinal measures of depression status: 1, minimal depression; 2, mild depression; 3, moderate depression; and 4, severe depression. We start with a LGM model using Delta parameterization in the following Mplus program:
Mplus Program 4.15
where data were read from a new data file named LGM_data3.dat that has seven variables (participant ID and six repeated measures of depression status) with missing values coded as ‘..’ The statement ‘CATEGORICAL = y0 − y5;’ in the VARIABLE command defines the outcome measures y0 − y5 as categorical variables. In Mplus, all observed variables are treated as continuous by default unless being specified in the CATEGORICAL statement. The program will automatically identify the number of categories that each categorical variable has, and estimate (M − 1) thresholds if M categories are identified. In this example, each categorical outcome measure has four categories (ranging from no depression to severe depression), therefore, three thresholds (i.e., ![]() ,
, ![]() , and
, and ![]() ) that link the underlying latent
) that link the underlying latent ![]() variable to the observed categorical variable yt (i.e., y0 − y5) will be estimated at each time point. To make the growth model meaningful, the thresholds should be held invariant across time to ensure that the repeated outcome variables
variable to the observed categorical variable yt (i.e., y0 − y5) will be estimated at each time point. To make the growth model meaningful, the thresholds should be held invariant across time to ensure that the repeated outcome variables ![]() s are measured in the same metric over time. In Mplus the thresholds of the outcome measures are held equal at different time points by default. Thus we comment out the statements that impose threshold equality in Mplus Program 4.15.
s are measured in the same metric over time. In Mplus the thresholds of the outcome measures are held equal at different time points by default. Thus we comment out the statements that impose threshold equality in Mplus Program 4.15.
For Delta parameterization, scale factors of the latent continuous outcome variables ![]() are treated as free parameters, while residual variances of
are treated as free parameters, while residual variances of ![]() are not estimated. In the Mplus program, the scale factors are referred to in a curly bracket ‘{}.’ By default, the scale factor is fixed to 1.0 at the baseline and is free at other time points. Free scale factors imply that the variances of the underlying latent variable y* varies over time. For the purpose of model identification, the mean of the latent growth intercept factor (eta0 in this example) is fixed at 0 by default.
are not estimated. In the Mplus program, the scale factors are referred to in a curly bracket ‘{}.’ By default, the scale factor is fixed to 1.0 at the baseline and is free at other time points. Free scale factors imply that the variances of the underlying latent variable y* varies over time. For the purpose of model identification, the mean of the latent growth intercept factor (eta0 in this example) is fixed at 0 by default.
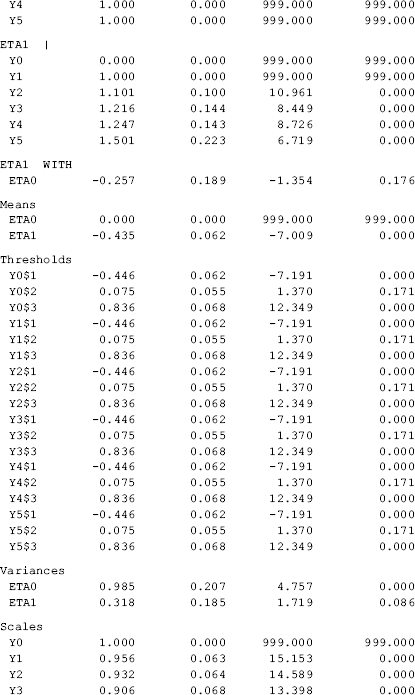
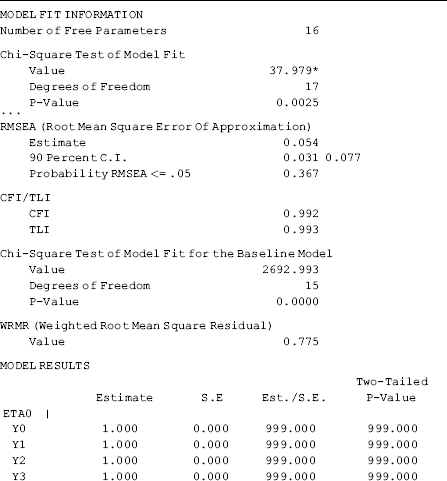
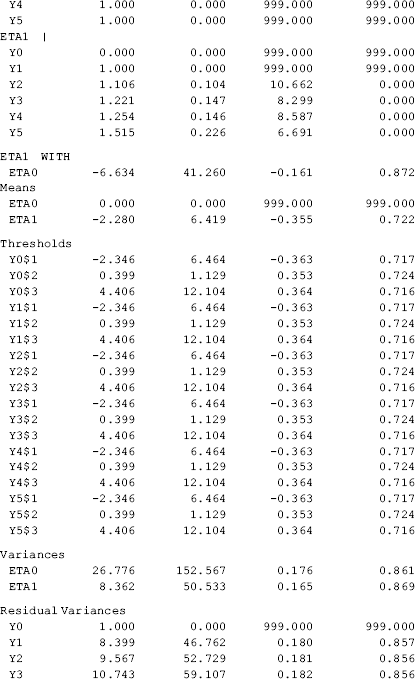
The model results show that the model fits data very well: RMSEA = 0.053 (90% CI: 0.030, 0.076), close-fit test P = 0.370, CFI = 0.992, TLI = 0.993, and WRMR = 0.775. The estimated growth trajectories of the categorical outcome was nonlinear since the estimated time scores (i.e., 0.000, 1.000, 1.101, 1.216, 1.247, and 1.501) are away from the corresponding scores in a linear growth trajectory (i.e., 0, 1, 2, 3, 4, and 5) (Table 4.15).
Table 4.15 Selected Mplus output: LGM with categorical outcome using Delta parameterization.

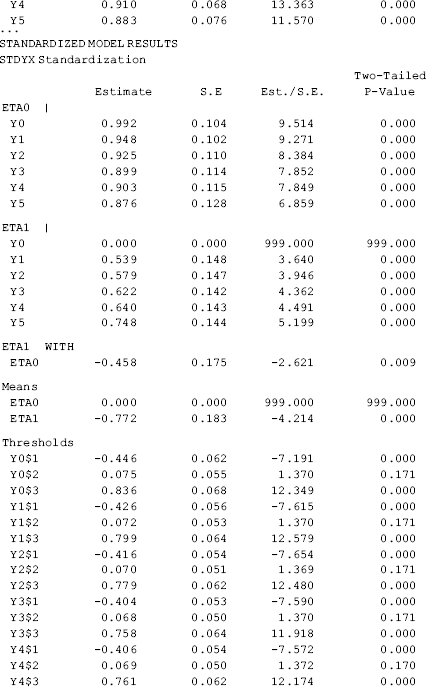
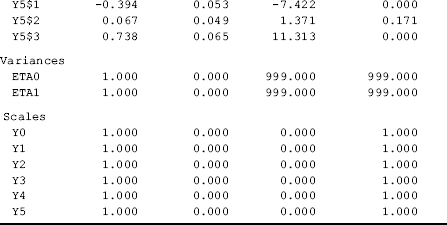
The model parameters can be interpreted in the same way as in previous LGM models. However, the mean value of the latent growth intercept (i.e., eta0) here is the mean initial level of the latent continuous outcome measure ![]() rather than the observed outcome measure yt, and eta0 is set to 0 for the purpose of model identification. The mean value of the latent growth slope (i.e., eta1) represents the rate of change in
rather than the observed outcome measure yt, and eta0 is set to 0 for the purpose of model identification. The mean value of the latent growth slope (i.e., eta1) represents the rate of change in ![]() , corresponding to one unit increase in the time score. The estimates of the threshold
, corresponding to one unit increase in the time score. The estimates of the threshold ![]() , time score
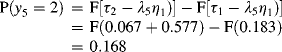
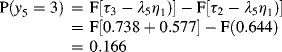
, time score ![]() , and latent growth factors eta0 and eta1 can be used to estimate the probabilities of being in specific categories of the observed outcome measure yt at each time point, using Equations 2.18–2.20 in Appendix 2.D. For example, the probabilities of having different depression status at time point t5 can be calculated as the following, where standardized parameter estimates are used:
, and latent growth factors eta0 and eta1 can be used to estimate the probabilities of being in specific categories of the observed outcome measure yt at each time point, using Equations 2.18–2.20 in Appendix 2.D. For example, the probabilities of having different depression status at time point t5 can be calculated as the following, where standardized parameter estimates are used:
The probability of y5 = 1 (minimal depression):

The probability of y5 = 2 (mild depression):
The probability of y5 = 3 (moderate depression):
The probability of y5 = 4 (severe depression):
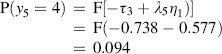
The results show the model estimated probabilities of having minimal, mild, moderate, and severe depression at the end of the observation period would be 0.573, 0.168, 0.166, and 0.094, respectively.
The model estimated probabilities can be calculated using the following SAS program:
SAS Program 4.2

After running the SAS program, the calculated probabilities (i.e., p1 − p4) will be shown in the SAS Log window, instead of in the SAS Output window. The corresponding probabilities for y0 − y4 at other time points can be calculated in the same way.
The same model can be estimated alternatively using the Theta parameterization in the following Mplus program:
Mplus Program 4.16

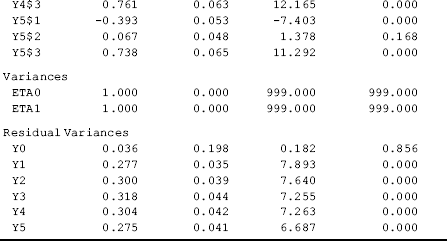
![]()
where option PARAMETERIZATION = THETA is specified in the ANALYSIS command. Residual variance is set to 1.0 at baseline (the reference time point), but free at other time points. In the Mplus output of this program, the scale factors of ![]() were not estimated, but the residual variances were (Table 4.16). The parameter estimates in Theta parameterization remain almost the same as those in Delta parameterization. The authors of the book had noticed that Mplus version 5 produced unreasonably large standard errors for the threshold and residual variance estimates in the unstandardized solution when using Theta parameterization. With Mplus version 6, such standard errors are much smaller, but the corresponding P-values are still very large in the unstandardized solution (Table 4.16).
were not estimated, but the residual variances were (Table 4.16). The parameter estimates in Theta parameterization remain almost the same as those in Delta parameterization. The authors of the book had noticed that Mplus version 5 produced unreasonably large standard errors for the threshold and residual variance estimates in the unstandardized solution when using Theta parameterization. With Mplus version 6, such standard errors are much smaller, but the corresponding P-values are still very large in the unstandardized solution (Table 4.16).
Table 4.16 Selected Mplus output: LGM with categorical outcome using Theta parameterization.
In this chapter we have demonstrated some often used LGMs to evaluate trajectories of outcome growth over time. The LGMs discussed in this chapter can be extended to more advanced models, such as multi-group LGMs and growth mixture models (GMMs), that will be discussed in the following chapters.
Notes
1. The latent growth factors are not latent variables representing constructs in the sense of factor analysis; instead, the repeated outcome measures are used to construct the growth factors to represent the shapes of the individual growth trajectories.
2. BDI is a 21-item multiple-choiceself-report inventory; each of the items reflects a single depression symptom or attitude. Response to each item is scored on a four-point scale with values of 0 to 3.
3. In an unconditional LGM with free time scores, the outcome change between two specific time points tt and t(t + c), where c is a constant, would be ![]() . For details about gauging outcome changes in latent growth trajectory, the readers are referred to Wang (2004) and Wang (2009).
. For details about gauging outcome changes in latent growth trajectory, the readers are referred to Wang (2004) and Wang (2009).