
2.4 CFA Model with Categorical Indicators
Mplus is developed on the basis of the LISCOMP,13 a SEM program that was well- suited for SEM with categorical outcomes. It is convenient to implement SEM with categorical outcome in Mplus. In this section, we extend the conventional CFA model to a CFA model with categorical indicators (binary or ordered categorical). Assuming an ordered categorical variable has M categories (m = 1, 2, . . . , M) with observed values of (U = 1), (U = 2), . . . , (U = M), and (U = 1) < (U = 2) < . . . (U = M), then there would be (M − 1) unknown thresholds that separate the adjacent categories; that is:
(2.9) 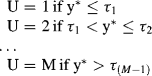
where y* is an unobserved normally distributed continuous latent variable underlying the observed categorical variable U; the ![]() ,
, ![]() , . . . , and
, . . . , and ![]() are (M − 1) thresholds and
are (M − 1) thresholds and ![]() , that link the underlying latent y* variable to the values of the observed categorical variable U.
, that link the underlying latent y* variable to the values of the observed categorical variable U.
Traditionally, the ADF estimator (Browne, 1984) is used for SEM with categorical outcomes although ADF was originally designed for non- normal continuous outcomes. Conceptually, ADF estimation works using the following steps: (1) estimate the thresholds for the categorical variables using ML; (2) estimate the latent correlations (i.e., the correlations between the latent continuous variables based on the estimated thresholds); (3) estimate an asymptotical variance/covariance matrix of the latent correlations; and (4) analyze the latent correlation matrix, using the inverse of the asymptotical variance/covariance matrix as a weight in a WLS estimator (Jö reskog and Sö rbom, 1988; Kaplan, 2000).
There are various types of latent correlations. When one of the indicators is continuous and another is an ordered categorical indicator, the latent correlation is called polyserial correlation; the latent correlation is called polychoric correlation for two categorical indicators, tetrachoric correlation for two dichotomous indicators, and biserial correlation for one continuous and one dichotomous indicator (Jö reskog and Sö rbom, 1988).
As aforementioned, ADF requires a large sample size, thus it may not be a good choice when this is not the case. The recently developed WLS- based estimators for categorical indicators do not require enormously large sample size. An important development in SEM model estimation with categorical variables is based on the work of Muthé n (1978, 1983, 1984). Muthé n' s robust WLS estimators, such as the mean- adjusted WLS estimator (WLSM) and mean and variance- adjusted WLS (WLSMV), are more generalized weighted least square based robust estimators that are available in Mplus (Muthé n and Muthé n, 1998– 2010). The estimators can be applied to a combination of binary, ordered categorical, and continuous indicators. Usually, WLSMV is recommended and is the default estimator in Mplus for modeling categorical outcomes. As aforementioned, the WLS estimators allow missing values to be related to observed covariates, but not to the observed outcomes (Muthé n and Muthé n 1998– 2010).
2.4.1 CFA Model with Binary Indicators
To demonstrate CFA with binary indicators, 18 dichotomous indicators were created from the BSI- 18 items in our example data set. Recall that each of the BSI- 18 items is measured on a five- point Likert scale (0, not at all; 1, a little bit; 2, moderately; 3, quite a bit; 4, extremely). We recode each of the items as a dummy variable: 0, ‘ not at all’ or ‘ a little bit; ’ 1, ‘ Moderately’ to ‘ Extremely’ for the purpose of model demonstration. The following Mplus program is for a CFA model with binary indicators.
Mplus Program 2.10
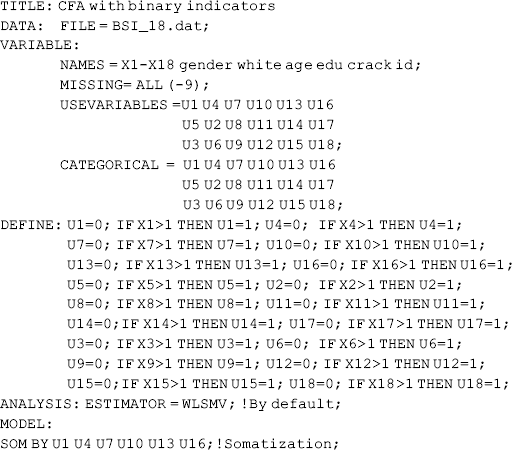
where the U variables are new binary indicators created from the original observed indicators x1 − x18, and are specified as categorical variables in the CATEGORICAL statement of the VARIABLE command. The default estimator for categorical data analysis is WLSMV.
When robust estimators, such as WLSMV, MLMV or ULSMV, are used for model estimation, model χ 2 difference cannot be directly used for model comparison (Muthé n and Muthé n, 1998– 2010), instead Mplus provides a two- step approach to conduct a model comparison test. In this program, the DIFFTEST option on the SAVEDATA command is used to specify a file name (e.g., TEST.DAT), in which the derivatives of the H1 model will be saved. This information will be retrieved in the next Mplus program where a more restrictive H0 model will be specified.
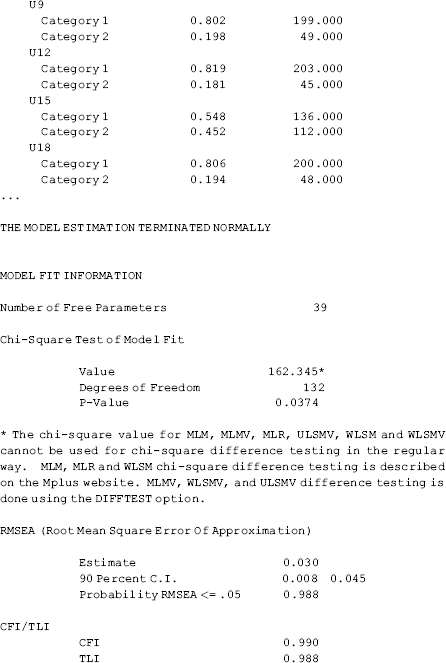
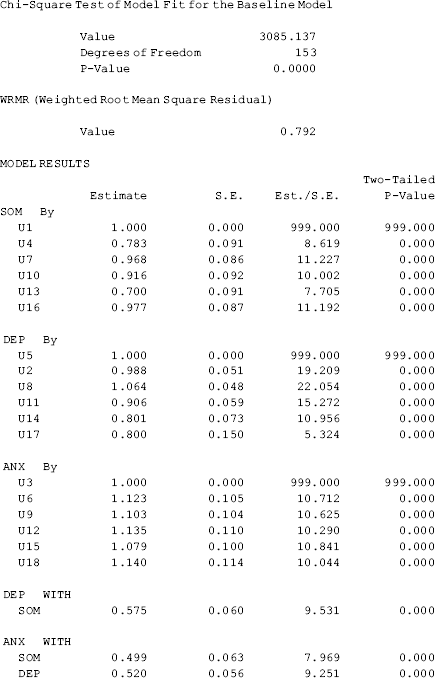
The model results show that the model fits data very well: CFI = 0.990; TLI = 0.988; RMSEA = 0.030 (90% CI: 0.008, 0.045), close- fit test P = 0.988; WRMR = 0.792. Mplus does not provide SRMR (standardized root mean square residual) here because SRMR does not work well with binary indicators (Yu, 2002). Instead, Mplus provides WRMR (weighted root mean square residual), with values of 1.0 or lower considered good fit (Yu, 2002).
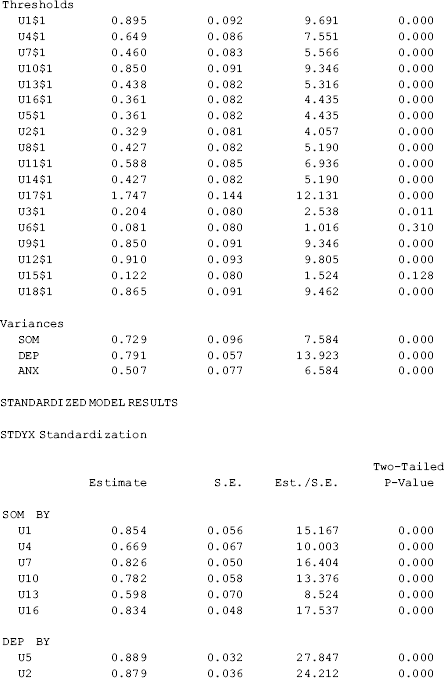
With binary indicators, the relationships between the observed response variables and their underlying latent construct variable/factor are nonlinear. With a weighted least square estimator (e.g., WLSMV), Mplus uses PROBIT function to link the observed binary indicators to their underlying latent variables/factors. Correlations between the unobserved continuous response variables y* s (i.e., tetrachoric correlations) are analyzed rather than the covariance of the observed indicators. As each binary indicator has only two categories (i.e., 0 vs. 1), one threshold (![]() ) is estimated for each indicator. The negative value of the threshold (
) is estimated for each indicator. The negative value of the threshold (![]() ) is equivalent to the intercept of regressing the item on its underlying factor (Appendix 2.D). The factor loading (
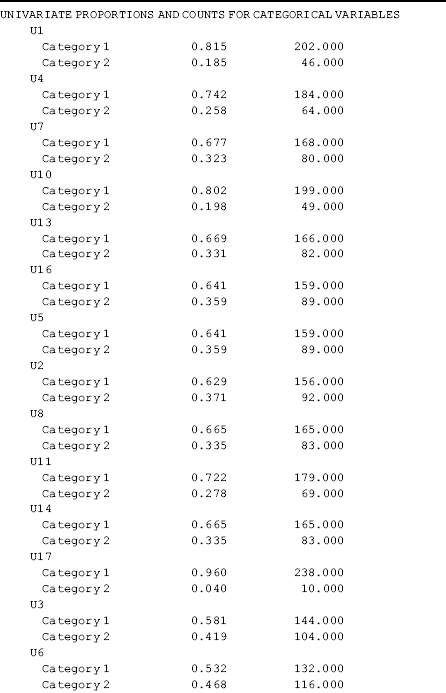
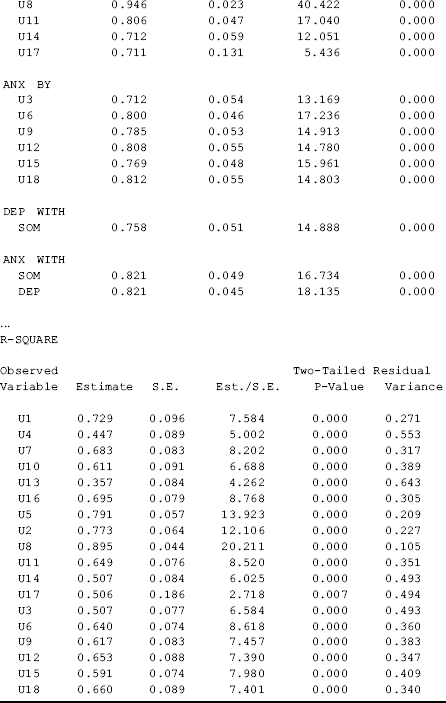
) is equivalent to the intercept of regressing the item on its underlying factor (Appendix 2.D). The factor loading (![]() ) of each item here is the PROBIT slope coefficient of regressing the item on its underlying factor. In the PROBIT models the residual variances of the binary indicators are not identified and not estimated. The estimated R- SQUARE is calculated as the squared complete standardized factor loading. For example, the R2 for U1 is 0.8522 = 0.729 (Table 2.9).
) of each item here is the PROBIT slope coefficient of regressing the item on its underlying factor. In the PROBIT models the residual variances of the binary indicators are not identified and not estimated. The estimated R- SQUARE is calculated as the squared complete standardized factor loading. For example, the R2 for U1 is 0.8522 = 0.729 (Table 2.9).
Table 2.9 Selected Mplus output: CFA with binary indicators.
The ML estimator (e.g., ML or MLR) can also be used to estimate the model though it takes much longer. When a ML estimator is used, the link function will be LOGIT by default in Mplus.
The following Mplus program does the second step needed for the χ 2 difference test using the WLSMV.
Mplus Program 2.11
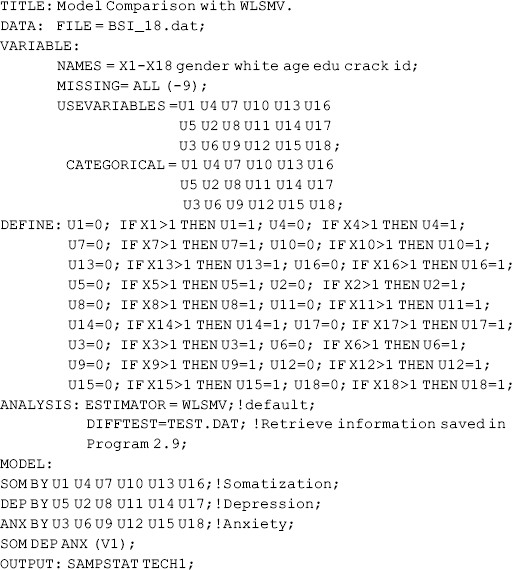
where the more restrictive H0 model is specified by imposing equality restrictions on the variances of all three factors. The label ‘ (V1)’ 14 in the SOM DEP ANX (1) statement of the MODEL command requests to set the variances of factors SOM, DEP and ANX equal to each other. The DIFFTEST option in the ANALYSIS command retrieves the file TEST.DAT created by Mplus program 2.10 to calculate the χ 2 difference between models H1 and H0. The correct χ 2 test for difference testing is shown in Table 2.10, which is statistically significant (P = 0.0110), thus we reject the equal factor variance hypothesis H0.
Table 2.10 Selected Mplus output: model test using DIFFTEST option.
2.4.2 CFA Model with Ordered Categorical Indicators
A variable measured using a Likert scale with five or more points is often treated as a continuous measure although it is in fact an ordered categorical measure or ordinal measure. In our CFA example model, the BSI- 18 items are measured on a five- point Likert scale (0, not all; 1, a little bit; 2, moderately; 3, quite a bit; and 4, extremely). Those measures are treated as continuous normal, continuous non- normal, and continuous censored measures in our previous example models in this chapter. In the following Mplus program, we run the same CFA model but treat the BSI- 18 items as ordered categorical measures.
Mplus Program 2.12
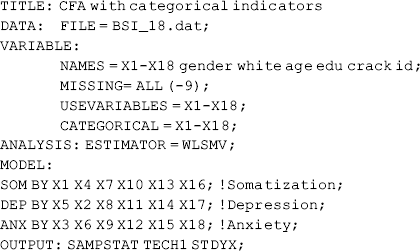
where indicators x1 − x18 are all specified as categorical variables in the CATEGORICAL statement on the VARIABLE command. Since the indicators are measured on a five- point Likert scale, four thresholds, but only one factor loading will be estimated for each of the indicators. Again, the default estimator is WLSMV. The model fits data very well: CFI = 0.973; TLI = 0.968; RMSEA = 0.062 (90% CI: 0.051, 0.073), close- fit test P = 0.042; WRMR = 0.846.
In this section, we have demonstrated how to run CFA models with binary and ordinal indicators. In Mplus programming, the researcher does not need to specify which variables are binary or ordinal measures. The number of categories of each categorical variable is automatically identified by Mplus once the variables are specified in the CATEGORICAL statement on the VARIABLE command line. Mplus has the flexibility to model a set of variables mixed with continuous and various categorical measures.