
6.2 LTA model
The LTA model is a longitudinal mixture model for studying changes over time in classes or statuses of latent class variables (Graham et al., 1991; Collins and Wugalter, 1992; Lanza, Flaherty and Collins, 2003). Most often, LCA is utilized to identify the unobserved latent classes, statuses or states, using the same set of outcome measures at each time point. LTA can be considered an extension of LCA to longitudinal data, in which LCA plays the role of measurement model. Once latent classes are identified at different time points, a structural model is used to analyze transitions of latent class membership over time. Of course, the latent class classification and analysis on transitions of latent classes over time are conducted simultaneously in LTA, and interest focuses on transition between classes over time. Usually the first-order stationary transition is assumed so that class statuses at time t are only affected by statuses at time (t − 1) and this dependence is constant over time. The probability of transition to class m at time t from class k at (t − 1) is described in the following multinomial logistic regression of ct on c(t − 1) (Reboussin et al., 1998; Nylund, Asparouhov and Muthén, 2007):
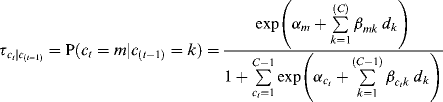
where ![]() represents the probability of transition to latent class ct = m at time t, given a class of c(t−1) = k at time (t − 1). To regress ct on c(t − 1), the last latent class (i.e., ct = C) in ct is treated as the reference group. Since the latent class at (t − 1) is a categorical independent variable in the model, its last latent class (i.e., c(t − 1) = C) is omitted, and (C − 1) dummy variables (d1, d2,..., d(C − 1)) are generated as indicators of the logits. For example, if c(t − 1) = 1, then d1 = 1, otherwise d1 = 0; if c(t − 1) = 2, then d2 = 1, otherwise d2 = 0;...; and if c(t − 1) = (C − 1), then d(C − 1) = 1, otherwise d(C − 1) = 0; and dC is set to 0. As in the regular multinomial logit model, parameters
represents the probability of transition to latent class ct = m at time t, given a class of c(t−1) = k at time (t − 1). To regress ct on c(t − 1), the last latent class (i.e., ct = C) in ct is treated as the reference group. Since the latent class at (t − 1) is a categorical independent variable in the model, its last latent class (i.e., c(t − 1) = C) is omitted, and (C − 1) dummy variables (d1, d2,..., d(C − 1)) are generated as indicators of the logits. For example, if c(t − 1) = 1, then d1 = 1, otherwise d1 = 0; if c(t − 1) = 2, then d2 = 1, otherwise d2 = 0;...; and if c(t − 1) = (C − 1), then d(C − 1) = 1, otherwise d(C − 1) = 0; and dC is set to 0. As in the regular multinomial logit model, parameters ![]() and
and ![]() for the reference group (i.e., ct = C) in Equation (6.14) are set to 0; thus the term in the denominator of the equation for the last latent class is 1. In addition, the numerator of the equation for the reference group ct = C is also 1. The coefficient
for the reference group (i.e., ct = C) in Equation (6.14) are set to 0; thus the term in the denominator of the equation for the last latent class is 1. In addition, the numerator of the equation for the reference group ct = C is also 1. The coefficient ![]() is the log of the ratio of odds of being in class m vs. the reference class (i.e., ct = C) at time t, comparing those who were in class k at time (t − 1) with those who were in the reference group (i.e., c(t − 1) = C) at time (t − 1).
is the log of the ratio of odds of being in class m vs. the reference class (i.e., ct = C) at time t, comparing those who were in class k at time (t − 1) with those who were in the reference group (i.e., c(t − 1) = C) at time (t − 1).
Let us describe the transition probability more specifically assuming a latent categorical variable with three classes (i.e., C = 3) at both (t − 1) and time t. In this case, the odds of being in Classes 1 and 2 relative to Class 3 at time t are a function of latent class membership at time (t − 1). The probabilities of transition to class m at t given a specific class c(t−1) = 1 at (t − 1) can be expressed as:
(6.15) ![]()
(6.16) ![]()
(6.17) ![]()
The corresponding log odds or logits can be expressed as:
(6.18) ![]()
(6.19) ![]()
The probabilities of transition to a specific class Ct = m at t from different classes at (t − 1) can be expressed as:
(6.20) ![]()
(6.21) ![]()
(6.22) ![]()
Adding a time-invariant covariate x into the model, the transition probability shown in Equation (6.14) becomes:
(6.23) 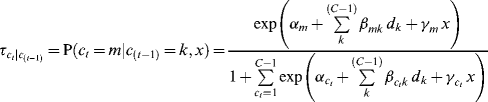
where ![]() is the effect of covariate x on a specific transition probability.
is the effect of covariate x on a specific transition probability.
In the following, we demonstrate an application of LTA using real research data. For simplicity, we only consider the LTA model with two time points (t1 and t2). For applications of LTA models with multiple time points, readers are referred to (Nylund, Asparouhov and Muthén, 2007).
6.2.1 Example of LTA
A sample of crack-cocaine users recruited for a natural history study in Dayton, Ohio in the USA (Siegal et al., 2002) is used to demonstrate a two time-point LTA model. Starting in July 1996, 430 drug users were recruited. After completing the baseline interview, each participant was followed up every 6 months for 3 years and drug use practices were measured at baseline and each follow-up interview. Here we use data collected at the baseline and the 12-month follow-up interviews to study drug use patterns among the urban drug users at the beginning and end of the first observation year and changes in drug use patterns during this 1-year period. Binary measures of multiple drug use at the baseline and 12-month follow-up were used for LCA modeling first and then LTA modeling. Use of alcohol, marijuana, and crack-cocaine was measured as: 0, ‘no use or non-daily use;' 1, ‘daily use.’ Uses of powder-cocaine and other drug (e.g., opioids, amphetamines, tranquilizers, hallucinogens and/or inhalants) were measured as: 0, ‘no use;’ 1, ‘use’ in past 6 months. The descriptive statistics of drug use practices at time t1 and t2 are shown in Table 6.8. At baseline, about 60% of the participants used crack-cocaine on a daily basis in the past 6 months prior, 42% of them were daily alcohol users and 14% were daily marijuana users; about 24% of them used powered-cocaine, and 29% used other drugs. Drug use slightly reduced from baseline to the 12-month follow-up.
Table 6.8 Sample statistics [N(%)] of the observed outcome indicators by time point.
| Variable | t1 (N = 430) | t2 (N = 370) |
| Alcohol | ||
| No use or non-daily | 250 (58) | 228 (62) |
| Daily use | 180 (42) | 142 (38) |
| Marijuana | ||
| No use or non-daily | 369 (86) | 330 (89) |
| Daily use | 61 (14) | 40 (11) |
| Crack-cocaine | ||
| No use or non-daily | 170 (40) | 215 (58) |
| Daily use | 260 (60) | 155 (42) |
| Powdered-cocaine | ||
| No use | 326 (76) | 307 (87) |
| Use | 104 (24) | 62 (17) |
| Other drugs | ||
| No use | 304 (71) | 280 (76) |
| Use | 126 (29) | 90 (24) |
To examine the patterns of drug use among this population at the beginning and end of the 1-year observation period, as well as drug use pattern transition during the period, we first implement separate LCA models based on the cross-sectional data at t1 and t2, respectively. And then, LTA was applied to test whether and how individual drug use patterns changed over time or to study transitions of drug use patterns among the participants during the observation period.
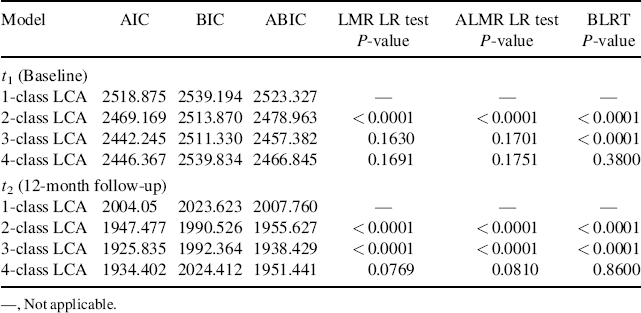
The same strategy of LCA modeling discussed in Section 6.1 was applied to determine the optimal number of latent classes of drug use practices at t1 and t2, respectively. At each time, point, LCA models with 1–4 latent classes were estimated and compared. The model fit information shown in Table 6.9 indicate that the 3-class LCA model is preferred for both t1 and t2.
Table 6.9 Model fit information of different LCA models for t1 and t2.
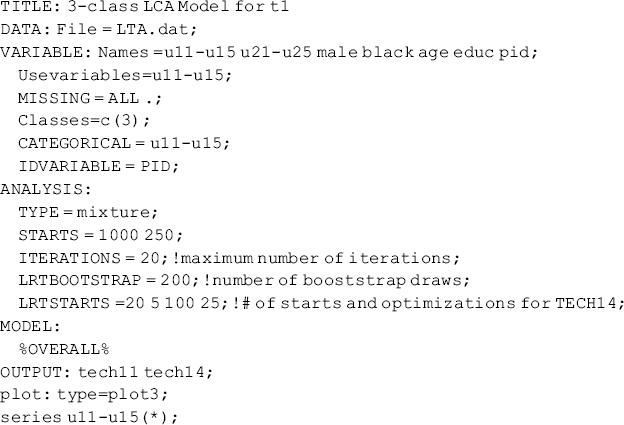
The following is the Mplus program for the 3-class LCA model at t1.
Mplus Program 6.5
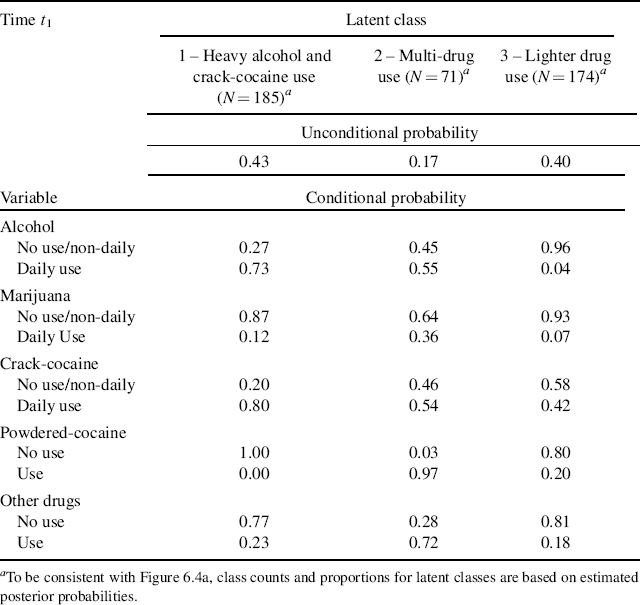
The parameter estimates of the LCA models for time t1 (baseline) are shown in Table 6.10. The latent classes are defined based upon the conditional probabilities or estimated item response probabilities; and the estimated prevalence rates of the latent classes are represented by unconditional probabilities. Class 1 counts for 43% (N = 185) of the sample. Because 0.73% and 80% of the participants in this class used alcohol and crack-cocaine on a daily basis, respectively, in the past 6 months, we define this class as Heavy Alcohol and Crack Use class. About 17% (N = 71) of the sample were classified into Class 2, in which 97% of people used powdered-cocaine, more than half of them used crack-cocaine (54%) and drank alcohol (55%) on a daily basis, more than a third (36%) of them were daily marijuana users, and 72% used other drugs, such as opioids, amphetamines, tranquilizers, hallucinogens and/or inhalants. This class is defined as the Multi-Drug Use class. Another 40% (N = 174) of the sample were classified into the third class, defined as the Lighter Drug Use class.
Table 6.10 Unconditional and conditional probabilities: 3-class LCA model for t1 (baseline) (N = 430).
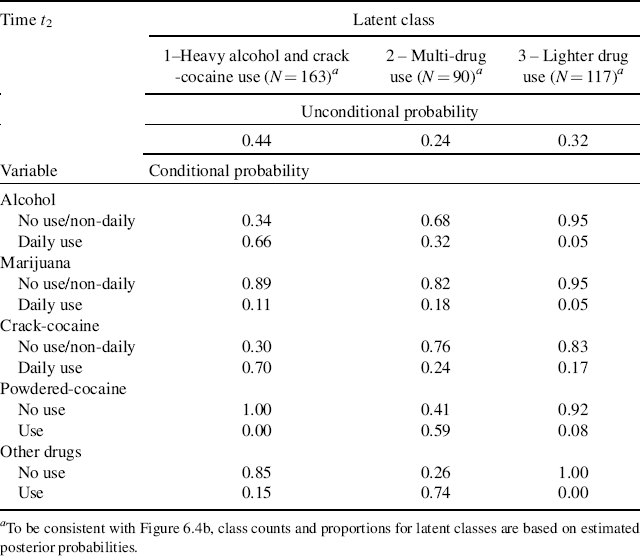
By replacing the outcome indicator variables u11–u15 with u21–u25 in Mplus Program 6.5, we can estimate the 3-class LCA model at t2 (12-month follow-up). The parameter estimates of the LCA model for time t2 are shown in Table 6.11. The profiles of latent classes at t1 and t2 are depicted in Figure 6.4a and b, respectively. The patterns of drug use practices were similar at the two time points, indicating that the types of latent classes remained unchanged over time. However, the item response probabilities were somewhat different in both Classes 2 and 3 between t1 and t2.
Figure 6.4 Patterns of drug use practices estimated from the 3-class LCA for (a) t1 and (b) t2.
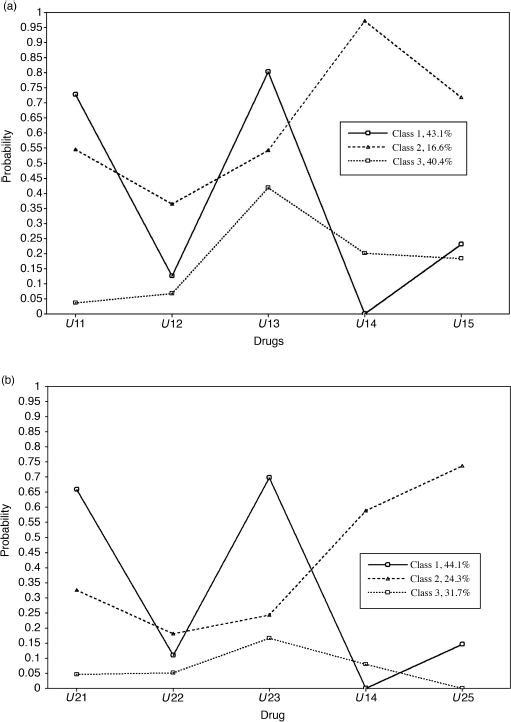
Table 6.11 Unconditional and conditional probabilities: 3-class LCA model for t2 (12-month follow-up) (N = 370)
The next step is to implement the LTA model, in which the LCA models are simultaneously estimated for both t1 and t2, and transitions in drug use patterns represented by changes in latent classes of drug use practices from time point t1 to t2 are examined. Because the LCA models based on individual measurement occasions show that the same number of latent classes is identified over time and the types of classes are similar at both time points, it implies measurement invariance. In other words, the measurement parameters (e.g., the conditional item-response probabilities in each latent class) may remain unchanged over time. A LTA model may have full measurement invariance or partial measurement invariance depending on theoretical reasons and data/variables used in the study. A LTA with full measurement invariance assumes all the measurement parameters are equal across time; thus makes the meanings of the latent classes the same at each time point, and the model results are straightforward to interpret. Additionally, equality restrictions on measurement substantially reduce the number of parameters to estimate, thus helping to reduce model identification problems. Measurement invariance is a widely used practice in applications of LTA. However, if a model does not have measurement invariance, imposing equality restrictions on the item-response probabilities would lead to model misspecification. In the following section, we will test the assumption of measurement invariance in our LTA model.
A LTA model has a very large number of cells in its data contingency table, particularly when more time points are involved. For example, a LCA with 5 dichotomous indicators has 25 = 32 cells. With two time points in the LTA model under study, the number of cells in the contingency table increases exponentially to 210 = 1024. As such, a LTA tends to have large degrees of freedom (df = W-P-1, where W is the number of data cells, and P is the number of free parameters) and data for modeling tend to be extremely sparse. As a result, absolute goodness-of-fit testing is not applicable for model comparisons, and model selection is based on relative comparisons (Collins and Lanza, 2010). First, information criterion indices, such as AIC, BIC, and ABIC are used for model selection. The smaller the information criteria, the better the model fits data. In addition, th e LR test can be applied for model comparison, where the LTA with measurement invariance is the null model and the LTA with measurement noninvariance is the alternative model. As the former is a special case of the latter, the two models are nested. Note that TECH 11 and TECH 14 are not available in Mplus for mixture models with more than one latent class variable.
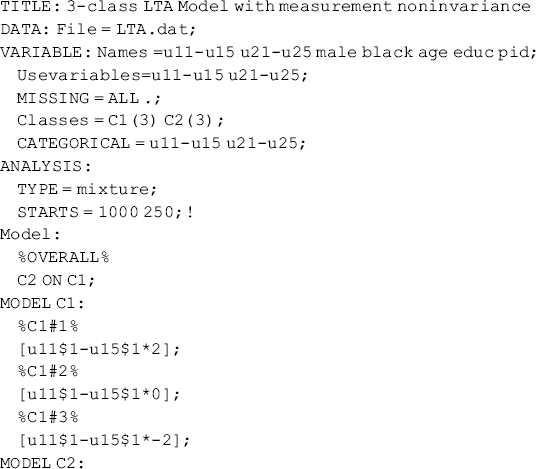
The Mplus program for the 3-class LTA model with measurement invariance follows.
Mplus Program 6.6


In the overall MODEL command of the Mplus program, the categorical latent variable C2 at t2 is regressed on the categorical latent variable C1 at t1 in a latent multinomial logit model. As C2 is a 3-class latent variable, there are 2 logits in the multinomial model with the last latent class (i.e., C2 = 3) as the reference group. In each of the logits, the regressors are two dummy variables representing Classes 1 and 2, respectively, in the latent class variable C1 with the last latent class (i.e., C1 = 3) as the omitted category. In the class-specific model commands MODEL C1 and MODEL C2, the across-time measurement invariance is specified by imposing equality restrictions on the logits corresponding to the item-response probabilities (conditional probabilities) in each class. The numbers put in parentheses after the list of the thresholds in the square brackets (e.g., [u11$1-u15$1∗2](1-5)) label the item thresholds, which are held equal across latent class variables C1 and C2. The equality restrictions are imposed only on the conditional probabilities, not on the unconditional probabilities or the sizes of the latent classes.
The Mplus Program for the 3-class LTA with measurement noninvariance follows:
Mplus Program 6.7

The only difference between Mplus Program 6.7 and Mplus Program 6.6 is that the equality restrictions on the threshold parameters corresponding to the item-response probabilities in each class are removed.
The model results do not clearly show which model fits data better because AIC = 4202.596 and ABIC = 4236.430 are smaller, while BIC = 4357.020 is larger, in the LTA model with measurement noninvariance, compared with the corresponding figures (AIC = 4223.217, ABIC = 4243.695, and BIC = 4316.684) in the LTA model with measurement invariance. We then conduct the LR test to further compare the two models. The estimated model log-likelihood values (L0 and L1), scaling correction factors (c0 and c1), and degrees of freedom (p0 and p1) for the two nested models are:
As described in Section 2.3.2, when a robust estimator (MLR is the default estimator for mixture modeling) was used for model estimation, the χ2 statistics or the log-likelihood values provided in the Mplus output cannot be directly used for the LR test; instead, the following formulas should be used (http://www.statmodel.com/chidiff.shtml):
(6.24) ![]()
where cd is the difference test scaling correction.
(6.25) ![]()
For our example,
(6.26) 
Then
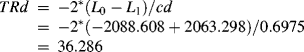
Given degrees of freedom df = (38 − 23) = 15, the LR test is statistically significant (P = 0.0016),7 indicating significant difference in goodness-of-fit between the two models. We conclude that the conditional probabilities or item-response probabilities in the measurement model significantly differ at time points t1 and t2; therefore, we decide to use the 3-class LTA model with measurement noninvariance to further examine the latent class/status transitions from t1 to t2.
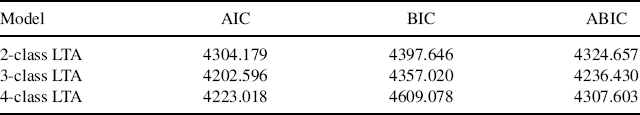
In addition to testing measurement invariance, we also need to compare LTA models with different number of latent classes. Although the LCA models based on individual measurement occasions have shown that the 3-class LCA model is the best-fitting model at both t1 and t2 in our example, the LCA results only provide preliminary information about the number of classes in the LTA model. Different classes might emerge, and additional classes may be detected in the LTA model, partially because repeated measures are utilized in LTA, thus increasing the model's statistical power. Collins and Lanza (2010) recommend that selection of the LTA model should be based primarily on an assessment of fit using data from all occasions of measurement. In our example, we have compared 2-, 3- and 4-class LTA models with measurement noninvariance.
As TECH 11 and TECH 14 are not available in Mplus for models with more than one latent class variable, only information criteria, such as AIC, BIC, and ABIC, were used to compare LTA models with different number of classes at t1 and t2. Our results show that the the 3-class LTA model has the smallest AIC, BIC, and ABIC, therefore fits data better (Table 6.12).
Table 6.12 Comparison of different LTA models (N = 430).
Selected results of the 3-class LTA estimated in Mplus Program 6.7 are shown in Table 6.13. Before we interpret the model results, we need to pay attention to some issues in implementation of the LTA model. First, in Mplus Program 6.7 the threshold parameters specified in the square brackets in each class specific model command are needed; otherwise, the conditional probabilities provided by the current version of Mplus would vary across transition patterns. That is, in our example, the estimated conditional probabilities or item-response probabilities would not be the same for each class in different transition patterns, making it difficult to define the latent classes in the LCAs at both t1 and t2. Secondly, Mplus output provides a warning in our example stating that parameter 36 was fixed in order to avoid singularity of the information matrix though the model estimation terminated normally. TECH1 results (see the bottom of Table 6.13) in the Mplus output show that parameter 36 is the slope coefficient of a dummy variable representing C1 = 1 in the second logit of regressing C2 on C1. This parameter was fixed to a large negative number (−22.446). As a matter of fact, this is not a problem, but indicates there was no transition from Classes C1 = 1 to C2 = 2. As we can see, the probability of transitioning from C1 = 1 to C2 = 2 is 0 in the latent class transition matrix shown in the LATENT TRANSITION PROBABILITIES BASED ON THE ESTIMATED MODEL section of Table 6.13. And finally, the total number of cases assigned to the three classes of C2 was N = 430, instead of the sample size of N = 370 at t2. This is because the FIML was used by default for model estimation. With FIML, cases having even one occasion of measurement in a longitudinal data set will be kept in analysis. As a result, the estimated sizes of latent classes at t2 in the LTA model differ from those in the LCA model based on the cross-sectional data at t2 (see Tables 6.11 and 6.13).
Table 6.13 Selected Mplus output: 3-class LTA model with measurement noninvariance.
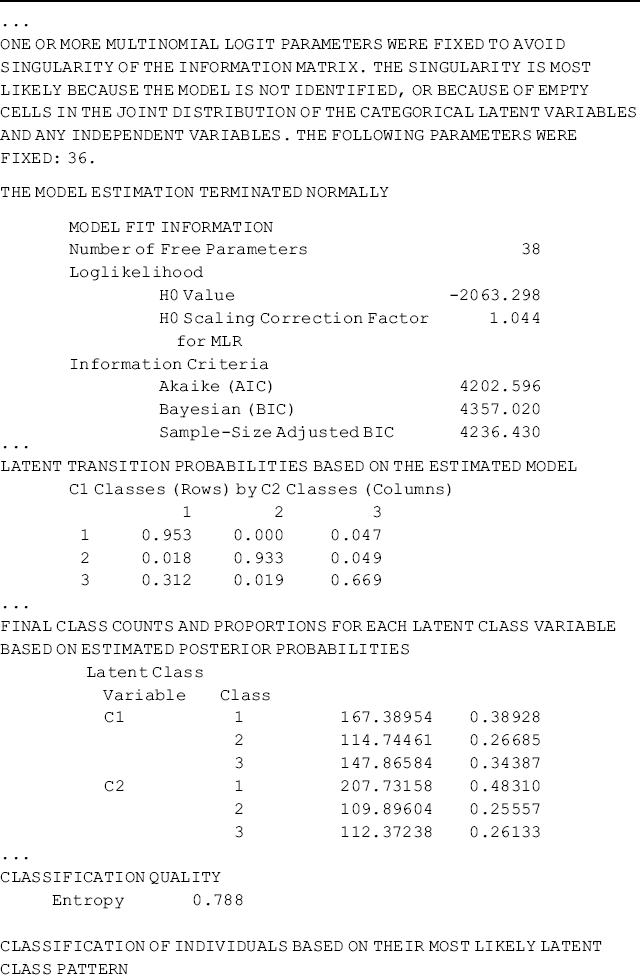


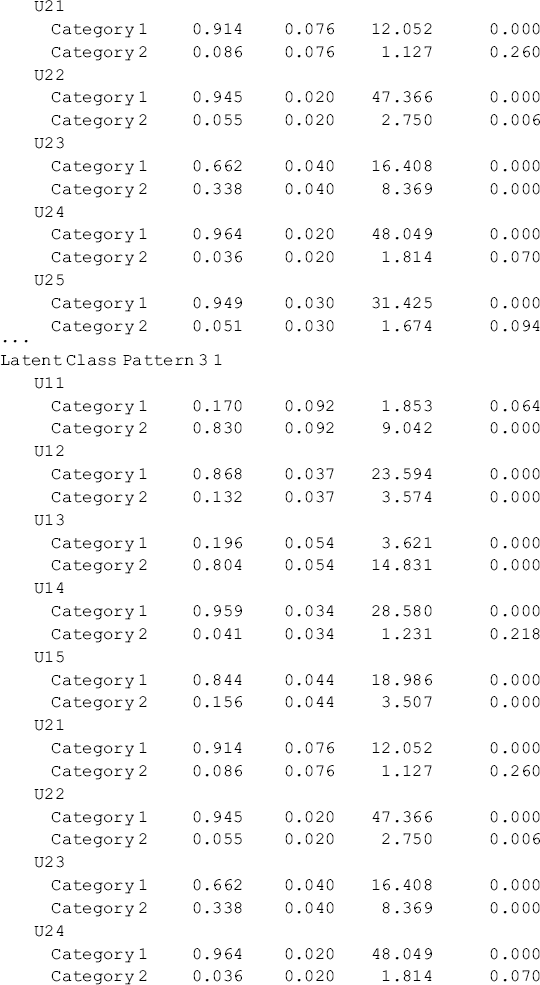


The probabilities by item listed under Latent Class Pattern in the RESULTS IN PROBABILITY SCALE section of Table 6.13 are estimated measurement parameters (i.e., item-response probabilities or conditional probabilities given in a class of C1 or C2). For example, the probabilities for outcome indicators u11–u15 and u21–u25 listed under Latent Class Pattern 1 1 are item-response probabilities given in class C1 = 1 and C2 = 1, respectively. Those item-response probabilities are the same for the same items in all latent class patterns (e.g., the item-response probabilities given in C2 = 1 are the same in Latent Class Patterns 1 1, 2 1, and 3 1 in our example). Based on the item-response probabilities, the latent classes at t1 and t2 can be defined. Like the results of our separate LCA models, the three latent classes determined for both t1 and t2 in our LTA model can be defined as Class 1 in both C1 and C2: Lighter Drug Use; Class 2 in both C1 and C2: Multi-Drug Use; and Class 3 in both C1 and C2: Heavy Alcohol and Crack Use. The latent classes are similarly defined as those in the LCA models based on cross-sectional data though the order of the classes differs.8
The estimated structural parameters are shown in the panel Categorical Latent Variables in the Model Results section of Table 6.13. The meaning of the ‘Means’ by class in the structural parameters is somewhat confusing. Because the latent class variable C1 at t1 has no predictor in the model, ‘Means C1#1’ (0.124) and ‘Means C1#2’ (−0.254) in fact represent the log odds of being in Classes 1 and 2, respectively, in C1. Their corresponding probabilities can be calculated using Equations (6.7)–(6.10) with covariates excluded:
(6.28) ![]()
(6.29) ![]()
(6.30) ![]()
The results match the figures shown in the FINAL CLASS COUNTS AND PROPORTIONS FOR THE LATENT CLASS PATTERNS BASED ON ESTIMATED POSTERIOR PROBABILITIES section in the Mplus output.
The focus of LTA is on the transition probabilities. With three classes in both C1 and C2, there are a total of 9 transitions as shown in the transition matrix of Table 6.14. The off-diagonal figures in the matrix are transition probabilities from specific classes in C1 to specific classes in C2, while the diagonal figures indicate probabilities of staying in the same classes/statuses at t1 and t2 (the figures in this table are from the LATENT TRANSITION PROBABILITIES BASED ON THE ESTIMATED MODEL section of Table 6.13).
Table 6.14 Transition probabilities from latent class C1 to latent class C2.

The class membership transitions from C1 to C2 are modeled by multinomial logit model of regressing C2 on C1. The latent transition probabilities can be calculated using Equation (6.14) based on the logits of regressing C2 on C1 shown in Table 6.15. For example, the transition probabilities of moving from class C1 = 1 at t1 to class C2 = 1, C2 = 2, and C2 = 3 at t2 are calculated as:
Table 6.15 Logits of regressing C2 on C1.

(6.31) ![]()
(6.33) ![]()
The result of Equation (6.32) provides evidence that fixing a slope coefficient in the transition logit to a large negative number (e.g., ![]() = −22.446 in this example) means fixing the corresponding transitioning probability to 0. Other transition probabilities, such as
= −22.446 in this example) means fixing the corresponding transitioning probability to 0. Other transition probabilities, such as ![]() ,
, ![]() ,
, ![]() ,
, ![]() ,
, ![]() , and
, and ![]() , can be calculated in the same way. The calculated figures match the transition probabilities shown in Table 6.14 or in the LATENT TRANSITION PROBABILITIES BASED ON THE ESTIMATED MODEL section in Mplus output (Table 6.13).
, can be calculated in the same way. The calculated figures match the transition probabilities shown in Table 6.14 or in the LATENT TRANSITION PROBABILITIES BASED ON THE ESTIMATED MODEL section in Mplus output (Table 6.13).
Theoretically speaking, covariates can be readily included in the LTA model, thus the latent classes, transition probabilities, and prediction of the latent class membership and transitions can be estimated simultaneously. However, in real studies, researchers find that a LTA model with covariates often does not behave as well as expected. In our example LTA model discussed in this section, we were unable to obtain appropriate structural parameter estimates even with only one covariate predicting the latent class C1 and the transitions from C1 to C2. This might be because of many transition patterns (5 out of 9) having very few cases (see class counts and proportions in the CLASSIFICATION OF INDIVIDUALS BASED ON THEIR MOST LIKELY LATENT CLASS PATTERN section in Table 6.13). As such, covariates were not included in our example model here. For the purpose of demonstration, we will use simulated data to illustrate a LTA with a covariate x, as well as its interactions with latent class membership in Appendix 6.A.
As aforementioned in Section 6.1.2, when latent class membership is clearly classified (e.g., entropy ≥ 0.80) (Clark, 2010), we can save the estimated latent class membership and transition probabilities, and then merge them with the original data set. As such, we can readily examine the relationships between covariates and the latent class membership, and test the effects of the covariates on specific class membership transitions using statistical packages, such as SAS, SPSS, or STATA. For our example model, the entropy = 0.79, which is very close to 0.80, thus we could add the SAVEDATA command (see the upper panel of Table 6.16) into Mplus Program 6.7 to save the latent class and transition information in a text data file (e.g., 3_LTA_OUT.dat). The exported output information are shown in the lower panel of Table 6.16 where variables CPROB1 – CPROB9 are the estimated transition probabilities shown in Table 6.14, the exported variables C1 and C2 are the latent class variables, and the variable MLCJOINT contains information on transition patterns.
Table 6.16 Mplus output information is saved in a text data file for further analysis.

In our example, transition from C1 = 3 to C2 = 1 is interesting. It shows that about 31% of the drug users in the Heavy Alcohol and Crack Use class at time t1 had transitioned to the Lighter Drug Use class at time t2 (Table 6.14). The estimated probability of this transition is saved in variable CPROB7 in the exported data file. By merging the exported data set 3_LTA_OUT.dat with the original data set, we can readily analyze what and how covariates influence this specific transition in drug use practices among the drug users in Ohio.