Chapter 7
PerformancePoint
PerformancePoint provides a very powerful toolset dedicated to designing scorecards and dashboards. PerformancePoint, being introduced in 2007, is one of the newest Microsoft business intelligence (BI) tools.
Compared with other Microsoft BI tools, PerformancePoint offers the designer the most useful functionality. As a key benefit for rapidly designing content, most of the useful functionality need not require planning and specific implementation because the features are common options associated with the various scorecard elements. Balancing this functionality is less control over visual elements, and rather limited print and export options. This chapter will provide an introduction to key PerformancePoint functionality used to develop visualizations.
Tabular versus Multidimensional Sources
The key foundational element used with a PerformancePoint solution is a data source. The data source supplies data for use by key performance indicators (KPIs), analytic charts, grids, dashboard filters, and other PerformancePoint objects. The types of data sources supported for use with PerformancePoint include tabular and multidimensional sources. It is important to note that PerformancePoint will treat both tabular and multidimensional sources the same way for the purpose of design activities.
Tabular data sources include Excel spreadsheets, Excel Services spreadsheets, SharePoint lists, and relational database tables. These tabular-type data sources work best with PerformancePoint when organized in a way that distinguishes columns as either dimension data or fact (measure) data by the PerformancePoint Dashboard Designer during data import. One example of this organization is that a column within a spreadsheet that should contain fact (measure) data must contain only numeric values in order to be classified as a fact source by the Dashboard Designer.
Multidimensional data sources are those that include dimensions, measures (facts), and support—either the MDX or DMX language. PerformancePoint multidimensional data sources presently include Analysis Services and PowerPivot workbooks.
Key usage differences exist among the tabular and multidimensional data source capabilities within PerformancePoint. A key limitation found when using a tabular data source is that data is flattened, so it cannot represent parent/child relationships nor can it model hierarchies between dimensional values. Additionally, tabular sources cannot be used by analytic charts and grids. The data exploration feature, Decomposition Trees, is also not supported for tabular data sources.
Requirements for Running PerformancePoint
This section discusses the various hardware and software requirements for running PerformancePoint and the Dashboard Designer.
The Dashboard Designer, used to create and organize PerformancePoint objects into dashboards, requires a computer having a dual core, 32-bit processor with 2GB of memory and 2GB of disk space. Additionally, a SharePoint-supported browser is required (details are provided in the “SharePoint Requirements” section that follows.
Analysis Services 2000 is no longer being supported as a data source and, along with SharePoint, PerformancePoint requires 64-bit server architecture.
SharePoint Requirements
To install, configure, and run SharePoint web servers and application servers, the host server must have a 4 core 64-bit processor with 8GB of memory and 80GB of disk space. Additionally, the database server that stores the SharePoint data requires a 4–8 core 64-bit processor with 8–16GB of memory and 80GB of disk space. This database server requires a 64-bit edition of Microsoft SQL Server from the following versions:
- Microsoft SQL Server 2012 (requires SharePoint Server 2010 SP1 or later)
- Microsoft SQL Server 2008 R2
- Microsoft SQL Server 2008 SP1 with Cumulative Update 2 for SP1
- Microsoft SQL Server 2005 SP3 with Cumulative Update 3 for SP3
A 64-bit version of Window Server 2008 with SP2 or Windows Server 2008 R2 or later is required for SharePoint installation, and the SharePoint preparation tool will install any of the following if they are missing from the server:
- Web Server (IIS) role
- Application Server role
- Microsoft .NET Framework version 3.5 SP1
- Microsoft Sync Framework Runtime v1.0 (x64)
- Microsoft Filter Pack 2.0
- Microsoft Chart Controls for the Microsoft .NET Framework 3.5
- Windows PowerShell 2.0
- SQL Server 2008 Native Client
- Microsoft SQL Server 2008 Analysis Services ADOMD.NET
- ADO.NET Data Services Update for .NET Framework 3.5 SP1
- A hotfix for the .NET Framework 3.5 SP1 that provides a method to support token authentication without transport security or message encryption in Windows Communication Foundation (WCF)
- Windows Identity Foundation (WIF)
SharePoint requires a supported Internet browser in order to successfully view and interact with content. Support for Internet browsers is categorized into supported, supported with limitations, and not supported (as follows):
Table 7-1: SharePoint 2010 Supported Browsers
| Browser | Supported | Support with Limitations | Not Supported |
| Internet Explorer 10 | 32-bit | 64-bit | |
| Internet Explorer 9 | 32-bit | 64-bit | |
| Internet Explorer 8 | 32-bit | 64-bit | |
| Internet Explorer 7 (no longer supported in 2013) | 32-bit | 64-bit | |
| Internet Explorer 6 | X | ||
| Google Chrome | X | ||
| Mozilla Firefox | X | ||
| Apple Safari | X |
The first step in installing PerformancePoint Services is ensuring that the Enterprise Features are installed. To do this, go to Upgrade and Migration in the Central Administration site, and click Enable Enterprise Features. This is only necessary once for any Enterprise Feature. After you have done this, enable these features by clicking Enable features on existing sites. This will enable the Enterprise Features across all existing sites—you can do this manually if you want to enable the features on only some sites. The next step is to run the configuration wizard—make sure to choose PerformancePoint and the Secure Store service!
Authentication Issues when Using Secure Store Service
To successfully use PerformancePoint a Secure Store Service (SSS) is required to be configured. When an SSS is not properly configured, the Dashboard Designer will have errors when trying to create new data sources that are resolved by ensuring that the SSS is running, it has a correctly generated encryption key, and an unattended service account is set for PerformancePoint.
SSS may already have been configured for another application, but if it has not, it will need to be set up. The steps to be taken are:
Configure a Secure Store by registering a managed (domain) account in SharePoint (via Central Administration > Security > General Security) to run the Secure Store application pool, start the SSS (via Central Admin > Application Management > Service Applications > Manage Services on Server) on the application server in the SharePoint farm, and create an SSS application (also via Central Admin > Application Management > Service Applications > Manage service applications).
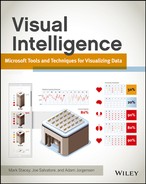
From Central Admin, choose the Manage Service Applications option under Application Management, then click the Secure Store Service and you will see a screen like Figure 7-1.
Figure 7-1: Secure Store Service
If there are no applications listed, you will need to start by generating a new key—this is the key that will be used to encrypt the credentials stored in the Secure Store Service, so ensure that you save the passphrase in a secure location.
Now that you have created a key to encrypt the usernames, you will set up the account that PerformancePoint will use.
Set an unattended service account using SharePoint Central Administration by selecting Manage Service Applications and then clicking the PerformancePoint Service Application. Select PerformancePoint Service Application Settings and set the username and password for the Unattended Service Account.
KPIs, Scorecards, Filters, Reports, and Dashboards
This section gives you a tour of the various component objects within PerformancePoint along with an overview of how each contributes to the design of a data presentation solution. In order to create any of these components, a site collection using the BI Center template is required. You create a new site collection in Central Admin > Manage Applications > Create site collection and choosing the Business Intelligence Center under the Enterprise tab.
Creating a Data Source
To connect PerformancePoint to the data, a data source is required. SharePoint further requires that all data connections be stored in a trusted data connection library. When PerformancePoint Services is configured, it automatically trusts all SharePoint libraries—this can be overridden to allow only certain libraries to contain PPS data sources.
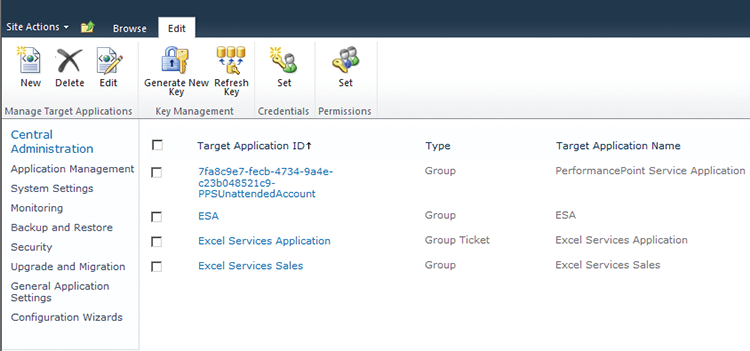
All PerformancePoint design occurs within a tool named Dashboard Designer. There are several ways to start the Dashboard Designer. If not previously installed, from web browser, open the Business Intelligence Center, select a section from Monitor Key Performance, Build and Share Reports, or Create Dashboards, and click the Start using PerformancePoint Services link. On the PerformancePoint site, click the Run Dashboard Designer button. You can also open the Dashboard Designer by opening the Business Intelligence Center or the PerformancePoint site, right clicking on any PerformancePoint content listed and selecting the Edit in Dashboard Designer. After Dashboard Designer has been opened previously, you can launch it from the Start menu (via Start > All Programs > SharePoint > PerformancePoint Dashboard Designer).Within PerformancePoint, as shown in Figure 7-2, the data source can be created by selecting the Data Source menu option located on the Create Menu of Dashboard Designer or from within a SharePoint Data Connections library by selecting New Document from the Documents view. The server name will need to be inserted next. Often, “.” can be used if you are working from a local machine, else the server name will be required. Sometimes an instance name in the format “servernameinstancename” will be needed. Then you should be able to choose the appropriate database from the drop-down, and then the cube from the drop-down.
Figure 7-2: Methods of creating new PerformancePoint data sources
Mapping the Time Dimension
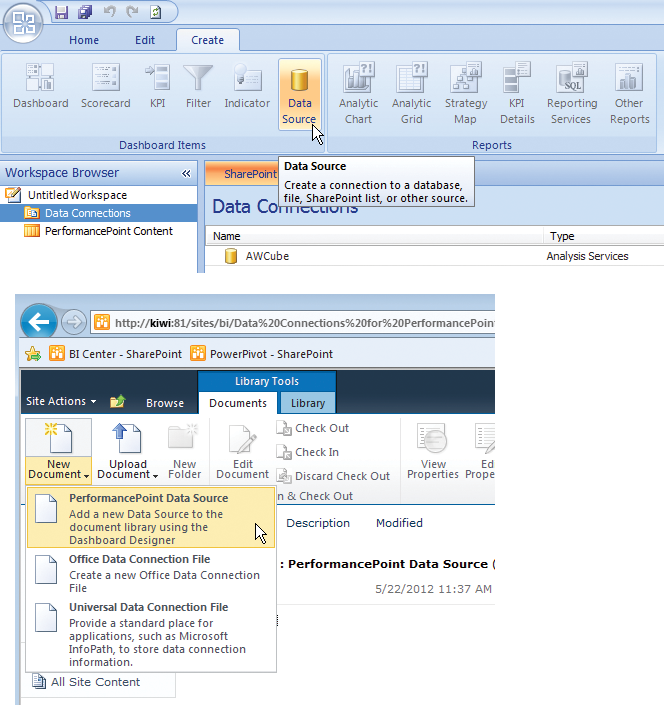
Figure 7-3: Configuring PerformancePoint data sources with Time Intelligence
PerformancePoint has a Time Intelligence feature to support a rich variety of common time selections such as Last Quarter, Current Financial Year, or Last 3 Quarters. This Time Intelligence feature associates a common time label with a specific filter period that is defined using the Simple Time Period Specification (STPS) language.
Configuration of Time Intelligence is performed on the data source using the Time tab. This is covered in the “Installing the PerformancePoint Samples” section at the end of the chapter, specifically for the samples used in the book. After starting by selecting a dimension in the data source that stores calendar dates, a reference date to begin a year for the dimension is provided.
Next, the hierarchy level of the date provided is selected. In the case of a date of January 1, 2005, the hierarchy level may be set to Day. A reference date that is equal to the period specified by the hierarchy level is entered and then each member level has its appropriate time aggregation set to the dimension level corresponding with a given member level (e.g., Calendar Year member level is mapped to Year time aggregation level). A sample Time Intelligence Reference Data Mapping is demonstrated in Figure 7-3.
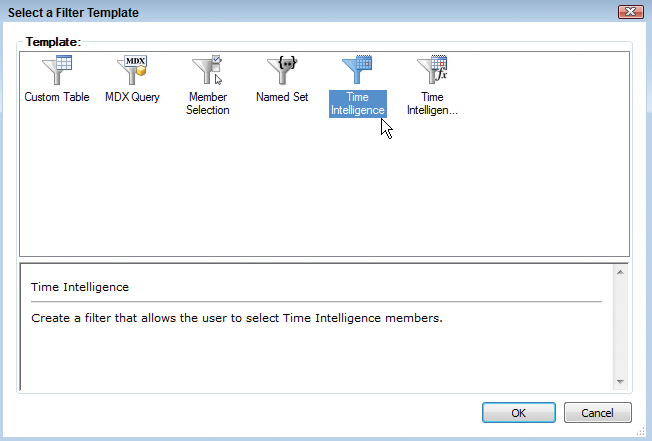
With the Time Intelligence properly configured for a PerformancePoint data source, the Time Intelligence formulas can be used within a filter created by selecting the Time Intelligence template when creating a new filter. Figure 7-4 shows the selection of a Time Intelligence filter from the Select a Filter Template dialog box that appears when creating a new filter within PerformancePoint.
The resulting Time Intelligence filter can be added to PerformancePoint dashboards in order to permit users selecting these common Time Intelligence date values.
Figure 7-4: Creating a PerformancePoint filter that uses Time Intelligence
Quick Samples
Formula structure: [(]<Period>[Offset>[)][ <Function>[<Offset>]]]
Table 7-2: Example Formulas
| To Display | Formula | Result |
| Yesterday | day-1 | The previous day relative to the current date. |
| Tomorrow | day+1 | The next day relative to the current date. |
| The current quarter and today | quarter, day | A set of time periods consisting of the current day and current quarter. |
| Last 10 days | day:day-9 | A 10-day range including today. |
| Last 10 days (excluding today) | day-1:day-10 | A 10-day range NOT including today. |
| Same day last year | (year-1).day | Current date (month and day) for last year. For example, if the current date were December 10, 2010, then (year-1).day would show information for December 10, 2009. |
| Same month last year | (year-1).month | Current month for last year. For example, if the current month were December, 2010, then (year-1).month would show information for December, 2009. |
| Same range of a period of six months last year | (year-1).(month-5): (year-1).(month) | From 18 months ago to one year ago. For example, if the current month were December 2010, then (year-1).(month-5): (year-1).month would show information for the time period ranging from June, 2009 to December, 2009. |
| Same range of months to date for last year | (year-1).firstmonth: (year-1).month | From the first month of last year up to and including the month parallel to the current month this year. |
| Year to date | yeartodate | A single time period representing the aggregation of values from the beginning of the year up to and including the last completed period. The period corresponds to the most specific time period defined for the data source. |
| Year to date (by month) | yeartodate.fullmonth | A single time period representing the aggregation of values from the beginning of the year up to and including the last completed month. |
| Year to date (by day) | yeartodate.fullday | A single time period representing the aggregation of values from the beginning of the year up to and including the last completed day. |
| Parallel year to date | yeartodate-1 | The aggregation of the same set of default time periods completed in the current year except for the prior year. |
| Parallel year to date (by month) | (yeartodate-1).fullMonth | The aggregation of time periods last year that is equal to year to date periods for the current year. |
General conventions
- When no offset is specified, the current period is assumed.
- Using a time period with an offset along with a function requires the use of parentheses.
- Casing of formulas does not impact formula evaluation or meaning.
- White-space does not impact formula evaluation or meaning.
- Time period including “to date” permits the use of offsets.
- Formulas should use singular nouns rather than plural nouns (e.g., year not years)
Syntax Elements
Operators (Table 7-3), time periods (Table 7-4), and functions (Table 7-5) are used to create TI formulas.
Table 7-3: Operators
| Operator | Use |
| . | The period or “dot” operator delimits time periods from functions. The string in front of the dot always corresponds to the time period. The string following the dot always corresponds to the time period function. Example: year.firstMonth |
| + or - | The plus (+) and minus (-) operators are used to determine the offset relative to the current date. Use the minus sign (-) to specify time periods in the past. Use the plus sign (+) to specify time periods in the future. Example: day-1 |
| () | Parentheses are used to group a time period and its offset when you use them together with a function. Required. Example: (year-1).firstMonth:(year-1).month |
| , | Commas are used to delimit multiple time periods in the same formula. Example: year, Quarter, Month, day |
| : | The colon operator (:) specifies a range of time periods. Example: day:day-4 |
Standard Time Periods
Table 7-4 shows standard time periods used within TI formulas.
Table 7-4: Standard Time Periods
| Period | Example |
| Year | Year-1, year+2 |
| Quarter | quarter, Quarter-4 |
| Month | Month-2 |
| Week | Week-51 |
| Day | Day-9, day+2 |
| Hour | Hour-12 |
| Minute | minute-30 |
| Second | second+5 |
Standard Time Period Functions
TI formulas can use the time period functions provided in Table 7-5 to modify any standard time period via usage of the dot operator (.).
Table 7-5: Standard Time Period Functions
| Function | Use |
| FirstQuarter | Specifies the first quarter in a year. |
| LastQuarter | Specifies the last quarter in a year. |
| FirstMonth | Specifies the first month in a year or quarter. |
| LastMonth | Specifies the last month in a year or quarter. |
| FirstWeek | Specifies the first week in a year, quarter, or month. |
| LastWeek | Specifies the last week in a year, quarter, or month. |
| FirstDay | Specifies the first day in a week, month, or larger time period. |
| LastDay | Specifies the last day in a week, month, or larger time period. |
| FirstHour | Specifies the first hour in a day, week, or larger time period. |
| LastHour | Specifies the last hour in a day, week, or larger time period. |
| FirstMinute | Specifies the first minute in an hour, day, or larger time period. |
| LastMinute | Specifies the last minute in an hour, day, or larger time period. |
| FirstSecond | Specifies the first minute in a minute, hour, or larger time period. |
| LastSecond | Specifies the last minute in a minute, hour, or larger time period. |
Period-to-Date Formulas
PerformancePoint 2010 introduced period-to-date formulas in order to provide a way to aggregate data up to the last completed period requested. These formulas will exclude incomplete time periods and use the lowest time precision supported by the underlying data source. The period-to-date periods shown in Table 7-6 may be used within TI formulas.
Table 7-6: Period-to-Date Formulas
| Period | Use |
| YearToDate | Specifies a time period from the beginning of the year to the current period. |
| QuarterToDate | Specifies a time period from the beginning of the quarter to the current period. |
| MonthToDate | Specifies a time period from the beginning of the month to the current period. |
| WeekToDate | Specifies a time period from the beginning of the week to the current period. |
| DayToDate | Specifies a time period from the beginning of the day to the current period. |
| HourToDate | Specifies a time period from the beginning of the hour to the current period. |
| MinuteToDate | Specifies a time period from the beginning of the minute to the current period. |
Period-to-Date Functions
Formulas needing to specify periods may use the period-to-date functions including those provided in Table 7-7.
Table 7-7: Period-to-Date Functions
| Function | Effect |
| FullQuarter | Specifies that the period to date should include up to the last full quarter. |
| FullMonth | Specifies that the period to date should include up to the last full month. |
| FullWeek | Specifies that the period to date should include up to the last full week. |
| FullDay | Specifies that the period to date should include up to the last full day. |
| FullHour | Specifies that the period to date should include up to the last full hour. |
| FullMinute | Specifies that the period to date should include up to the last full minute. |
| FullSecond | Specifies that the period to date should include up to the last full second. |
Parallel Period-to-Date
Formulas often require the ability to compare and contrast values across similar periods during the current and prior years. Time Intelligence formulas support including an offset value to the to-date period needed as shown.
YearToDate-1 The formulas support any to-date time period including those using a full period function.
(YearToDate-1).FullMonth KPIs
A critical component used to measure and track performance is a key performance indicator (KPI). Within PerformancePoint, a KPI represents a measurement of a particular business process, including the actual value from a data source, a desired target achievement level, the visual indicators used when reporting the result of comparing the target with actual values, and a scoring pattern that represents the method used when scoring the resulting comparison value.
To create a KPI, open the Dashboard Designer and select the KPI dashboard item from the Create menu. On the KPI Template dialog box, the Blank KPI option is selected, and the KPI editor is then used to map the KPI to data sources. Figure 7-5 illustrates a sample KPI being created by the KPI editor.
Figure 7-5: Creating a PerformancePoint KPI using the KPI editor
Configure the data sources for both actual and target rows within the KPI editor by clicking the 1 (Fixed Values) link that is located within the Data Mappings column. Note that the actual and target data mappings are configured separately, so support is mapped to different sources. Multiple actual and target values per KPI is available. This supports, as an example, the ability to provide multiple period, actual and target evaluation of the KPI (e.g., Now, This Month, This Year).
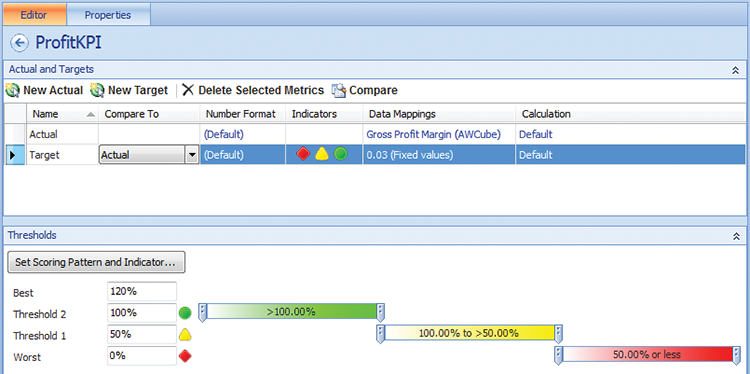
Selecting the proper scoring pattern and indicators involves editing a target row within the KPI editor and setting the scoring pattern, banding method, desired indicators, and worst value expected. Figure 7-6 demonstrates information provided by the Edit Banding Settings editor within PerformancePoint.
The scoring patterns define whether a resulting value is considered a good or bad score and include the following options:
- Increasing Is Better: No upper limit on what is considered good and larger values are desired
- Decreasing Is Better: No lower limit on what is considered good and smaller values are desired
- Closer To Target Is Better
Figure 7-6: Editing banding setting for a KPI target

The banding method defines how values are compared in order to generate a status value and includes the following options:
- Band By Normalized Value Of Actual/Target: Enables comparison of scores that would otherwise be incompatible (e.g., percentages and dollar amount values) by converting the raw KPI values to a common scale and then averaging the converted scores
- Band By Numeric Value Of Actual: Uses exact values for thresholds that divide the status levels
- Band By Stated Score (Advanced): Specifically ignores the calculation of a score and uses a defined value from the data source
Scorecards
Some of the most useful and powerful objects within PerformancePoint, scorecards are used to display snapshots of business’ performance by displaying key performance indicators (KPIs). The scorecard is organized into groupings of related goals referred to as objectives and their component metrics. Figure 7-7 shows an example of a PerformancePoint scorecard with a Profit KPI being measured across Sales Territories.
Figure 7-7: PerformancePoint scorecard

A scorecard, ultimately, is a special PerformancePoint report that can include the following features:
- Status indicators showing a summary of the current actual performance versus a targeted value
- Trend indicators showing how values have performed versus a prior time period
- KPIs that measure performance comparing actual values with desired target values
- Drill-down/drill-up navigation in order to see different levels of detail by expanding or collapsing rows or columns
- Time Intelligence for displaying dynamic time period values (e.g., Last Two Quarters)
- Analysis of individual member contributions via a Decomposition Tree
- Filtering of other reports on the dashboard based upon the current selection within the scorecard
- Special filtering of top/bottom values
- Export to PowerPoint or Excel
- View information about a given KPI using a KPI details report
Filters
Enabling end users to target the data in which they want to analyze within a dashboard is accomplish by designing PerformancePoint filters. Filters can be classified as one of two types: dashboard filters and object filters. The dashboard filters are separate PerformancePoint objects designed for use in a single dashboard or across multiple dashboards. Object filters are found within analytic reports and scorecards. It is important to note that a scorecard can also be used as a filter for other dashboard objects on the scorecard.
Several types of dashboard filters are available, as follows:
- Member Selection: Uses Analysis Services or tabular dimension members
- MDX Query: Uses Analysis Services to form an expression
- Named Set: Uses Analysis Services items defined as a named set
- Time Intelligence: Enables specific preconfigured time filters specified using Simple Time Period Specification (STPS) syntax
- Time Intelligence Connection Formula: Similar to the Time Intelligence filter, but uses a calendar to permit date selection
- Custom Table: Enables using a data table created within an application such as Excel
Connecting filters to various other PerformancePoint objects is described later in this chapter. Note that depending on the type of dashboard filter, different items should be selected to configure the source value sent from the filter as shown in Table 7-8.
Table 7-8: Filter Connections Table
| Connect To Object | Source Value | Notes |
| Dimension Values | Member Unique Name | Replaces rows or columns with the selections made within the filter |
| Axis, Page, Row, Column Hierarchies | Display Value | Captions from object’s data source displayed when matching filter selections |
| Time Intelligence Formula | Formula | Filters scorecards to the period of time selected |
| Current Date-Time | Current date-time | Filters scorecards to the current date |
| Time Dimension | Data source | Filters analytic charts and grids with the specified period supplied by the Time Intelligence formula |
Analytic Reports
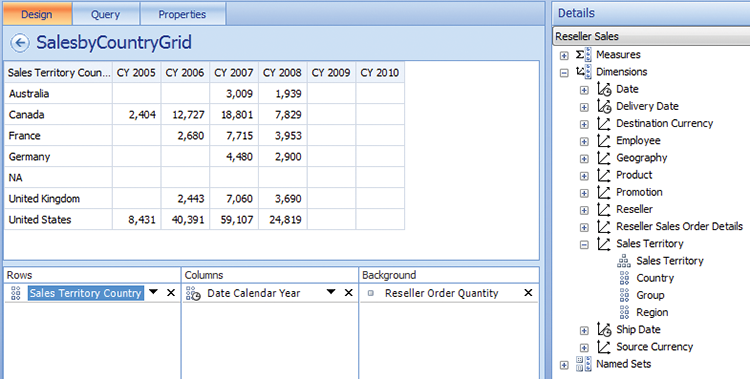
Reporting on data with PerformancePoint often involves the creation of analytic reports that include analytic grids and analytic charts. The Analytic components require Analysis Services. Both are designed by dragging and dropping available objects from the Details pane on the right side of the Dashboard Designer into the Rows/Series, Columns/Bottom Axis, or Background designer panes located below the report design. The analytic report requires that the Rows/Series and Columns/Bottom Axis contain items while placing items in the Background is optional. An example analytic report in design within Dashboard Designer is shown in Figure 7-8.
Figure 7-8: Adding PerformancePoint Objects to an analytic report
The analytic reports are highly interactive; supporting many powerful capabilities, including the following:
- Pivoting the data displayed
- Using Analysis Services actions
- Sorting values
- Sorting chart legend values
- Filtering: Removing empty values, selecting particular value, removing a value
- Drilling up/drilling down to view different levels of detail
- Exporting to PowerPoint or Excel
- Applying top or bottom filtering
- Viewing contributions of members using a Decomposition Tree
- Changing to a chart
Dashboards
PerformancePoint combines various different objects represented as web parts into a dashboard or web part page. As a result, the dashboard is the central visual organizing component, responsible for determining what content appears and where it is located on the web page. Dashboards are divided into zones that can host the various forms of PerformancePoint content, including the following:
- Scorecards
- Reports (analytic charts and analytic grids)
- Filters
- Non-PerformancePoint content (e.g., Excel Services, Reporting Services reports)
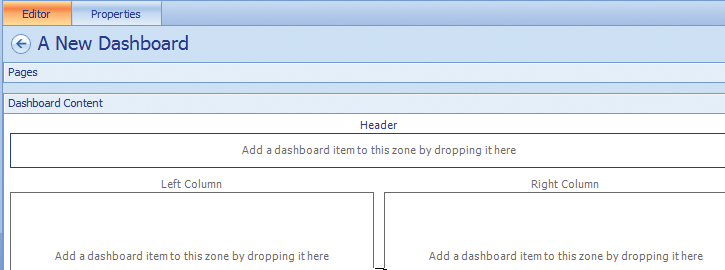
The dashboard is designed by dragging and dropping available objects (e.g., scorecards, reports encompassing analytic charts and analytic grids, and filters) from the Details pane on the right side of the Dashboard Designer into a dashboard zone located in the Dashboard Content section of the Editor window. Figure 7-9 shows the design of a new dashboard having a header zone spanning the width of the dashboard with left and right column zones directly beneath the header.
Figure 7-9: Dashboard content zones
Once the dashboard design is completed, it is published to a designated SharePoint site that has been previously configured to work with PerformancePoint.
Combining Visualizations in PerformancePoint
This section introduces some of the non-PerformancePoint content that may be included within the PerformancePoint dashboard. Examples include Reporting Services reports and Excel spreadsheet reports.
Embedding an SSRS Report
Reporting Services offers a great deal of flexibility in how it renders data while also offering additional chart types that are not found within PerformancePoint. Furthermore, many existing reports contain key information desired for inclusion within a PerformancePoint dashboard. Lastly, scorecards that are used within the dashboard can filter the reports.
Adding Reporting Services reports to PerformancePoint is done by navigating to the PerformancePoint content library within SharePoint, selecting a new report, and then selecting the Reporting Services report template. Next, specific reporting settings are configured as needed, including these:
- Server mode (SharePoint Integrated or Native)
- Report Server URL
- Report URL
- Display Options (show toolbar, parameters, and docmap)
- Zoom (percent of actual rendered report size to display in a web part)
- Format (e.g., HTML 4.0)
- Section (to limit just part of a report to be included)
- Report parameters
Once the report has been added to the PerformancePoint content library, it can then be added to a dashboard as other PerformancePoint objects. Additionally, the report can be configured to work with PerformancePoint connections permitting, for example, filtering by passing values to report parameters.
Embedding Excel Reports
Excel files often contain very useful and important business information that is desired for inclusion in a PerformancePoint dashboard. SharePoint allows Excel files to be used directly on SharePoint sites when Excel Services is configured. Once Excel Services is enabled and Excel workbooks are stored within the SharePoint site, support for these files is provided within PerformancePoint by the Excel Services type of report.
To create an Excel Services report, open Dashboard Designer, and from the Create menu and Reports menu group, select Other Reports. Figure 7-10 shows the selection of Other Reports from within the Report Ribbon group within Dashboard Designer.
Figure 7-10: Creating other reports in Dashboard Designer

Within the Report Template dialog box, select an Excel Services report. Finally, configure the Editor properties with the following:
- SharePoint site: The SharePoint site hosting the Excel file
- Document library: The specific SharePoint library hosting the Excel file
- Excel workbook: The name of the Excel file
- Item name: The specific named item to display from the Excel file
Once the Excel Services report has been added to the PerformancePoint content library it can then be added to a dashboard as other PerformancePoint objects. Additionally, the report can be configured to work with PerformancePoint connections—permitting, for example, filtering by passing values to report parameters.
Creating Web Part Pages in SharePoint
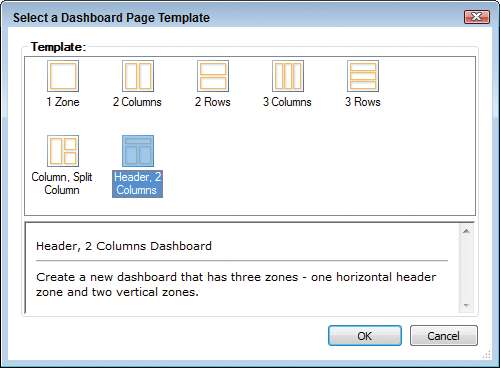
SharePoint uses web part pages that contain web parts displaying various types of content. Site owners, site members, and others having the necessary permissions can create and modify web part pages, adding or removing web parts to arrange the content of the pages. Likewise, PerformancePoint dashboards are created by selecting a template that has zones, putting PerformancePoint objects together in the zones and establishing connections between the objects so they can pass values for filtering or other actions. Figure 7-11 shows the templates available for designing the dashboard zones, columns, and rows.
Figure 7-11: Selecting a Dashboard page template
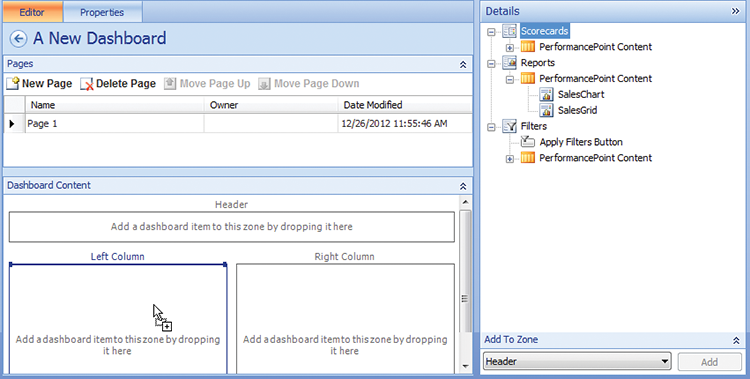
Adding Web Parts
Within Dashboard Designer, adding content to the page is accomplished by dragging PerformancePoint content (e.g., scorecards, reports, and filters) from the Details pane to the Dashboard Content section. The content is then placed into the desired zone (e.g., Left Column, Right Column, or Header—when using the Header, 2 Columns dashboard page template). Figure 7-12 shows what Dashboard Designer displays while dragging a scorecard into the dashboard’s Left Column zone.
Figure 7-12: Dragging Items onto Dashboard Zones
PerformancePoint Connections
A key advantage of using PerformancePoint is the ease in which dashboard connections and filters can be designed and configured. PerformancePoint objects that support providing or receiving connections use the Connections dialog box to configure the connection. Complex filtering can be performed by refining connections by using connection formulas (e.g., a Dimension value filter can show just those values selected while the connection formula could further refine the selection to include the top five).
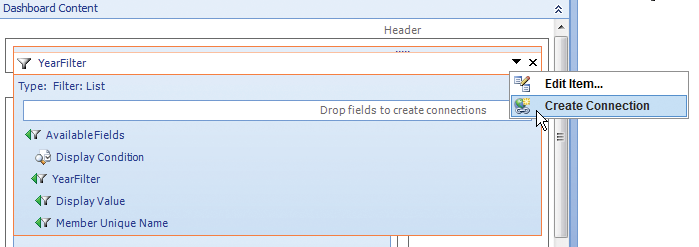
In order to connect a filter to an existing PerformancePoint object, open the Dashboard Designer. Within the Details pane located on the right side, expand the Filters section and the PerformancePoint Content section. Simply drag the desired filter to a dashboard zone in the middle pane. Once the filter is located in the dashboard zone, click the down arrow on the right side of the filter name and select Create Connection. Figure 7-13 demonstrates the option of using a PerformancePoint object’s action option menu to create a connection.
Figure 7-13: Using the Create Connection menu option
The Connection dialog box will display; on the Items tab set the Send Values To drop-down list to the PerformancePoint object that will receive the values from the filter. On the Values tab of the Connection dialog, set the Connect To value to the target field that will get filtered, and set the Source Value to the appropriate value based upon the source being used (e.g., Member Unique Name is commonly used with Analysis Services filter sources). Figures 7-14 and 7-15 illustrate the connection dialog steps to connect a filter to another dashboard object and also what the target object looks like after the connection has been successfully implemented.
Figure 7-14: Connection dialog items and values tabs
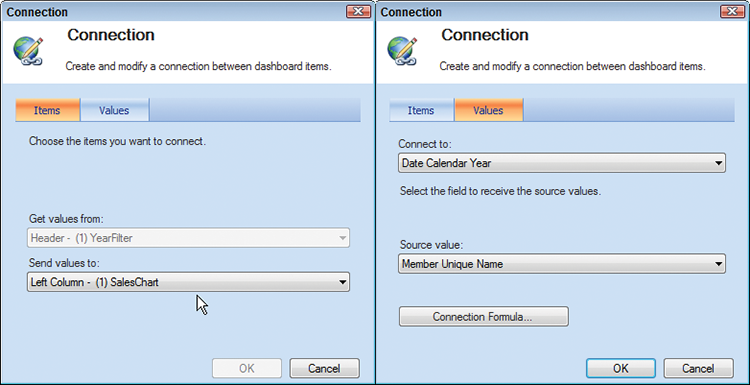
Figure 7-15: Analytic chart with year filter connection
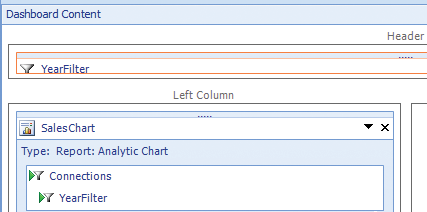
The result is a fully functional filtering of a PerformancePoint object using a PerformancePoint filter. Other comparable connections are configured in a similar fashion, and all support the capability to pass values to and from different dashboard objects in order to support advanced capabilities.
Time Intelligence expressions and MDX queries can be used as expressions within connection formulas. When using Time Intelligence expressions, the Simple Time Period Specification (STPS) syntax is required for defining the expression. STPS syntax and examples were provided earlier within this chapter’s “Mapping the Time Dimension” section. MDX queries used as expression will include monikers included within double angled brackets. The following MDX expression example uses the MDX nonempty values function combined with the Sourcevalue moniker to map to the value being passed by a source using the connection:
NONEMPTY(EXISTS([Dimension].[Hierarchy - Dimension].[Level number].
members,<<SourceValue>>,'Measure Group'))
Installing the PerformancePoint Samples
Each chapter with a PerformancePoint sample has a ZIP file with the PerformancePoint files, which have an .DDWX extension. Start by unzipping this file. To use the samples, open Dashboard Designer, then click Import items on the home screen and browse to the .DDWX file, then click OK. That will bring up a screen like Figure 7-16.
Figure 7-16: Importing PerformancePoint components
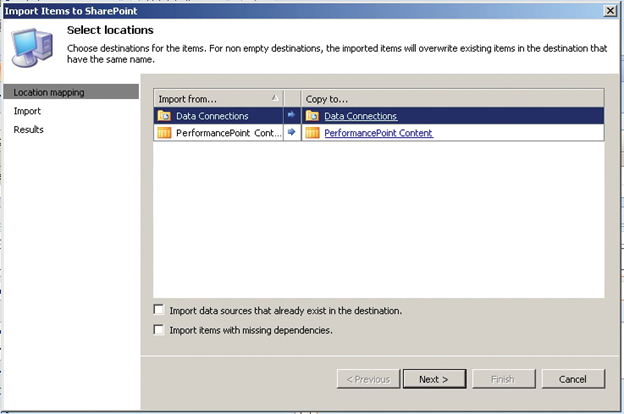
Click Next to import, then click Finish to finalize the import.
You will need to modify the data source to point to your local Analysis Services instance—do this by clicking on dsOECD, and editing the server name to your server, and then choosing the appropriate database and cube. This should be OECD_Data and Model, as shown in Figure 7-17, but your server name will likely be “.”.
Next, you need to map the time source. The first step is to choose the hierarchy with the dates from the model—in this case it is DimDate.YMD. Next, choose a date to map. The date is important, as year calculations are all based on that day being the first day of the year, so you’ll choose the 1st of January. You do this clicking browse, then choosing the date. You’ll choose “Day” as the date to map, and then you will choose what date this entry in the dimension maps to in live dates. You can use this to map “Today” to an equivalent date in the past, and with the Adventure Works data you will almost always do this: in production data you will always choose the same date. Finally, you need to set the Time Member Associations: YearName to Year, MonthName to Month, and Date to Day. You should then see a screen like Figure 7-18. Finish by saving your data source.
Figure 7-17: Setting up a data source
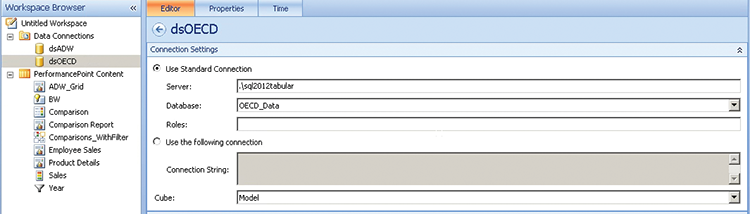
Figure 7-18: Setting up a data source

Summary
This chapter introduced PerformancePoint and its key features. First, a comparison and contrast of tabular and multidimensional data sources was provided, followed by a review of requirements for running SharePoint and PerformancePoint. Next, some considerations for authenticating with data sources using the Secure Store Service (SSS) were outlined. A tour of the key PerformancePoint components, including data sources, Time Intelligence mapping, key performance indicators (KPIs), scorecards, filters, analytic reports, and dashboards was provided. Finally, combining visualizations in dashboards as well as constructing PerformancePoint dashboard pages was detailed.