Appendix A
Choosing a Microsoft Tool
When working in the Microsoft business intelligence toolset, it’s important to realize that you will not standardize on one tool for your visualizations. Each tool in the tool box has its own purpose, and you will frustrate yourself trying to make the wrong tool do the job of another—just as it would be frustrating to try to drive in a nail with a screwdriver. In this appendix, you discover the strengths and weaknesses of each tool.
Strengths and Weaknesses of Each Tool
As mentioned in Chapter 2, the Microsoft toolset loosely follows the strategic/tactical/operational levels, with a tool for each level. However, the correlation is loose, and with the launch of Power View as an application within SharePoint and a visualization within Excel, the tactical level has been split into two categories: PowerPivot in Excel for the data modeling, and Power View for the visualization. Consequently, the correlation between the toolset and the levels has become even weaker. This chapter explores the uses of each tool and shows you how to choose which to use.
PerformancePoint
As described in Chapter 3, PerformancePoint Services (PPS) has its antecedents in the original Business Scorecard Manager. The strongest feature of PPS is the scorecard building component.
PerformancePoint is directly aimed at the process of looking at a scorecard and quickly identifying where a problem exists, and then exploring prebuilt analysis paths to identify root causes of the problem.
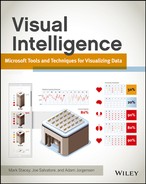
A key point about PerformancePoint is that it is ideal for driving analysis from a monitoring point of view, clicking on a value in a scorecard to change values in associated charts and grids. It has the ability to have either a PerformancePoint Analytic Chart or an Excel Services or Reporting Services report embedded on the same page, and driven by the scorecard. Figure A-1 shows a mixture of PerformancePoint components, a map created within Reporting Services, and an Analytic Chart below. Clicking the scorecard updates the map as well as the chart, and the chart allows for additional drilling down.
Figure A-1: PerformancePoint interactive dashboard
PerformancePoint is particularly poorly suited for printing, as the SharePoint elements, such as navigation and the Ribbon, are typically also printed.
Reporting Services
Reporting Services is squarely aimed at the high-fidelity reporting audience. It is more complex to develop than either PerformancePoint or Excel, and is typically a developer function, even when using Report Builder, but offers a level of control over the display not allowed in the other tools. A rather complex but exceptionally powerful expression language enables a developer to do exceptionally powerful conditional formatting.
In addition, Reporting Services and Power View are the only two tools that include mapping capabilities, and Reporting Services allows for much greater customization of the maps.
Reporting Services is often used where inclusion of specific formatting elements, such as logos, time of running reports, and so on, are required—for instance, in a monthly board pack that needs to be printed.
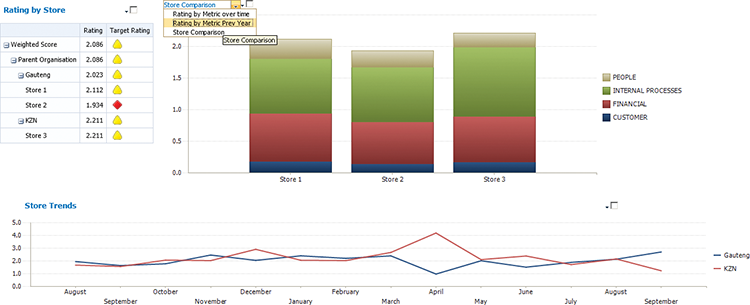
Figure A-2 shows an example Reporting Services front page.
Figure A-2: A report showing the progress of initiatives in a government department
Excel/Excel Services
Excel is and has always been the domain of the analyst—someone who wants to interact with his data and have a dynamic visualization rather than a static one. Pivot tables and pivot charts, with slicers, enable a user to build an interactive dashboard, and the ability to publish on the web using Excel Services allows for the sharing of the analysis while preserving the interactivity. The inclusion of PowerPivot (in Excel 2010) and Power View (in Excel 2013) advances this interactivity greatly.
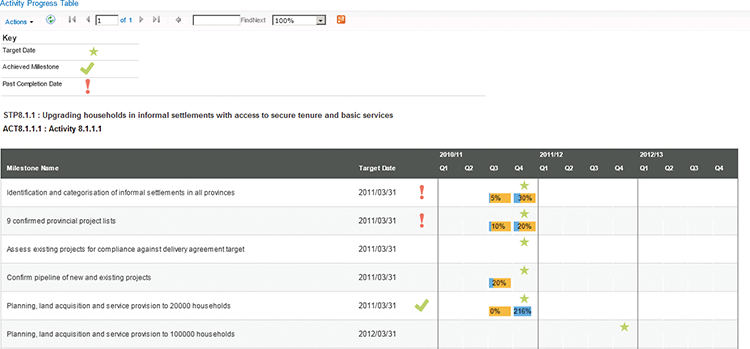
Figure A-3 shows an example of an Excel dashboard.
Figure A-3: An interactive Excel dashboard including a bullet chart at the bottom
Power View
Power View is designed for data exploration. You use this tool when you do not know what question you should be asking, but want to explore and discover patterns in your data. For developers, it is important to put away your assumptions about Report Builder when working with Power View, The approach is not really to give your users a prebuilt Power View report, but to give them a model that they can explore on their own—or with PowerPivot—to build a model and explore it using Power View.
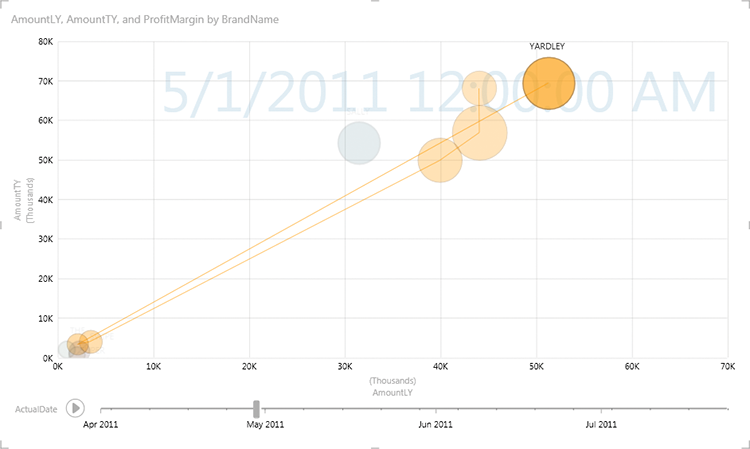
An example of Power View’s killer feature—the animated bubble chart—is shown in Figure A-4. (The animation doesn't show in the figure here, of course, but it really is animated!)
Figure A-4: An animated Bubble chart in Power View
HTML5
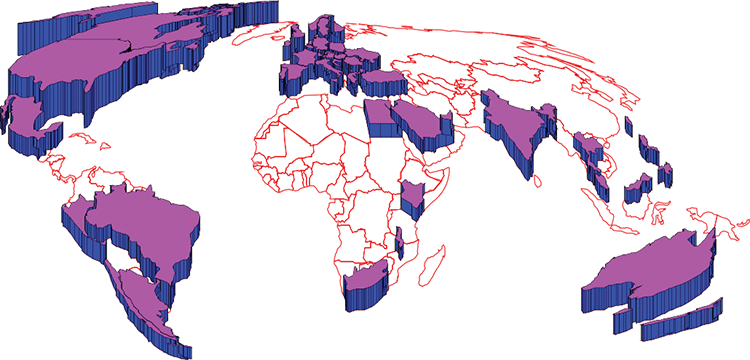
HTML5 (using such adjunct technologies as JavaScript and CSS, and libraries such as JQuery and D3) is a developer’s tool and not at all an end-user technology. HTML5 is used when developing visualizations that are simply not possible using any of the other tools. A prism map is a good example and is shown in Figure A-5. An interactive version of this is available at at http://www.pwinfographics.net.
Figure A-5: A prism map shown on a world outline
Matching a Visualization to a Tool
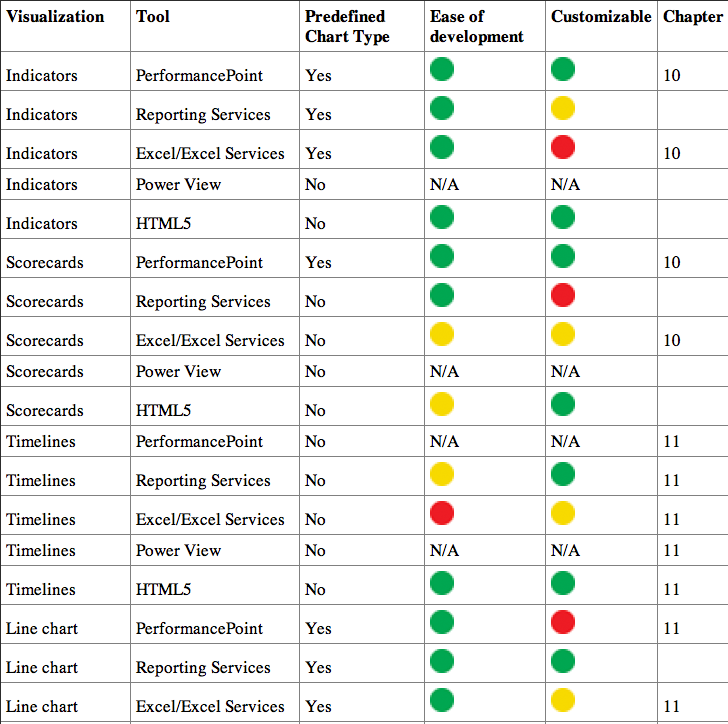
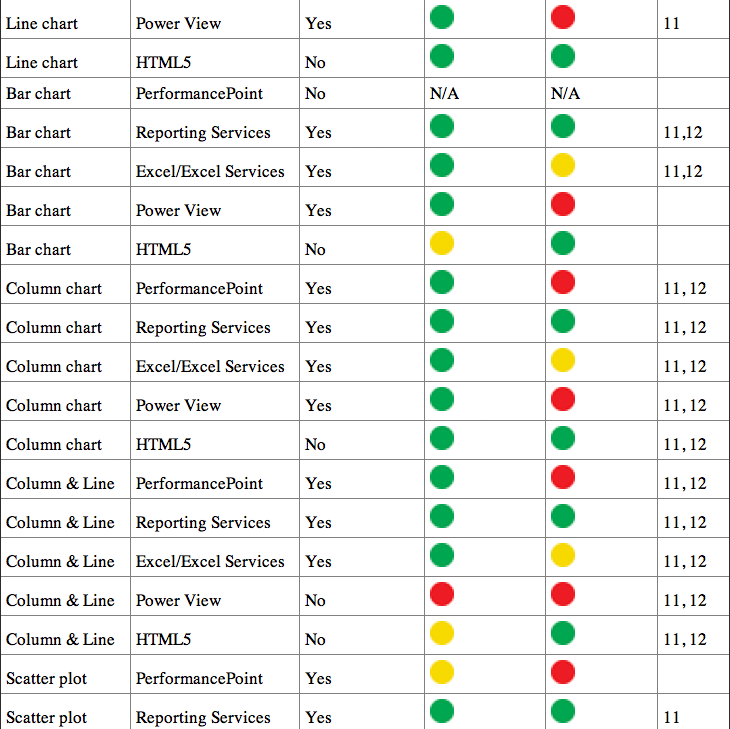
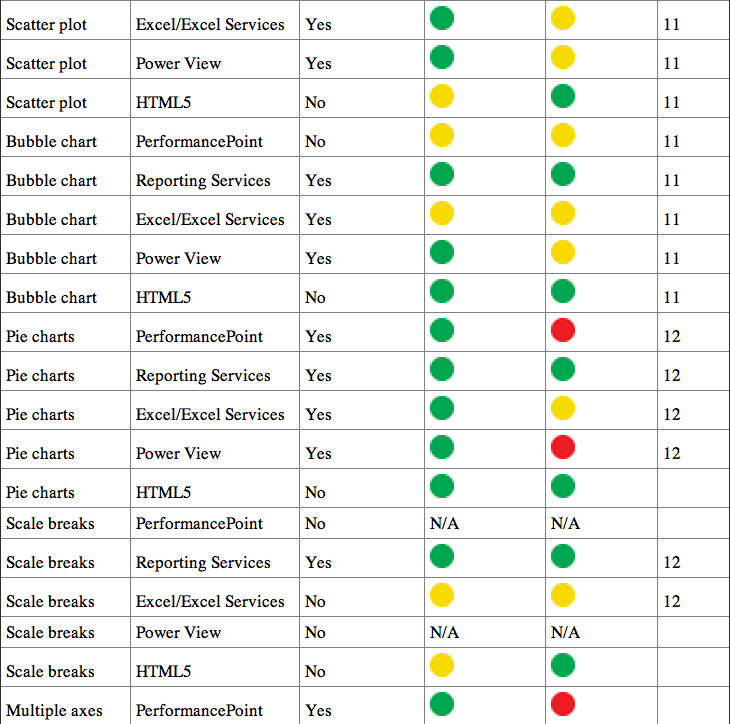
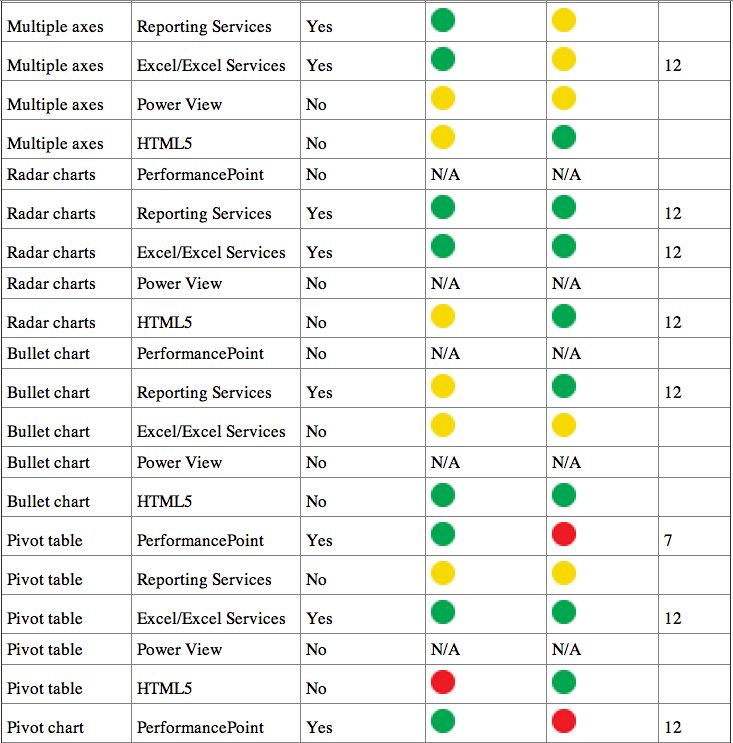
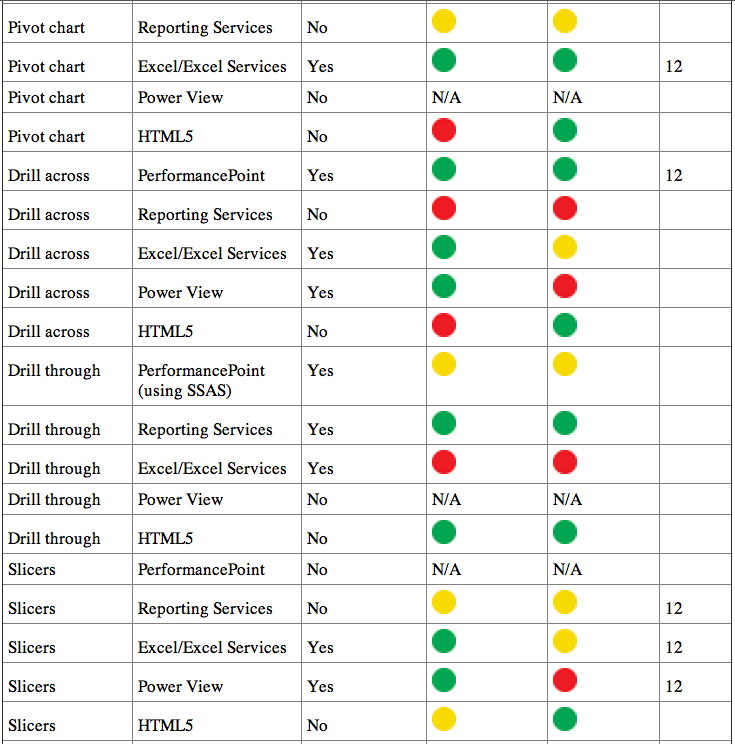
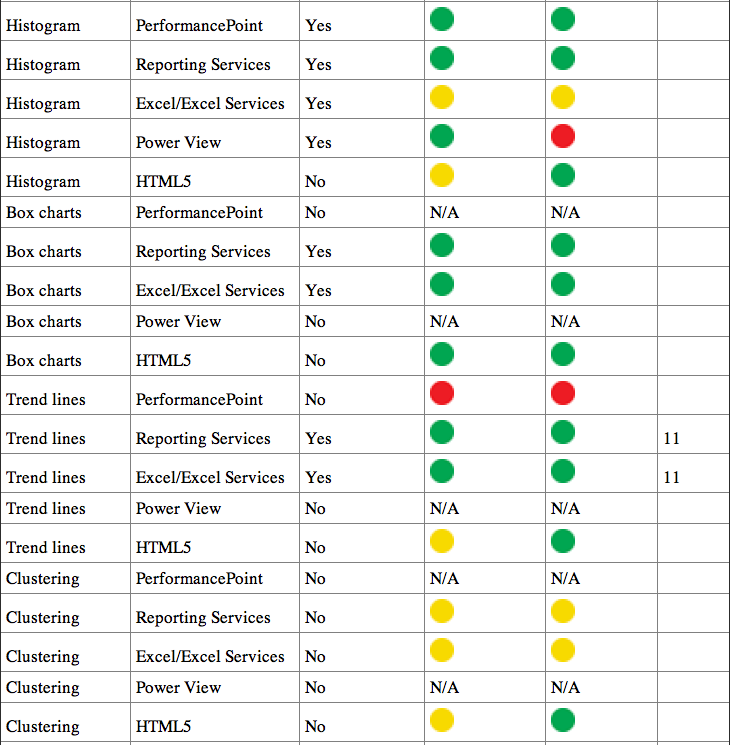
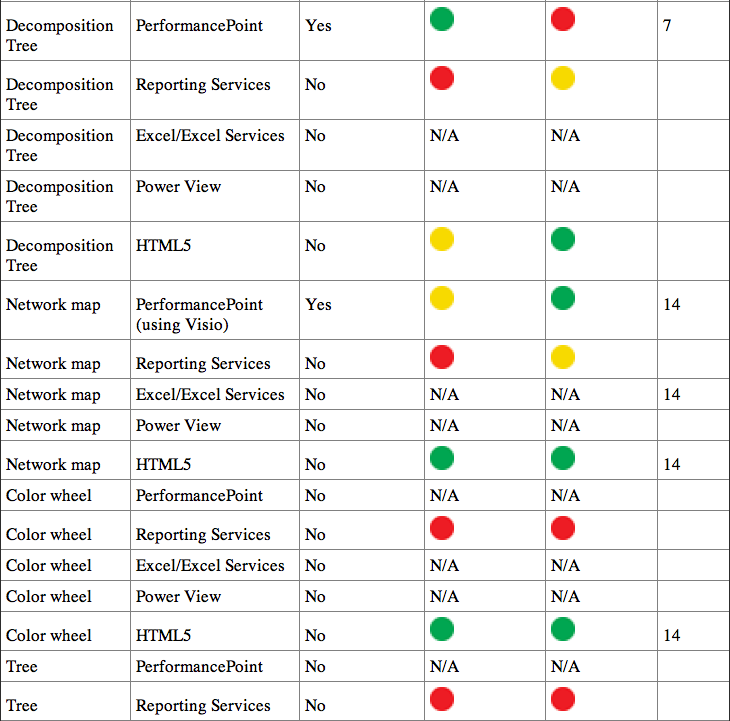
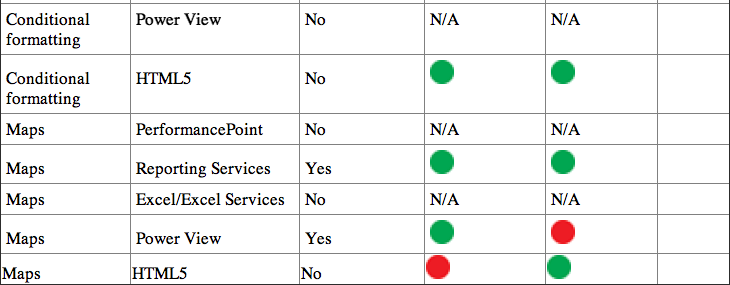
In Table A-1, you can see whether a tool has a visualization type built in, the ease of development (which can sometimes be achieved even when the visualization is not built in), how customizable the visualization is, and finally, where appropriate, the location in this book where you can find how to implement this visualization in that particular tool.
Table A-1: The ease of developing Visualizations in each tool