Chapter 8
Reporting Services
Reporting Services has an engine dedicated to the marrying of data to a predeveloped visual design, which makes it a very useful tool for displaying information. Reporting in general has seen a great deal of expansion in its capabilities, and in many instances it now has overlapping use cases with other tools. For example, in the past, other tools such as PerformancePoint would have been considered a much more appropriate choice for producing scorecards, but Reporting Services has expanded its capabilities and is able to generate scorecard-type content depicting very graphical summarized information.
Compared with all the other Microsoft business intelligence tools, Reporting Services offers the designer the most control over visual elements, formatting within the reports, and rendering options such as PDF or Excel output. Although this control is very useful, the trade-off is that every piece of layout and interactivity must be planned and implemented while you’re designing reports. Offsetting this effort are the greater visualization capabilities in Reporting Services, such as charts, gauges, indicators, trendlines, and mapping. This chapter is an introduction to developing visualizations using Reporting Services.
Native versus Integrated Mode
Reporting Services offers two supported modes of installation and operation: Reporting Services Native mode and SharePoint Integrated mode. No one operating mode is best suited to all the various reporting and use scenarios that the consumer may require. Therefore, it’s important to understand just what each mode can offer a reporting architecture.
Native Mode
Reporting Services has a Native mode that enables both users and administrators to access reports using a Report Manager web application. The Native mode provides a report server that is a standalone application providing report viewing, management, administration, processing, and delivery. The Native mode provides a complete self-service approach to report browsing and access, but it’s not without its limitations.
The original Report Manager web application was intended to be used as a sample application to aid in the design and development of custom web applications that would use the Reporting Services application programming interfaces (APIs) demonstrated within Report Manger. Many people feel that Report Manager provides a quick solution for handling basic reporting needs, but that it offers very little opportunity to customize the management and delivery of reporting.
When configured in Native mode, you can view reports on SharePoint websites using SharePoint web parts, but there are no management capabilities provided via these web parts and they cannot be connected to other SharePoint web parts.
SharePoint Integrated Mode
SharePoint Integrated Mode enables users and administrators to access the Reporting Service report server using the SharePoint server. This mode offers three levels of integration within SharePoint, including sharing storage, security, and site access of other business applications and data. SharePoint centrally stores all application and user content data in SQL Server databases while also providing a robust web application security system that is responsible for managing access to content and data hosted on SharePoint sites. Additionally, the SharePoint web application platform hosts business applications that permit user collaboration and centralized document management for reports and other types of content such as Word documents and Excel spreadsheets. As a result, one of the primary benefits of selecting SharePoint Integrated Mode is that it provides a unified portal presenting, managing, and securing business documents and information in one place. Because reports can be managed as just another form of content, applying the same security and administration model as other SharePoint content, this integration is very attractive to most IT departments as SharePoint administrators may assume reporting administration duties, thereby reducing administrative overhead.
Figure 8-1 illustrates the connectivity between Reporting Services, configured in SharePoint Integrated Mode, and the SharePoint farm via the Reporting Services Add-in.
Figure 8-1: SharePoint Integrated Mode using the Reporting Services Add-in

The SharePoint Integrated Mode of deploying Reporting Services includes some loss of the functionality found with Native mode. Notably, the following features are not supported with SharePoint Integrated Mode:
- Linked Reports
- Custom Security
- Report Scripting Host (rss.exe)
- Report Manager (website replaced by SharePoint sites)
Some of the key strategic advantages of the SharePoint Integrated Mode of deploying Services include the following:
- Reports and the libraries in which they are deployed use SharePoint centralized security (permissions and authentication providers).
- SharePoint libraries may be used for subscription delivery (using a SQL Server 2012 SharePoint delivery extension).
- Reports and the libraries in which they are deployed use SharePoint document administration, security, and collaboration (for example, alerts).
- Report Server File Sync permitting report files stored within SharePoint document libraries are synchronized with the report server when changes are made via the document library.
- SharePoint scale-out applies to Reporting Services applications.
- SharePoint Shared Service Application pool host the Reporting Services shared service.
- SharePoint cross-farm support may be used for viewing reports.
- SharePoint backup and recovery also covers reporting applications.
- SharePoint claims-based authentication may be used by Reporting Services applications.
Shared and Embedded Data Sources
Another point of consideration for report design using Reporting Services involves determining whether data sources will be shared among many other reports or embedded within a given report. Data sources are used within Reporting Services to provide a connection to external data; as such they contain connection strings and credentials for authorizing access to the data. You can also configure the connection itself to be a dynamic connection string that is provided through the use of an expression that enables a user to specify which source is to be used when the report is run.
The primary difference between a shared and an embedded data source is that the shared data source is stored and managed on the report server, whereas the embedded data source is stored and managed within the report. The net result of this difference is that embedded data sources are independent of one another and require separate maintenance. More specifically, they require modification of a report in order to apply changes. The shared data source is stored as a separate object on a report server, which allows this type of source to be used by many reports, models, and subscriptions. By centralizing the data source within one object, the maintenance and administration is also greatly simplified, permitting modifications without having to edit and redeploy many reports.
Authentication: A Better Solution
Managing access to reports and the data that reports display is a key to planning a successful Reporting Services architecture. To deliver well-targeted report content, often user credentials need to be sent to the data source in order to permit appropriate filtering of information. Reporting Services offers many different ways to address authentication and authorization of users as well as permitting passing user credentials to the data sources.
Authentication is used by Reporting Services to determine the identity of the entity (person, computer, service account) requesting access. With authentication the report server simply identifies who is accessing Reporting Services and does not determine if permissions are granted to the entity accessing the report server. The determination as to whether an entity has permission to access the report server is handled by authorization.
The Double Hop Problem
The network environment in which Reporting Services is deployed determines the supported types of connections used when supporting access to data sources. With Kerberos enabled, delegation and impersonation features available in Windows Authentication to support connections across multiple servers may be used to pass user credentials to remote data sources. Without having Kerberos enabled, Windows connections are only able to pass user credentials to one server prior to expiration. In this case, users are only able to connect and pass their user credentials from their computer to the report server. After this first connection, the user credentials are not subsequently permitted to be passed from the report server to a remote server containing the data source for the reporting.
To successfully pass user credentials from the user’s computer through the report server to the data source servers, Reporting Services has the following options:
- Set reports to use stored or prompted credentials when querying data sources
- Configure Kerberos authentication protocol and enable impersonation and delegation in order to permit credentials to be delegated to other computers without limits
Configuration of Kerberos authentication is outside of the scope of this book. The next section discusses the option to use stored or prompted credentials allowing the end user’s credentials to be passed without having Kerberos configured.
Set Execution Context: Requirements and Setup
To permit the end user’s credentials to be successfully passed to the data source without configuring Kerberos, the data source must be set to use stored credentials and use both the Use as Windows Credentials When Connecting to the Data Source and Impersonate the Authenticated User After a Connection Has Been Made to the Data Source options. Figures 8-2 and 8-3 show the specific configuration of the data source during report design and server configuration.
Figure 8-2: Reporting Services Data Source configuration on the Report Server without Kerberos

Figure 8-3: Reporting Services Data Source configuration during data source design without Kerberos
For Analysis Services data sources, setting these options causes Reporting Services to add the EffectiveUserName property into the connection string and populate it with the user that is running the report. The key requirement for using the EffectiveUserName property with an Analysis Services connection is that the stored credential account must be an Analysis Services administrator.
In some cases when SharePoint uses a distributed architecture separating the front-end web server from an application server hosting Reporting Services, additional configuration of the Analysis Services server to support this capability including creating an SPN (Service Principal Name) for the Analysis Services service account as well as enabling the account’s delegation setting within Active Directory may be required.
For SQL Server data sources, setting these options sets the SETUSER function to be used to impersonate the user to run the data source query. The key requirement for using SETUSER to impersonate another user within SQL Server with a SQL Server connection is that the stored credential account must be a member of the SQL Server sysadmin fixed server role or be a db_owner fixed database role. Additionally, when using SQL Server authentication and the username and password are database credentials, do not select Use as Windows credentials when connecting to the data source.
Expressions in Reporting Services
Reporting Services supports the use of expressions (Visual Basic code) to control aspects of report content, design, and interactivity. These expressions include constants, operators, and references to report values (fields, functions, and collections) or external (custom) code.
You can achieve advanced report designs primarily by successfully using expressions to control the report content and appearance of report objects. You may also use expressions to create formulas that evaluate data values in order to determine what type or format of indicator should be displayed. This use of report expressions is very useful when creating key performance indicators (KPIs) within a Reporting Services report. Displaying the current status of a KPI value an expression can determine if a value was in a desired range and, if so, to render a stoplight graphic with a green light illuminated.
Another common reporting design involves highlighting information by conditionally appending graphics beside the data values. The following example expression, implemented in a column of a report, returns the name of an indicator graphic to display when the current account balance is less than 75 percent of the prior period’s balance:
=IIF(Sum(Fields!AccountBalance.Value) /
       Sum(Fields!AccountBalanceLastPeriod.Value) <
       .75, "indicator_small", "nothing")
Similarly, you can use report expressions to alter the color or other text box appearance attributes in order to draw attention to the values under given conditions. The following example expression changes the color of the AccountBalance field when the value is a negative amount:
=IIF(Fields!AccountBalance.Value < 0, "Red","Black")Ultimately, Reporting Services expressions enable many dynamic and interactive report design features that can aid in effectively communicating the data stories found within the data.
Business Intelligence Development Studio and Visual Studio versus Report Builder
Understanding what tools are available to design and publish reports is an essential part of working with Reporting Services. In this section two primary tools are contrasted, Report Builder and Business Intelligence Development Studio (BIDS).
BIDS has been the defacto report design and publishing tool of Reporting Services since the product’s inception. The base of Business Intelligence Development Studio (BIDS) is a core subset of Microsoft’s Visual Studio development environment which is successfully used to develop other forms of software and as a result has significant investments in usability and key development tools such as source code control.
Report Builder has been, at best, a confusing product that was originally introduced as a tool to provide end users with a report design experience. The confusion surrounding this product centers on the abandonment of the original Report Builder (version 1.0) in favor of a completely different tool in the SQL Server 2008 release. Ultimately, Report Builder in the current version is a solid tool for report design, and, in many cases, it offers additional value-added features not found within BIDS.
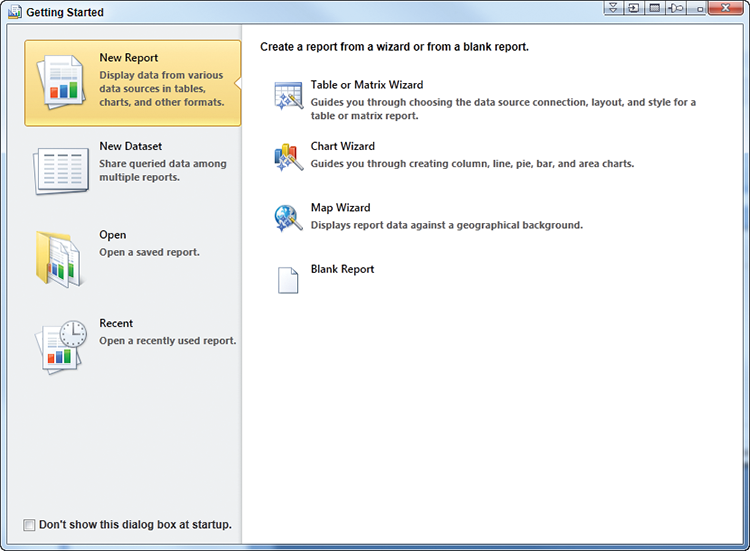
Report Builder offers a more guided path for developing certain reporting features through the use of wizards. For example, when starting a new report in Report Builder, a sophisticated getting started wizard, shown in Figure 8-4, immediately assists in getting the report design started.
Figure 8-4: Report Builder Getting Started Wizard
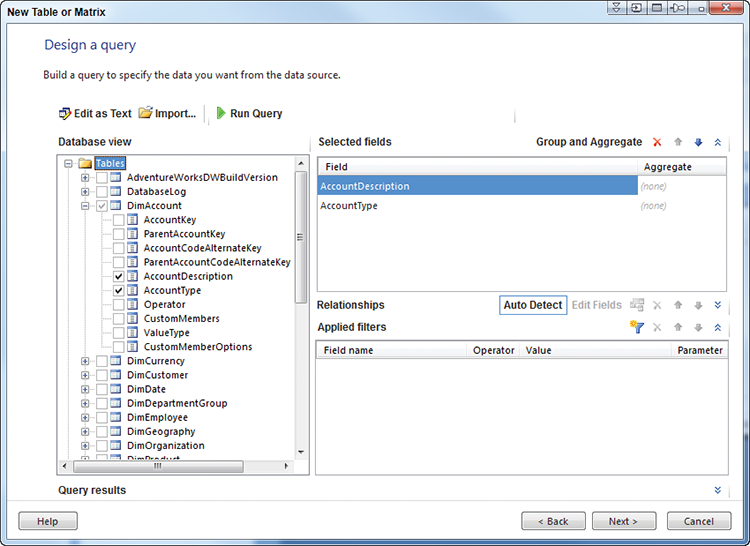
One of the key differences is that Report Builder creates report datasets through the use of a query designer (wizard), as shown in Figure 8-5, that is reminiscent of those in Microsoft Access, thus affording the report designer a much more managed path to complete this common report design activity.
Of the more frustrating differences, Report Builder does not offer intelligence built into the expression editor. As a result Report Builder does not offer assistance in completing the expressions by showing prompts indicating the parts of the expression required for completion.
Figure 8-5: Report Builder Design a Query
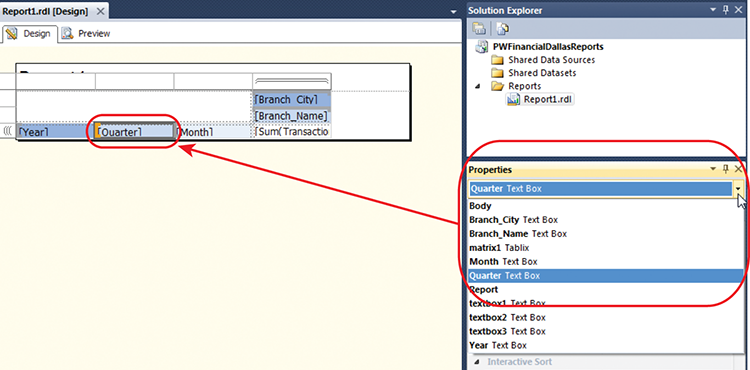
Another common report designer productivity feature missing from Report Builder is the ability to quickly switch report items by changing the properties windows drop-down. While Report Builder does have a properties window that can be activated in the Ribbon, items can only be selected by clicking on them. Figure 8-6 shows the properties windows drop-down expanded to permit navigation to other report objects.
Some of the key innovations found within Report Builder do not exist within BIDS. Most significantly absent is the ability to jump start a report design by using Report Parts. Report Parts encapsulate report objects such as the connection, datasets, and visual elements (for example, a chart or matrix) for use in many reports and may only be used via Report Builder.
Working with subreport parameters is a bit more difficult using BIDS because it does not have a drop-down list prepopulated with the parameters found within the subreport, which is a feature offered within Report Builder.
Figure 8-6: BIDS report properties navigation
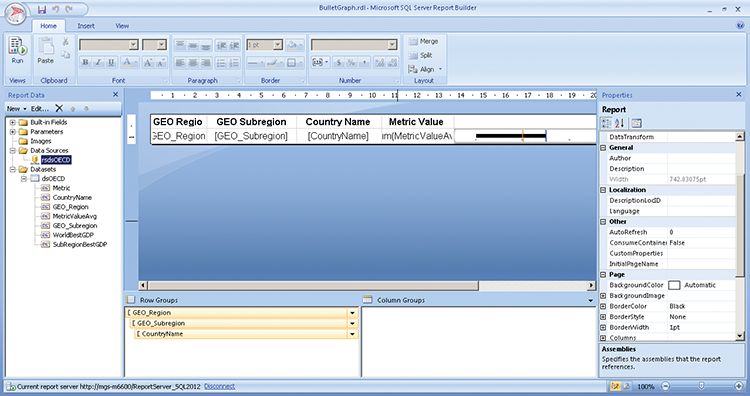
Report building is shown in Figure 8-7.
Figure 8-7: Report Builder
Installing the Reporting Services Samples
Figure 8-8: Changing a data source

The chapters that include Reporting Services samples include files with an .RDL extension in the ZIP. Despite the guidance given in this chapter for the general best practice of using shared data sources, these .RDL files will all contain an embedded data source, which you will need to edit to point to your restored databases.
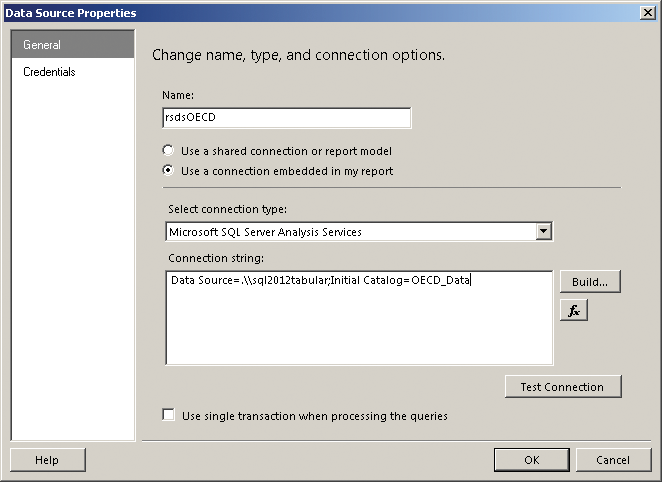
To do that, open Report Builder 3 (available for download at www.microsoft.com/en-us/download/details.aspx?id=6116), and then select File > Open, browse to the .RDL file you extracted. Next, right click on the data source and click Data Source Properties as shown in Figure 8-8.
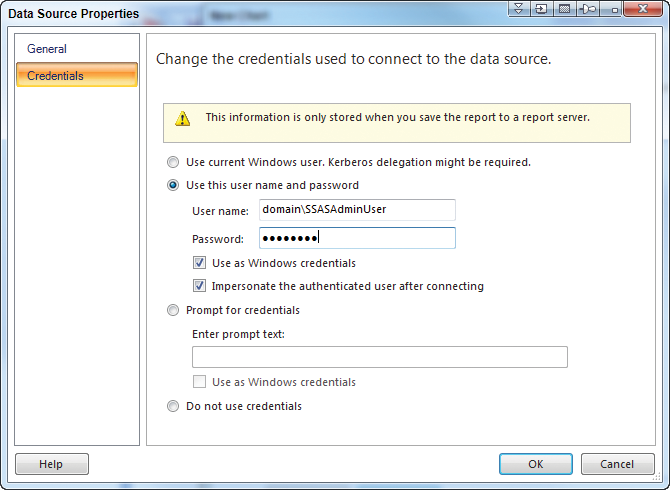
Finish by changing the server name to the machine you are working on—often, if you have a default instance, you can simply use “.” to access your local server. The data source screen is shown in Figure 8-9.
Figure 8-9: Changing a data source
Summary
This chapter introduced Reporting Services and its key features. First, a brief overview of both native and integrated modes for configuring Reporting Services was provided. Next, shared and embedded data sources were reviewed. Special attention was given to accessing reports including providing a method often does not require the complex configuration of Kerberos. A discussion of the value of report expressions followed. Lastly, this chapter contrasted the two report design tools, Report Builder and Business Intelligence Developer Studio.