
Chapter 9
Custom Code
Most of the visualizations used in this book are based upon the standard Microsoft toolset, but for some types of visualization, those tools just don’t have enough capabilities. Missing visualizations include column charts that are both clustered and stacked (allowing for another dimension of data), color wheels, as covered in Chapter 14, heatmaps (although you can build them in Excel by using cells), network graphs of various types, and tree graphs (although the Decomposition Tree is available in PerformancePoint).
When a tool doesn’t have the visualization you need, it’s time to write your own in a language such as C#. There are various ways of using code to create a visualization, and this chapter explains the different methods.
Silverlight, WPF, XAML, and HTML5
Prior to the release of Windows 8, and indeed prior to the broad success of the non-Microsoft computer in the form of the iPad and the Android tablet, the toolset choice for visually rich applications was simple: Windows Presentation Foundation (WPF) on the desktop and Silverlight (a web-based subset of WPF) for the web. The tool of choice for developing these applications was Expression Blend, and the world was a happy place for developers. The key for development was creating markup for the design of the application using a language called XAML (eXtensible Application Markup Language), separating the design from the functional code.
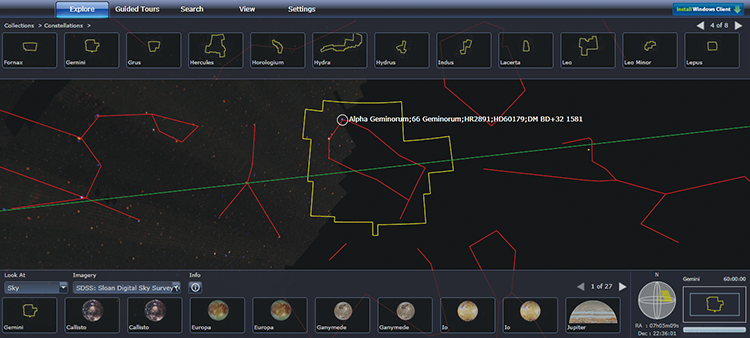
Figure 9-1: A Silverlight astronomy visual tool
The broad success of the iPhone and the iPad changed everything. Suddenly, cross-platform support became a much bigger issue than it had been, and the myriad of business intelligence (BI) apps released for the iPad became competition for the Microsoft tools, although some worked with the Microsoft platform as a whole (RoamBI is one example; you can find it at www.roambi.com/). The challenges of developing for the Apple iTunes store are mostly political in nature, as evidenced by the dispute between Amazon.com and Apple around the Kindle app. Amazon.com had to remove a link to its online store in the app, and users had to buy content through Apple—with 30 percent of the purchase price going to Apple.
Amazon.com’s response was to build an HTML5 application that didn’t go through the Apple store. This approach is simpler when you consider the wider (and growing) world of non-iOS tablets—Android as well as WinRT.
In the visualization world, HTML5 is thus the best approach to creating a visualization. Visualizations that you create using HTML5 can easily work on multiple platforms. In addition, as you create a visualization, it’s essential that you consider the tablet form factor and the user’s ability to consume and interact with a visualization on the go, such as in a board meeting. One of the limitations is that tablets are not useful for authoring content, and advanced BI customizations, including self-service BI, simply don’t work as well on a tablet.
What is so special about HTML5 over HTML 4 that makes it so much better for visualization? Aside from anything else that it provides, the canvas element is the key: The canvas element allows for the direct manipulation of graphical elements such as arcs and lines. However, just using the canvas, you would still need to write an extensive amount of code to generate stunning visualizations, so you will want to use some of the existing libraries. There are several libraries that are worth looking at:
- Flotr2: http://www.humblesoftware.com/flotr2/index
- Raphael: http://raphaeljs.com/ (technically SVG rather than HTML5)
- D3 (used to be Protovis): http://d3js.org/ and http://nvd3.org/
- JavaScript InfoVis Toolkit: http://philogb.github.com/jit/
You can find more examples at http://socialcompare.com/en/comparison/javascript-graphs-and-charts-libraries.
These libraries each have different capabilities and intents. Flotr2 is a generic HTML5 charting library; Raphael and D3 are aimed at aiding graphical manipulation on a webpage; and InfoVis provides a diverse set of visualizations. As the goal is to create visualizations that are not present in the Microsoft toolkit, rather than design interactive websites, this book uses InfoVis for most custom visualizations. A selection of the visualizations available is shown in Figure 9-2.
The other great aspect of using HTML5/JavaScript is that Excel 2013 can natively embed this code to run in the client. You can read more on doing this at http://msdn.microsoft.com/en-us/library/office/apps/jj220038.
Figure 9-2: A selection of charts from the InfoVis library

The Future of Silverlight
Silverlight itself is a dying product. The latest release—Silverlight 5—will most likely be the last release. However, the fundamental development paradigm of both Silverlight and WPF is declarative development using XAML, and this approach is deeply embedded into Windows 8.
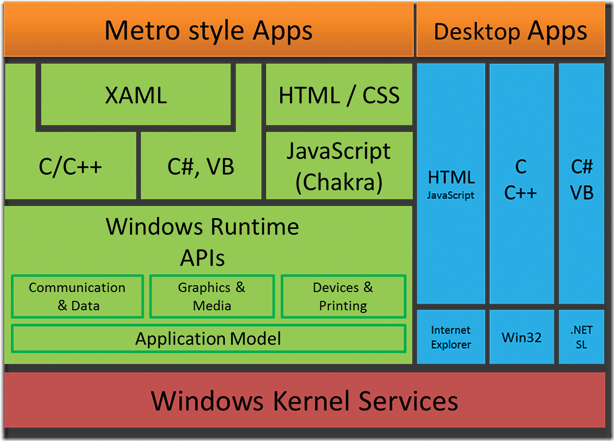
The concept is that a combination of XAML and a language of your choice (C#, Visual Basic, C++, and even JavaScript) are used to develop Windows Store applications (these were originally called Metro apps, but this name was changed) that are aimed at being touch-enabled and using a different user interface (UI) experience. A key feature of Windows Store application is the tile UI, in which applications update their “live tiles.” The technology stack is shown in Figure 9-3.
Figure 9-3: The Windows 8 development stack (note that Metro style has been replaced with Windows Store)
Accessing Data from HTML5
You can access data from HTML/JavaScript in many ways. The simplest, of course, is to have server-side code generate the page with the data embedded. This requires a page refresh for any data changes, but it can often be a good method.
Alternative methods involve having a web service called from JavaScript, which returns the data required. The earliest approaches used a technique called AJAX, for Asynchronous JavaScript and XML. More recently, this has been mostly replaced by using JSON (JavaScript Object Notation) instead of XML to reduce the amount of data flowing from the server to the browser. Libraries such as jQuery make this approach easy, with an object call: jQuery.getJSON.
A code sample of using jQuery (from the jQuery API page at http://api.jquery.com/jQuery.getJSON/) is included here:
<html>
<head>
<style>img{ height: 100px; float: left; }</style>
<script src="http://code.jquery.com/jquery-latest.js"></script>
</head>
<body>
<div id="images">

</div>
<script>
$.getJSON("http://api.flickr.com/services/feeds/
  photos_public.gne?jsoncallback=?",
{
tags: "mount rainier",
tagmode: "any",
format: "json"
},
function(data) {
$.each(data.items, function(i,item){
$("<img/>").attr("src", item.media.m).appendTo("#images");
if ( i == 3 ) return false;
});
});</script>

</body>
</html>
The getJSON function takes three parameters: The first parameter is the URL to be accessed, the second parameter is the list of parameters to be passed to the URL, and the third parameter is the function that will process the data when it is received.
Installing the HTML5 samples
Running most of the HTML5 samples is as easy as double-clicking the .HTML file and accepting the security warning. However, when working with web service calls, for security reasons the JavaScript calling the web service and the web service itself should be on the same website.
All the samples are available in the download files for this book at www.wiley.com/go/visualintelligence.
Start by opening IIS from Administrative tools > IIS Manager in the Windows menu.
You should see a screen like Figure 9-4 on opening IIS Manager.
Figure 9-4: IIS Manager
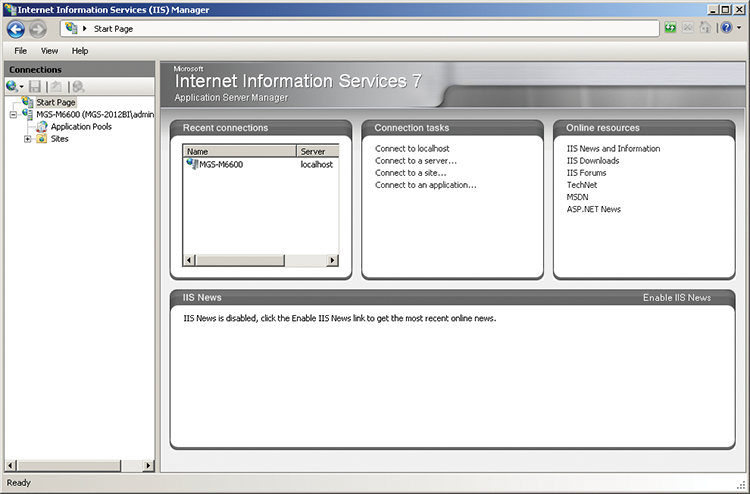
Figure 9-5: A new app pool in IIS
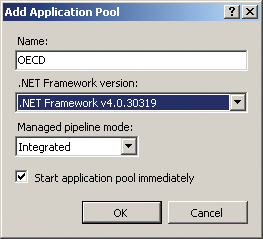
Expand the web server, right-click Application Pools, and add a new application pool. Make sure to set it to .NET 4 as shown in Figure 9-5. Click OK.
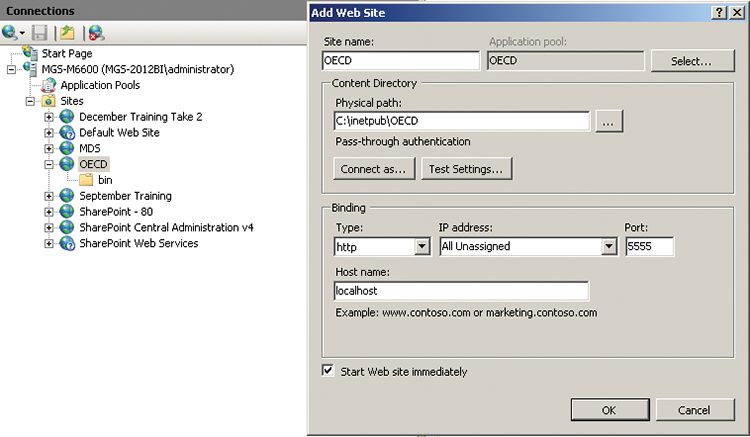
Right-click Sites and choose Add Web Site. Set up the site as shown in Figure 9-6. Make sure to select the application pool you just created. You will need to click on the ellipsis next to the Physical Path to create your new folder. Also set your port to 5555. The Host name of “localhost” means that this website will be hosted on the local machine.
Figure 9-6: A new IIS site
Now, browse to the C:inetpubOECD folder that you created in the previous screen and copy the samples in treemap.zip to this folder. Make sure to remove the files from the zip into the root of this folder. At this point, you can open the samples by going to http://localhost:5555/treemap.html. Depending on your security settings, you may need to click Allow blocked content to see it.
A Web Service Sample in C#
As you learned earlier, visualizations are nothing without the data to feed them, and JSON is the format of data typically used in HTML5 applications. JSON stands for JavaScript Object Notation. In order to create JSON with data in it, you will need to write server-side code that creates it, and that is where C# comes in.
This web service has one objective: retrieve data from SQL Server, Analysis Services or any other data source, and publish it as JSON that the JavaScript can consume. .NET 4 provides a convenient JSON serialization method that converts a C# class to JSON. Of course, to do that, you need a C# class, and there is a wonderful utility at http://json2csharp.com/ that enables you to paste in JSON to generate a C# class. More details on how you will accomplish this after you have created the solution.
In this section you will be creating a new C# web service, enabling it for use by JavaScript, using the converter to create a C# class that generates JSON, and adding code to put data in that new class.
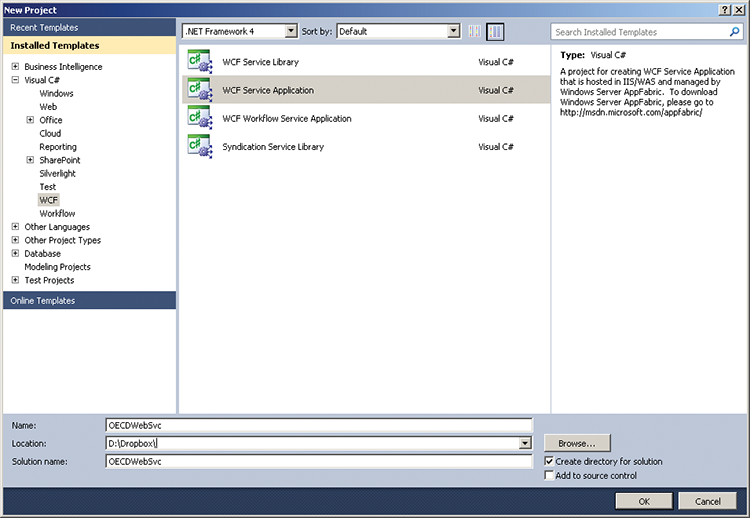
Open up Visual Studio and create a new project. Go to File and select New project>Visual C#, then WCF in the left-hand panel, and WCF Service Application on the main screen.
You can see the new project screen in Figure 9-7.
Figure 9-7: New Project screen
Rename your project from the default to OECDWebSvc, then click OK.
In Solution Explorer, Right-click the IService1.cs file and delete it; then right-click Service1.svc and rename it to OECD.svc.
You can see what the project should look like in Figure 9-8.
Figure 9-8: Solution overview

Replace the content of OECD.svc with the following code:
using System;
using System.Collections.Generic;
using System.Linq;
using System.Runtime.Serialization;
using System.ServiceModel;
using System.ServiceModel.Web;
using System.Text;
using System.ServiceModel.Activation;

namespace OECDWebSvc
{

    [ServiceContract(Namespace = "OECDSvc")]
    [AspNetCompatibilityRequirements(RequirementsMode =
  AspNetCompatibilityRequirementsMode.Allowed)]
    public class OECD
    {
        [DataContract(Namespace = "OECDSvc")]
        public class Response
        {
            [DataMember]
            public string tmString { get; set; }

        }
        [OperationContract]
        [WebInvoke(BodyStyle = WebMessageBodyStyle.Wrapped,
  RequestFormat = WebMessageFormat.Json, ResponseFormat =
  WebMessageFormat.Json)]
        public Response POSTTreemapByRegions(String sRegions)
        {
            return (new Response() { tmString = "basic Response" });
        }
    }
}
The class attributes ServiceContract on line 13 and AspNetCompatibilityRequirements on line 14 define what this class can do. The DataContract attribute on the response class on line 17 defines what this web service is going to return—in this case, just a string. The reason you have to return a string and not a pure JSON object is the naming convention of $area and $color, which you have to fix. C# does not support $ or a space in a name in class, whereas the InfoVis library requires them. You’ll get to that a little later in this section. Finally, the method attributes OperationContract on line 24 and WebInvoke on line 25 tell the web service that this is a POST service—this is the method that the web page will use to communicate to the web service, as opposed to the other type of service, the GET service.
Next, open the web.config file—it is located in your solution explorer in Visual Studio directly underneath the OECD.svc file you have been working on. Replace the contents with the following:
<?xml version="1.0"?>
<configuration>

  <system.web>
    <compilation debug="true" targetFramework="4.0" />
  </system.web>
  <system.serviceModel>
    <behaviors>
      <endpointBehaviors>
        <behavior name="OECDSvc.OECD">
          <webHttp />
          <enableWebScript  />
        </behavior>
      </endpointBehaviors>
      <serviceBehaviors>
        <behavior>
          <!-- To avoid disclosing metadata information, set the
           value below to false and remove the metadata endpoint
           above before deployment -->
          <serviceMetadata httpGetEnabled="true"/>
          <!-- To receive exception details in faults for debugging
           purposes, set the value below to true.  Set to false
           before deployment to avoid disclosing exception
           information -->
          <serviceDebug includeExceptionDetailInFaults="true"/>
        </behavior>
      </serviceBehaviors>
    </behaviors>
    <serviceHostingEnvironment multipleSiteBindingsEnabled="true" />

    <services>
      <service name="OECDSvc">
        <endpoint address="http://localhost:5555/OECD,svc"
         behaviorConfiguration="OECDSvc.OECD"
         binding="webHttpBinding" contract="OECDSvc.OECD" />
      </service>
    </services>
  </system.serviceModel>
  <system.webServer>
    <modules runAllManagedModulesForAllRequests="true"/>
  </system.webServer>
</configuration>
The default example has used port 5555. Note that you need to replace http://localhost:5555/ with the website you’re using on your machine if you changed this—this is located in the endpoint tag eight lines from the end. Go ahead and create a new empty website in Internet Information Services (IIS) now if you don’t have one (this was covered in “Installing the HTML5 Samples” earlier in the chapter, and if you followed that section you should have a website setup—you should use that one.)
The final piece of the basic website setup is changing the service markup. Go to OECD.svc, right-click, choose View Markup, and then replace the content with the following code:
<%@ ServiceHost Language="C#" Debug="true" Service="OECDWebSvc.OECD"
 CodeBehind="OECD.svc.cs" Factory="System.ServiceModel.
 Activation.WebServiceHostFactory"%>
This can be seen in Figure 9-9.
Next, you need to return some data. In this example, the data is hardcoded. In the download samples for the chapter (available at www.wiley.com/go/visualintelligence), it is pulled from a database. This data needs to be returned in JSON, based on the format that InfoVis requires.
Figure 9-9: The new markup for OECD.svc

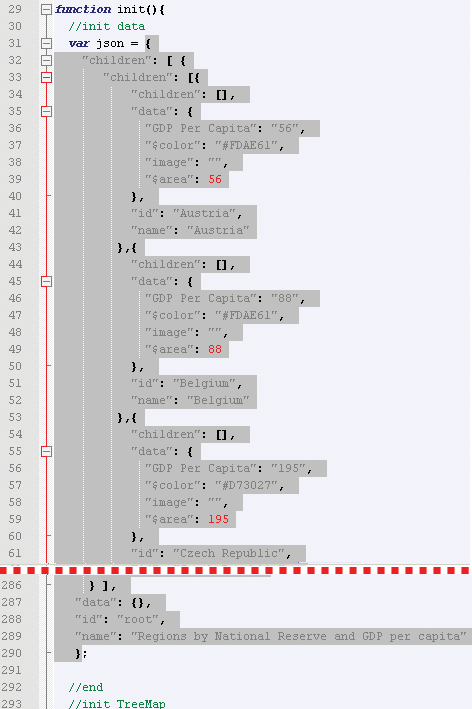
So take the JSON from Treemap.js (Treemap.js is part of the code downloads for this chapter, available at www.wiley.com/go/visualintelligence), where it says var json = {xxxxx}; and take everything including the two braces but excluding the equal sign and semi-colon, and paste it into the converter. You can see what to copy in Figure 9-10. Make sure to copy all the JSON before the line that has ends with //, but excluding the semi-colon. Note that Figure 9-10 has been edited, and you need all the content from the brace on line 31 to the brace on line 290.
Create a new class called Treemap.cs by right-clicking on your solution file and clicking Add > Class, as in Figure 9-11.
Figure 9-10: The JSON that is the data for the visualization
Paste the code that you got for the JSON class over the class (make sure to leave the lines starting with USING at the top, as well as the line starting with namespace, and the final brace that closes the namespace. The class contents are contained within the braces following the name of the class). You will need to make some amendments to make this code work correctly however.
Replace __invalid_name__$ with DOLLAR (you do a reverse replace later).
Spaces are also illegal, so do a replace for __invalid_name__GDP Per Capita with GDP_Per_Capita.
You can see the class in Figure 9-12.
Figure 9-11: Adding a class
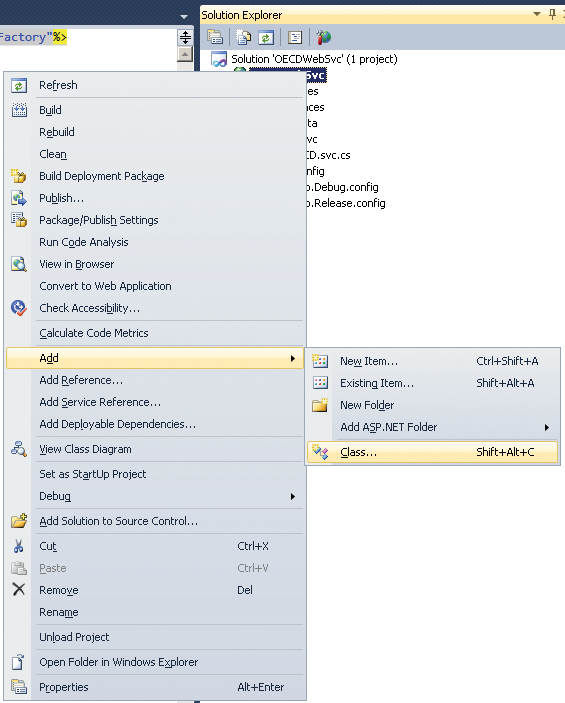
Figure 9-12: C# code
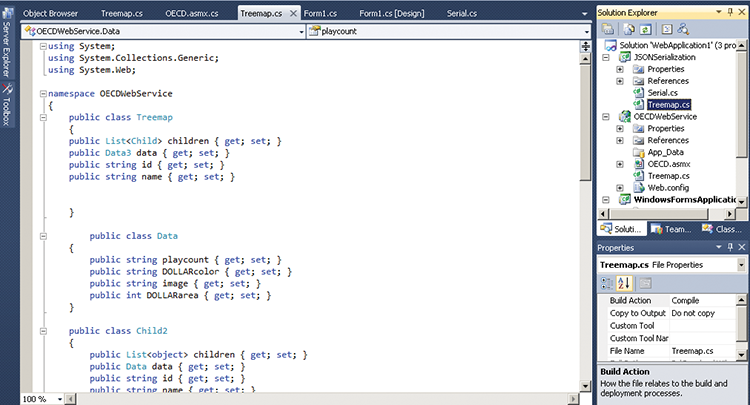
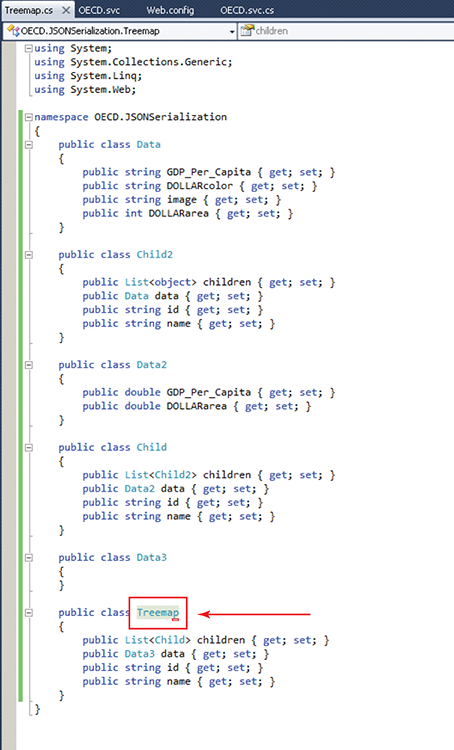
You now need to finish changing the class to work with the rest of your code. Change the namespace to OECD.JSONSerialization. Change the class name that says “RootObject” to Treemap. It should appear as in Figure 9-13 below. You can test if the code is correct by building the project—pressing Ctrl-Shift-B will do so.
Figure 9-13: Treemap class
Next, create a new class—Serial.cs—in the same manner you created the new Treemap.cs and paste the following code (overwrite everything on the page in this instance, as all the requirements are included in the following code.)
using System;
using System.Collections.Generic;
using System.Linq;
using System.Text;
using System.Web.Script.Serialization;

namespace OECD.JSONSerialization
{
    public class Serial
    {
        public Treemap tmJSON;
        public Serial()
        {
            tmJSON = new Treemap();
            tmJSON.id = "root";
            tmJSON.name = "root";
            Child allChild = new Child();

            allChild.id = "region_Europe";
            allChild.name = "Europe";
            allChild.data = new Data2();

            allChild.children = new List<Child2>();

            Child2 grandChild = new Child2();
            grandChild.children = new List<object>();
            grandChild.id = "country-France";
            grandChild.name = "France";
            grandChild.data = new Data();
            grandChild.data.DOLLARarea = 35133;
            grandChild.data.GDP_Per_Capita = "35133";
            grandChild.data.DOLLARcolor = "#E66101";
            grandChild.data.image = "";


            Child2 grandChild2 = new Child2();
            grandChild2.children = new List<object>();
            grandChild2.id = "country-Greece";
            grandChild2.name = "Greece";
            grandChild2.data = new Data();
            grandChild2.data.DOLLARarea = 26934;
            grandChild2.data.GDP_Per_Capita = "26934";
            grandChild2.data.DOLLARcolor = "#FDB863";
            grandChild2.data.image = "";

            Child2 grandChild3 = new Child2();
            grandChild3.children = new List<object>();
            grandChild3.id = "country-Germany";
            grandChild3.name = "Germany";
            grandChild3.data = new Data();
            grandChild3.data.DOLLARarea = 39518;
            grandChild3.data.GDP_Per_Capita = "39518";
            grandChild3.data.DOLLARcolor = "#B2ABD2";
            grandChild3.data.image = "";


            allChild.children.Add(grandChild);
            allChild.children.Add(grandChild2);
            allChild.children.Add(grandChild3);
            tmJSON.children = new List<Child>();
            tmJSON.children.Add(allChild);
            tmJSON.data = new Data3();
        }
        public string serialize()
        {
            JavaScriptSerializer js = new JavaScriptSerializer();
            return js.Serialize(tmJSON);
        }
    }
}
This code hard codes the values for the treemap—in the samples for this chapter, a data-driven layer that returns the same data is provided. Finally, go back to OECD.svc (you created this at the beginning of the example; just double-click to open it). Add the following using statement at the top:
using OECD.JSONSerialization;then replace:
return (new Response() { tmString = "basic Response" });with:
            Serial s = new Serial();
            string sTM = s.serialize().Replace("DOLLAR", "$");
            return (new Response() { tmString = sTM });
This will call the class you just created to retrieve the data, and replace the placeholders with the $ symbols. Press Ctrl-Shift-B to rebuild.
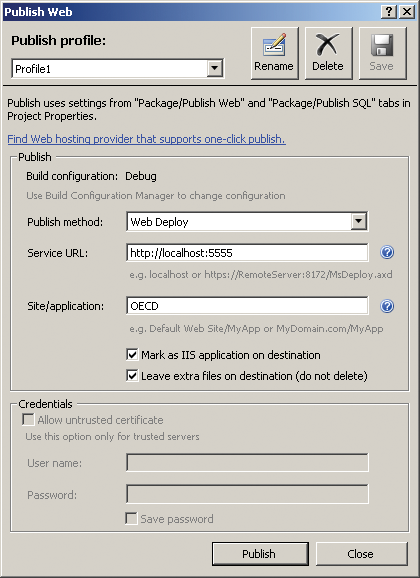
Finally, right-click the project OECDWebSvc and choose Publish. You see the screen shown in Figure 9-14. You may need to create a new profile if Profile 1 does not appear in your drop-down—do this simply by entering a name in the text box, and then entering the settings
Set the URL to the website you created earlier, set the Site/Application to OECD, tick the Mark as IIS application on destination check box and click the publish button.
Figure 9-14: Publishing your web service
All of the changes thus far have been done in Visual Studio as part of the web service. The next set of changes will be done in Notepad++ once more.
Next, you need to make the JavaScript changes. Open Treemap.js in Notepad++. You need to change the init function to look like the following:
function init(){
 var json;
  $.ajax
  (
   {
    type: 'POST',
    url: 'http://localhost:5555/Service1.svc/POSTTreemapByRegions',
    dataType: 'json',
    contentType: 'application/json; charset=utf-8',
    data: '{ "sRegions": "All" }',
    success: function (response, type, xhr)
    {
     json = response.POSTTreemapByRegionsResult.tmString;
     CreateVisual(json);
    },
    error: function (xhr)
    {
     window.alert('error: ' + xhr.statusText);
    }
   }
 );
}
Note that this replaces the same code that you copied for conversion, but this time it is all the content from line 29 to the end of the file
This is an asynchronous call to the C# web service (which is specified in the line beginning with URL), and replaces the hardcoded data that was in this file originally. As an asynchronous call, you have to have another function that creates the visualization to allow it to only execute after data is returned. This function is called CreateVisual and is specified in the success result of the AJAX call.
Then, place the code below code directly below the code you have pasted above.
function CreateVisual(jsontext) {
  var json = eval('(' + jsontext + ')'),
  var tm = new $jit.TM.Squarified({
    //where to inject the visualization
    injectInto: 'infovis',
    //parent box title heights
    titleHeight: 15,
    //enable animations
    animate: animate,
    //box offsets
    offset: 1,
    //Attach left and right click events
    Events: {
      enable: true,
      onClick: function(node) {
        if(node) tm.enter(node);
      },
      onRightClick: function() {
        tm.out();
      }
    },
    duration: 1000,
    //Enable tips
    Tips: {
      enable: true,
      //add positioning offsets
      offsetX: 20,
      offsetY: 20,
      //implement the onShow method to
      //add content to the tooltip when a node
      //is hovered
      onShow: function(tip, node, isLeaf, domElement) {
        var html = "<div class="tip-title">" + node.name
          + "</div><div class="tip-text">";
        var data = node.data;
        if(data.GDP_Per_Capita) {
          html += " GDP_Per_Capita: " + data. GDP_Per_Capita;
        }
        if(data.image) {
          html += "<img src=""+ data.image +"" class="album" />";
        }
        tip.innerHTML =  html;
      }
    },
    //Add the name of the node in the correponding label
    //This method is called once, on label creation.
    onCreateLabel: function(domElement, node){
        domElement.innerHTML = node.name;
        var style = domElement.style;
        style.display = '';
        style.border = '1px solid transparent';
        domElement.onmouseover = function() {
          style.border = '1px solid #9FD4FF';
        };
        domElement.onmouseout = function() {
          style.border = '1px solid transparent';
        };
    }
  });
  tm.loadJSON(json);
  tm.refresh();
}
That’s really it. The rest of the sample’s layout stays the same. Now open your browser and go to http://localhost:5555/treemap.html.
Summary
In this chapter you learned the basics of using C# and HTML5/Javascript to create your own visualizations. These make using libraries such as InfoVis and others for the front end and writing your own web service to supply data to extend the visualization capabilities available from Microsoft much easier.