CHAPTER 32
Logging and Debugging
IN THIS CHAPTER
![]() Using the Task Manager for Logging and Debugging
Using the Task Manager for Logging and Debugging
![]() Using Event Viewer for Logging and Debugging
Using Event Viewer for Logging and Debugging
![]() Using the Debugging Tools Available in Windows Server 2016
Using the Debugging Tools Available in Windows Server 2016
Up to this point, this book has focused on planning, designing, implementing, and migrating to Windows Server 2016. This chapter turns your attention to the built-in management tools for monitoring, logging, debugging, and validating reliability, which help organizations identify and isolate problems in their networking environments.
Many of the tools identified in this chapter are similar to those used in earlier versions of Windows. However, as with most features of the Windows Server family of products, the features and functionality of the tools have been improved and expanded on in Windows Server 2016.
This chapter covers the Task Manager for logging and debugging issues, the Event Viewer for monitoring and troubleshooting system issues, Performance Monitor, the Best Practices Analyzer tool, the Task Scheduler for automation, and additional debugging tools available with Windows Server 2016.
Using the Task Manager for Logging and Debugging
The Task Manager is a familiar monitoring tool found in Windows Server 2016. Ultimately, the tool is very similar to the Task Manager included with earlier versions of Windows server, such as Windows Server 2012 R2. It still provides an instant view of system resources, such as processor activity, process activity, memory usage, networking activity, user information, and resource consumption. However, there are some noticeable changes, focusing primarily on the usability and functionality of the toolset.
The Windows Server 2016 Task Manager is useful for an immediate view of key system operations. It comes in handy when a user notes slow response time, system problems, or other nondescript problems with the network. With just a quick glance at the Task Manager, you can see whether a server is using all available disk, processor, memory, or networking resources.
You can launch the Task Manager in any of the following three ways:
![]() Right-click the taskbar and select Task Manager.
Right-click the taskbar and select Task Manager.
![]() Press Ctrl+Shift+Esc.
Press Ctrl+Shift+Esc.
![]() Press Ctrl+Alt+Del and select Start Task Manager.
Press Ctrl+Alt+Del and select Start Task Manager.
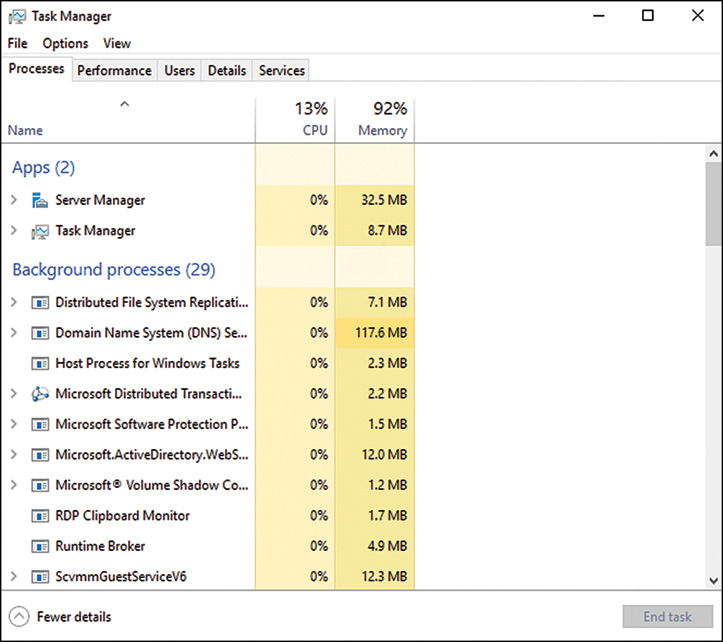
When the Task Manager loads, you will notice a new minimalist view, as shown in Figure 32.1.
TIP
From the minimalist view, you can select any nonresponding task and choose to End Task. To swap to full view, click More Details.
The following sections provide a closer look at how helpful the Task Manager components can be.
Microsoft introduced us to Windows Task Manager with Windows NT 4.0. This version enabled you to run a process, list running processes, or kill a running process. Over the years, the enhancements grew to allow for prioritizing processes, setting affinity, seeing logged-on users, viewing services, and displaying various system utilization monitors.
With such augmentations, Windows Task Manager has matured into a central repository of key information. However, with hardware improvements along the way, Windows Task Manager was a site for sore eyes when it came to real-time charting. Looking at the Performance tab on a Windows Server 2008 Task Manager proves to be rather difficult when attempting to review details on a larger number of logical cores simultaneously. You are effectively staring at side-by-side tiny charts. Furthermore, no easy method exists for grabbing the processor ID.
Microsoft had three goals in mind with the Windows Server 2016 version of Task Manager:
![]() Optimize Task Manager for the most common scenario: using the Processes tab to kill processes based on utilization.
Optimize Task Manager for the most common scenario: using the Processes tab to kill processes based on utilization.
![]() Use modern information design to achieve functional goals: focusing on information provided and visualization to enhance functionality/usability.
Use modern information design to achieve functional goals: focusing on information provided and visualization to enhance functionality/usability.
![]() Do not remove functionality.
Do not remove functionality.
Monitoring Processes
The first tab on the Task Manager, in the detailed view, is the Processes tab. It provides a list of running processes, or image names, on the server. It also measures the performance in simple data format. This information includes CPU percent used and memory allocated to each process.
You can sort the processes by clicking the CPU or Memory column header. The processes are then sorted in order of usage. This way, you can tell which one is using the most of these resources and is slowing down performance of your server. You can terminate a process by selecting the process and clicking the End Task button.
The new heat map concept translates well in the CPU & Memory Utilization columns of the Processes tab, where darker orange colors indicate higher utilizations.
The Processes tab also comes with a few new features (all shown in Figure 32.2):
![]() Sorted classifications (designating processes as either Apps [generally safe to end task], Background processes, and Windows processes [generally not safe to end task]).
Sorted classifications (designating processes as either Apps [generally safe to end task], Background processes, and Windows processes [generally not safe to end task]).
![]() Grouping (where processes are grouped under their parent process).
Grouping (where processes are grouped under their parent process).
![]() Right-click to Search Online, which brings you to a Bing search results page on any item in question.
Right-click to Search Online, which brings you to a Bing search results page on any item in question.

Monitoring Performance
The Performance tab enables you to view the CPU, memory, and Ethernet usage in graphical form. This information is especially useful when you need a quick view of a CPU or memory performance bottleneck.
One of the most noticeably functionally enhanced tabs in Windows Server 2016, the Performance tab, now includes dynamic graphs, showing additional details for CPU, memory, disk, and Ethernet utilization. As seen in Figure 32.3, selecting an item in the left frame (CPU, for example) produces details on utilization, speed, processes, threads, handles, and uptime in a detailed frame on the right side.
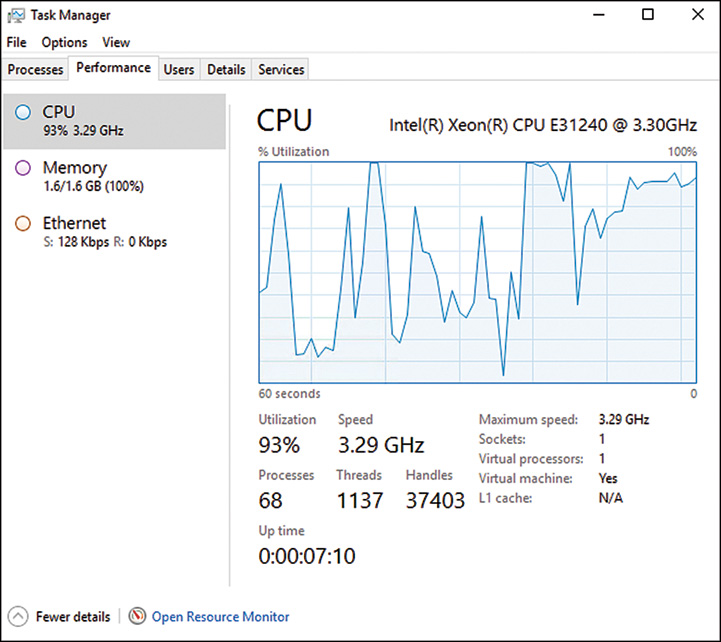
FIGURE 32.3 The Performance tab includes dynamic graphs, showing additional details for CPU, memory, disk, and Ethernet utilization.
Take a look at the enhancements:
![]() Hovering over the heat map reveals the processor ID when the graph view is set to Logical Processors.
Hovering over the heat map reveals the processor ID when the graph view is set to Logical Processors.
![]() Double-clicking the frame on the right, which hosts the charts, reduces Task Manager to a minimalist view (and double-clicking again reverts back to full view).
Double-clicking the frame on the right, which hosts the charts, reduces Task Manager to a minimalist view (and double-clicking again reverts back to full view).
NOTE
Similar views, detailed frames, and minimalist views, similar to what is shown in Figure 32.4, are available for memory utilization and network throughput.

The color-shaded heat map has been touted for its ability to better scale and capture comparisons in real time. The idea is as simple as it is useful. Supporting 160 logical cores on one screen (16 across × 10 down) or up to 640 (with a scrollbar), the CPU utilization screen is the biggest obvious benefiter of this feature.
Monitoring User Activity
Sorting tasks, under the owner, the Users tab enables you to disconnect a user or handle a specific task listed under a given user (end task, create a dump file, open file location, search online, or see the properties of a task). Each user, and each of that user’s child tasks, is individually listed with CPU and memory utilization. There is also a right-click option on any given user that takes you directly to Manage User Accounts.
Monitoring Details
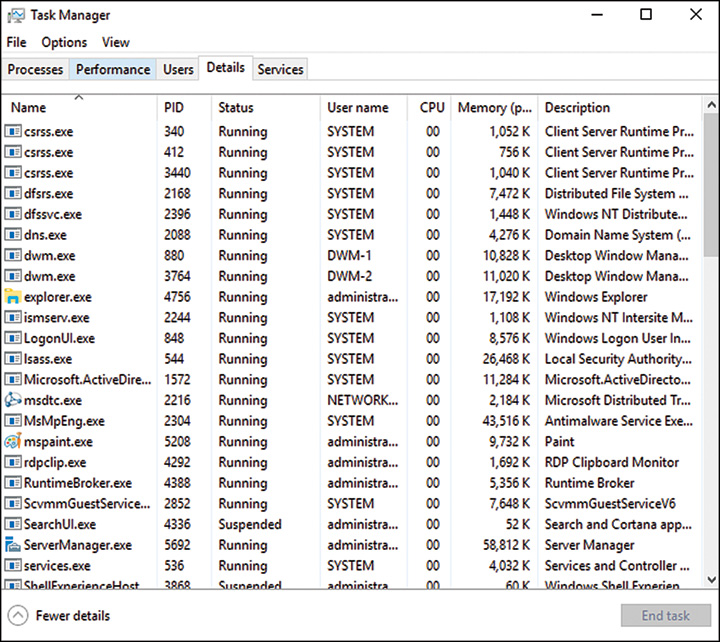
From the Details tab, shown in Figure 32.5, you can handle many of the requests available in earlier versions of Task Manager, including ending a task, ending a process tree, setting priority, setting affinity, creating a dump file, opening the file location, or going to the services.
![]() Set Affinity—Configuring threads to run on specific processors allows unused cores to be activated and clock speeds to be increased. Configuring threads to run on different processors may increase performance.
Set Affinity—Configuring threads to run on specific processors allows unused cores to be activated and clock speeds to be increased. Configuring threads to run on different processors may increase performance.
![]() Search Online—The Search Online option is again only a right-click away for a Bing search on the selected topic.
Search Online—The Search Online option is again only a right-click away for a Bing search on the selected topic.
![]() Analyze Wait Chain—A feature previously available by opening Resource Monitor now finds itself present right within Task Manager. This tree view shows which processes are using or waiting to use a required resource that is being used by another process.
Analyze Wait Chain—A feature previously available by opening Resource Monitor now finds itself present right within Task Manager. This tree view shows which processes are using or waiting to use a required resource that is being used by another process.
Monitoring Services
For the most part unchanged from its predecessor, the Services tab continues to show the name, process ID (PID), description, status, and group of all services. This makes starting, stopping, or restarting an offending service feasible within one tool. You also have a link that takes you directly to the Services Microsoft Management Console (MMC), should you need to change startup type, change the service account, set recovery options, or study dependencies.
Related PowerShell Functionality
As discussed, Task Manager enables you to quickly see information about and interact with processes and tasks. Here are some ways to go about similar tasks with Windows PowerShell.
Get-Process
The Get-Process cmdlet returns running processes on the target computer (local or remote).
Description
The Get-Process cmdlet returns running processes on a local or remote computer.
A basic execution (without any parameters) of the command returns all the running processes on the local computer. You can also specify process using the name or PID. As with any PowerShell commands, you can pass a process object through the pipeline to Get-Process using the identity value.
By default, Get-Process returns a process object that has detailed information about the process and supports methods that let you start and stop the process. You can also use the parameters of Get-Process to get file version information for the program that runs in the process and to get the modules that the process loaded.
Examples
Get-Process *
What it does: This lists all running processes on a local computer. This is a quick snapshot of running processes that can easily be used on a remote computer as well.
Get-Process explorer | get-member
What it does: This lists all the properties of the explorer.exe process. Listing the properties of an object provides detailed information about the component as well as identifying further operations that can be performed.
Get-Process * | ft name, workingset, basepriority, starttime, threads, cpu,
processoraffinity–auto
What it does: This returns a set of useful properties for all running processes on the local computer. Formatting the output using commands such as Format-Table, or ft, makes comparing relevant data and identifying patterns much easier.
TIP
The processor affinity value is calculated by adding the representative values for each core. In our sample system with eight CPUs, we have the following values: 1 for (Core0), 2 for (Core1), 4 for (Core2), 8 for (Core3), 16 for (Core4), 32 for (Core5), 64 for (Core6), and 128 for (Core7). For example, if cores 0 through 3 were selected, the representative values of 1, 2, 4, and 8 would be added to get the processor affinity value of 15.
Description
The Get-Service cmdlet returns information about services on the local computer or on a remote computer. Services in various states including running and stopped services are returned.
You can direct Get-Service to get only particular services by specifying the service name or display name of the services, or you can pipe service objects to Get-Service.
What it does: This lists services dependent on the windows Time service. An understanding of service boot order and dependencies can help troubleshoot boot issues.
Get-Service | Where {$_.Status–eq “Running”}
What it does: This lists the current running services on the local computer. A very useful way to quickly determine running services on the local or remote computer.
Start-Process and Stop-Process
Starts and stops one or more processes on the local computer.
Description
Starts or stops one or more processes on the local computer. To specify the process, enter a filename (executable or script file). You can use the parameters of the command to specify options, such as loading a user profile, starting the process in a new window, or using alternate credentials.
What it does: Starts Notepad (or other associated program) to open C:Temp.txt and print it. It’s a handy way to include simple application actions within a script.
Stop-Process–processname netlogon -force
Start-Process–processname netlogon
What it does: Restarts the Netlogon process without confirmation, a common maintenance task.
Using Event Viewer for Logging and Debugging
Event Viewer is the next tool to use when debugging, problem-solving, or troubleshooting to resolve a problem with a Windows Server 2016 system. Event Viewer, as shown in Figure 32.6, is a built-in Windows Server 2016 tool completely rewritten based on an Extensible Markup Language (XML) infrastructure, which is used for gathering troubleshooting information and conducting diagnostics. Event Viewer was completely rewritten in Windows Server 2008, and many new features and functionality were introduced, including a new user interface and a home page, which includes an overview and summary of the system.

The upcoming sections focus on the basic elements of an event, including detailed sections covering the features and functionality.
Microsoft defines an event as any significant occurrence in the operating system or an application that requires tracking of the information. An event is not always negative. A successful logon to the network, a successful transfer of messages, or replication of data can also generate an event in Windows. It is important to sift through the events to determine which are informational events and which are critical events that require attention.
When server or application failures occur, Event Viewer is one of the first places to check for information. You can use Event Viewer to monitor, track, view, and audit security of your server and network. It is used to track information of both hardware and software contained in your server. The information provided in Event Viewer can be a good starting point to identify and track down the root cause of any system errors or problems.
Event Viewer can be accessed through the Server Manager. You can also launch Event Viewer by running the Microsoft Management Console (mmc.exe) and adding the snap-in or through a command line by running eventvwr.msc.
Each log has common properties associated with its events. The following bullets define these properties (as shown in figure 32.7):
![]() Level—This property defines the severity of the event. An icon appears next to each type of event. It helps to quickly identify whether the event is informational, a warning, or an error.
Level—This property defines the severity of the event. An icon appears next to each type of event. It helps to quickly identify whether the event is informational, a warning, or an error.
![]() Date and Time (Logged)—This property indicates the date and time that the event occurred. You can sort events by date and time by clicking this column. This information is particularly helpful in tracing back an incident that occurred during a specific time period, such as a hardware upgrade before your server started experiencing problems.
Date and Time (Logged)—This property indicates the date and time that the event occurred. You can sort events by date and time by clicking this column. This information is particularly helpful in tracing back an incident that occurred during a specific time period, such as a hardware upgrade before your server started experiencing problems.
![]() Source—This property identifies the source of the event, which can be an application, remote access, a service, and so on. The source is very useful in determining what caused the event.
Source—This property identifies the source of the event, which can be an application, remote access, a service, and so on. The source is very useful in determining what caused the event.
![]() Event ID—Each event has an associated event ID, which is a numeral generated by the source and is unique to each type of event. You can use the event ID on the Microsoft Support website (www.microsoft.com/technet/) to find topics and solutions related to an event on your server.
Event ID—Each event has an associated event ID, which is a numeral generated by the source and is unique to each type of event. You can use the event ID on the Microsoft Support website (www.microsoft.com/technet/) to find topics and solutions related to an event on your server.
![]() Task Category—This property determines the category of an event. Task Category examples from the Security log include Logon/Logoff, System, Object Access, and others.
Task Category—This property determines the category of an event. Task Category examples from the Security log include Logon/Logoff, System, Object Access, and others.
Examining the Event Viewer User Interface
The interface for Event Viewer in Windows Server 2008 R2 has changed significantly from earlier versions, and those changes remain intact for Windows Server 2016. Although the information produced by logged events remains much the same, it’s important to be familiar with the interface to take advantage of the features and functionality.
Administrators accustomed to using the Microsoft Management Console (MMC) will notice similarities in the new look and feel of the Event Viewer user interface. The navigation tree on the left pane of the Event Viewer window lists the event logs available to view and also introduces new folders for creating custom event views and subscriptions from remote systems. The central details pane, located in the center of the console, displays relevant event information based on the folder selected in the navigation tree. The home page central details pane also includes a layout to bolster the administrator’s experience by summarizing administrative events by date and criticality, providing log summaries and displaying recently viewed nodes. Finally, the tasks pane, located on the extreme right side of the window, contains context-sensitive actions depending on the focus in the Event Viewer snap-in.
The folders in the left pane of the Event Viewer are organized as follows:
![]() Custom Views
Custom Views
![]() Windows Logs
Windows Logs
![]() Applications and Services Logs
Applications and Services Logs
![]() Subscriptions
Subscriptions
The Custom Views Folder
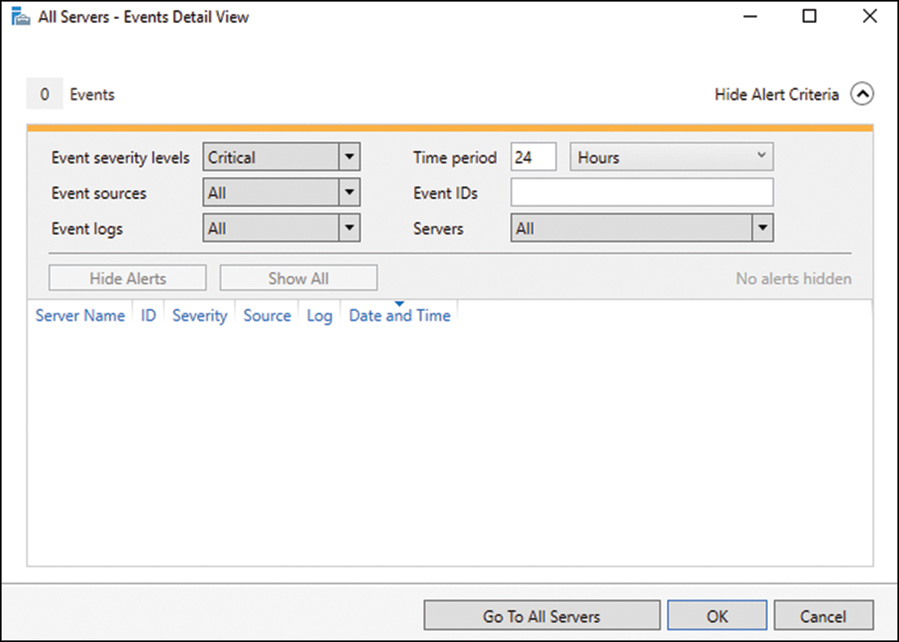
Custom views are filters either created automatically by Windows Server 2016 when new server roles or applications such as Active Directory Certificate Services (AD CS) and Dynamic Host Configuration Protocol (DHCP) servers are added to the system or manually by administrators. It is important for administrators to have the ability to create filters that target only the events they are interested in viewing to quickly diagnose and remediate issues on the Windows Server 2016 system and infrastructure. By expanding the Custom Views folder in the Event Viewer navigation tree and right-clicking Administrative Events, selecting Properties, and clicking the Edit Filter button, you can see how information from the event log is parsed into a set of filtered events. The Custom View Properties Filter tab is displayed in Figure 32.8. In the built-in Administrative Events custom views, all critical, error, and warning events are captured for all event logs. Instead of looking at the large number of informational logs captured by Windows Server 2016 and cycling through each Windows log, this filter gives the administrator a single place to go and quickly check for any potential problems contained on the system.

Also listed in the Custom View section of Event Viewer are predefined filters created by Windows Server 2016 when new roles are added to the system. These queries cannot be edited; however, they provide events related to all Windows Server 2016 roles and the logical grouping can be used to quickly drill down into issues affecting the performance of the system as it relates to specific server roles. Again, this is a way of helping an administrator find the information needed to identify and ultimately resolve server problems quickly and efficiently.
The filter was first introduced with Windows Server 2008. The Administrative Events filter groups all events associated with the system from an administrative perspective. By drilling down to the Administrative Events filter, an administrator can quickly decipher issues associated with all administrative events.
Creating a New Custom View
To create a new custom view in Event Viewer, right-click the Custom View folder and select Create Custom View. Alternatively, select Custom View from the Action menu. This results in the Custom View Properties box, as shown in Figure 32.8.
First, decide whether you want to filter events based on date; if so, specify the date range by using the Logged drop-down list. Options include Any Time, Custom Range, and specific time intervals. The next step is to specify the event level criteria to include in the custom view. Options include Critical, Error, Warning, Information, and Verbose. After the event level settings are specified, the next area to focus on is the By Log and By Source sections. By leveraging the drop-down lists, specify the event log and event log sources to be included in this custom filter. To further refine the custom filter, enter specific event IDs, task categories, keywords, users, computers, and then click OK and save the filter by providing it a name, description, and the location of where to save the view.
Performance and memory consumption might be negatively affected if you have included too many events in the custom view.
After you define a custom view, you can export it as an XML file, which can then be imported into other systems. Filters can also be written or modified directly in XML, but keep in mind, after a filter has been modified using the XML tab, it can no longer be edited using the GUI described previously.
The Windows Logs Folder
The Windows Logs folder contains the traditional application, security, and system logs. Windows Server 2016 also includes two out-of-the-box logs, which can also be found under the Windows Logs folder: the Setup and Forwarded Events logs. The following is a brief description of the different types of Windows logs that are available:
![]() Application log—This log contains events based on applications or programs residing on the system.
Application log—This log contains events based on applications or programs residing on the system.
![]() Security log—Depending on the auditing settings configured, the security log captures events specific to authentication and object access.
Security log—Depending on the auditing settings configured, the security log captures events specific to authentication and object access.
![]() Setup log—This log captures information tailored toward installation of applications, server roles, and features.
Setup log—This log captures information tailored toward installation of applications, server roles, and features.
![]() System log—Events associated with Windows system components are logged to the system log. These might include driver errors or other components failing to load.
System log—Events associated with Windows system components are logged to the system log. These might include driver errors or other components failing to load.
![]() Forwarded Events log—Because computers can experience similar technical issues, this feature consolidates and stores events captured from remote computers into a single log to facilitate problem isolation, identification, and remediation.
Forwarded Events log—Because computers can experience similar technical issues, this feature consolidates and stores events captured from remote computers into a single log to facilitate problem isolation, identification, and remediation.
The Applications and Services Logs Folder
The Applications and Services Logs folder introduces a way to logically organize, present, and store events based on a specific Windows application, component, or service instead of capturing events that affect the whole system. An administrator can easily drill into a specific item such as DFS Replication or DNS Server and easily review those events without being bombarded or overwhelmed by all the other system-wide events.
These logs include four subtypes: Admin, Operational, Analytic, and Debug logs. The events found in Admin logs are geared toward end-users, administrators, and support personnel. This log is very useful because it not only describes a problem, but also identifies ways to deal with the issues. Operational logs are also a benefit to systems administrators, but they typically require more interpretation.
Analytic and Debug logs are more complex. Analytic logs trace an issue and often a high number of events are captured. Debug logs are primarily used by developers to debug applications. Both Analytic and Debug logs are hidden and disabled by default. To view them, right-click Applications and Services Logs, and then select View, Show Analytic and Debug Logs.
The Subscriptions Folder
The final folder in the Event Viewer console tree is called Subscriptions. Subscriptions is another feature included with the Windows Server 2016 Event Viewer. It allows remote computers to forward events; therefore, they can be viewed locally from a central system. For example, if you are experiencing issues between two Windows Server 2016 systems, diagnosing the problem becomes challenging because both systems typically log data to their respective event logs. In this case, it is possible to create a subscription on one of the servers to forward the event log data from the other server. Therefore, both system event logs can be reviewed from a central system.
Configuring Event Subscriptions
To configure event subscriptions between two systems, you must first prepare each source computer to send events to remote computers:
1. Log on to the source computer. Best practice is to log on with a domain account that has administrative permissions on the source computer.
2. Open a PowerShell console session and ensure Remote Management is enabled by executing the Enable-PSRemoting command.
3. Add the collector computer to the local administrators group of the source computer.
4. Log on to the collector computer following the steps outlined previously for the source system.
5. From an elevated command prompt, run wecutil qc.
6. If you intend to manage event delivery optimization options such as Minimize Bandwidth or Minimize Latency, also run Enable-PSRemoting on the collector computer.
After the collector and source computers are prepared, a subscription must be made identifying the events that will be pulled from the source computers. To create a new subscription, follow these steps:
1. On the collector computer, run Event Viewer with an account with administrative permissions.
2. Click the Subscriptions folder in the console tree and select Create Subscription or right-click and select the same command from the context menu.
3. In the Subscription Name box, type a name for the subscription.
4. In the Description box, enter an optional description.
5. In the Destination Log box, select the log file where collected events will be stored. By default, these events are stored in the forwarded events log in the Windows Logs folder of the console tree.
6. Click Select Computers to select the source computers that will be forwarding events. Add the appropriate domain computers, and then click OK.
7. Click Select Events and configure the event logs and types to collect. Click OK.
8. Click OK to create the subscription.
Conducting Additional Event Viewer Management Tasks
Now that you understand the functionality of each of the folders associated with the Event Viewer included with Windows Server 2016, it is beneficial to review the upcoming sections for additional management tasks associated with Event Viewer. These tasks include the following:
![]() Saving event logs
Saving event logs
![]() Organizing data
Organizing data
![]() Viewing logs on remote servers
Viewing logs on remote servers
![]() Archiving events
Archiving events
![]() Customizing the event log
Customizing the event log
![]() Understanding the security log
Understanding the security log
Saving Event Logs
Event logs can be saved and viewed at a later time. You can save an event log by either right-clicking a specific log and choosing Save Events As or by picking individual events from within a log, right-clicking the selected events, and choosing Save Selected Items. Entire logs and selected events can also be saved by selecting the same command from the Actions pane. After being saved, these logs can be opened by right-clicking the appropriate log and selecting Open Saved Log or by clicking the same command in the Actions pane. After a log has been opened, it will be displayed in a new top-level folder called Saved Logs from within Event Viewer.
Organizing Data
Vast numbers of logs can be collected by Windows and displayed in the central pane of Event Viewer. New tools or enhancement to old ones make finding useful information much easier than in any other iteration of Event Viewer:
![]() Sorting—Events can be sorted in many ways, for example, by right-clicking the folder or Custom View icon and then selecting View, Sort By, or by selecting the column name on which to sort in the left pane or clicking the column to be sorted or the heading. Sorting is a quick way to find items at a very high level (e.g., by time, source, or event ID). The features for finding and sorting data are more robust and well worth learning.
Sorting—Events can be sorted in many ways, for example, by right-clicking the folder or Custom View icon and then selecting View, Sort By, or by selecting the column name on which to sort in the left pane or clicking the column to be sorted or the heading. Sorting is a quick way to find items at a very high level (e.g., by time, source, or event ID). The features for finding and sorting data are more robust and well worth learning.
![]() Selection and sorting of column headings—Various columns can be added to or removed from any of the event logs. The order in which columns are displayed from left to right can be altered as well by selecting the column in the Select Column dialog box and clicking the up- or down-arrow button.
Selection and sorting of column headings—Various columns can be added to or removed from any of the event logs. The order in which columns are displayed from left to right can be altered as well by selecting the column in the Select Column dialog box and clicking the up- or down-arrow button.
![]() Grouping—A way to view event log information is through the grouping function. By right-clicking column headings, an administrator can opt to group the event log being viewed by any of the columns in view. By isolating events, desired and specific criteria trends can be spotted that can help in isolating issues and ultimately resolving problems.
Grouping—A way to view event log information is through the grouping function. By right-clicking column headings, an administrator can opt to group the event log being viewed by any of the columns in view. By isolating events, desired and specific criteria trends can be spotted that can help in isolating issues and ultimately resolving problems.
![]() Filtering—As mentioned earlier, filtering, like grouping, provides a means to isolate and only display the data you want to see in Event Viewer. Filtering, however, gives the administrator many more options for determining which data should be displayed than grouping or sorting does. Filters can be defined based on any or all the event levels, log or source, event IDs, task category, keywords, or user or computers. After being created, filters can be exported for use on other systems.
Filtering—As mentioned earlier, filtering, like grouping, provides a means to isolate and only display the data you want to see in Event Viewer. Filtering, however, gives the administrator many more options for determining which data should be displayed than grouping or sorting does. Filters can be defined based on any or all the event levels, log or source, event IDs, task category, keywords, or user or computers. After being created, filters can be exported for use on other systems.
![]() Tasks—By attaching tasks to events, logs, or custom views, administrators can bring some automation and notification into play when certain events occur. To create a task, simply right-click the custom view, built-in log, or specific event of your choice, and then right-click Attach a Task to This Custom View, Log, or Event. The Create a Basic Task Wizard then launches; on the first tab, just select a name and description for the task. Click Next to view the criteria that will trigger the task action. (This section cannot be edited and is populated based on the custom view, log, or task selected when the wizard is initiated.) Click Next and select Start a Program, Send an E-mail, or Display a Message as desired.
Tasks—By attaching tasks to events, logs, or custom views, administrators can bring some automation and notification into play when certain events occur. To create a task, simply right-click the custom view, built-in log, or specific event of your choice, and then right-click Attach a Task to This Custom View, Log, or Event. The Create a Basic Task Wizard then launches; on the first tab, just select a name and description for the task. Click Next to view the criteria that will trigger the task action. (This section cannot be edited and is populated based on the custom view, log, or task selected when the wizard is initiated.) Click Next and select Start a Program, Send an E-mail, or Display a Message as desired.
Viewing Logs on Remote Servers
You can use Event Viewer to view event logs on other computers on your network. To connect to another computer from the console tree, right-click Event Viewer (Local) and click Connect to Another Computer. Select Another Computer and then enter the name of the computer or browse to it and click OK. You must be logged on as an administrator or be a member of the Administrators group to view event logs on a remote computer. If you are not logged on with adequate permissions, you can select the Connect as Another User check box and set the credentials of an account that has proper permissions to view the logs on the remote computer.
Archiving Events
Occasionally, you might need to archive an event log. Archiving a log copies the contents of the log to a file. Archiving is useful in creating benchmark records for the baseline of a server or for storing a copy of the log so it can be viewed or accessed elsewhere. When an event log is archived, it is saved in one of four forms:
![]() Comma-delimited text file (.csv)—This format allows the information to be used in a program such as Microsoft Excel.
Comma-delimited text file (.csv)—This format allows the information to be used in a program such as Microsoft Excel.
![]() Text-file format (.txt)—Information in this format can be used in a program such as a word processing program.
Text-file format (.txt)—Information in this format can be used in a program such as a word processing program.
![]() Log file (.evtx)—This format allows the archived log to be viewed again in the Windows Server 2016 or Windows 8 Event Viewer. Note that the event log format is XML, which earlier versions of Windows, prior to Windows Server 2008 or Windows 7, cannot read.
Log file (.evtx)—This format allows the archived log to be viewed again in the Windows Server 2016 or Windows 8 Event Viewer. Note that the event log format is XML, which earlier versions of Windows, prior to Windows Server 2008 or Windows 7, cannot read.
![]() XML (.xml)—This format saves the event log in raw XML. XML is used throughout Event Viewer for filters, tasks, and logging.
XML (.xml)—This format saves the event log in raw XML. XML is used throughout Event Viewer for filters, tasks, and logging.
The event description is saved in all archived logs. To archive, right-click the log to be archived and click Save Log File As. In the File Name field of the resulting property page, type in a name for the archived log file, choose a file type from the file format options of .csv, .txt, .evtx, or .xml, and then click Save.
NOTE
You must be a member of the Backup Operators group at the minimum to archive an event log.
Logs archived in the log-file format (.evtx) can be reopened using the Windows Server 2016 Event Viewer utility. Logs saved in log-file format retain the XML data for each event recorded. Event logs, by default, are stored on the server where the Event Viewer utility is being run. Data can, however, be archived to a remote server by simply providing a UNC path (such as \servernameshare) when entering a filename.
Logs archived in comma-delimited (.csv) or text (.txt) format can be reopened in other programs such as Microsoft Word or Excel. These two formats do not retain the XML data or formatting.
Customizing the Event Log
The properties of an event log can be configured. In Event Viewer, the properties of a log are defined by general characteristics: log path, current size, date created, when last modified or accessed, maximum size, and what should be done when the maximum log size is reached.
To customize the event log, access the properties of the particular log by highlighting the log and selecting Action and then Properties. Alternatively, you can right-click the log and select Properties to display the General tab of the log’s property page, as shown in Figure 32.9.
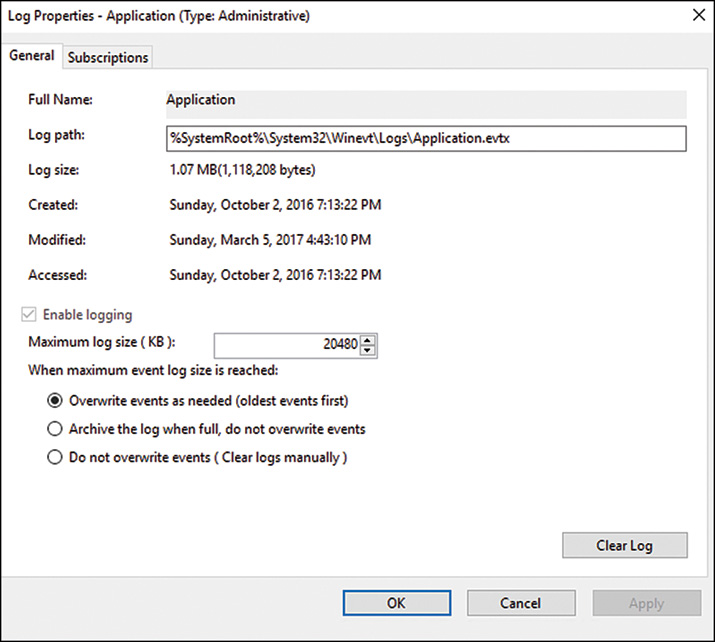
The Log Size section specifies the maximum size of the log and the subsequent actions to take when the maximum log size limit is reached. The three options are as follows:
![]() Overwrite Events as Needed (Oldest Events First)
Overwrite Events as Needed (Oldest Events First)
![]() Archive the Log When Full, Do Not Overwrite Events
Archive the Log When Full, Do Not Overwrite Events
![]() Do Not Overwrite Events (Clear Logs Manually)
Do Not Overwrite Events (Clear Logs Manually)
If you select the Do Not Overwrite Events option, Windows Server 2016 stops logging events when the log is full. Although Windows Server 2016 notifies you when the log is full, you need to monitor the log and manually clear the log periodically so that new events can be tracked and stored in the log file.
In addition, log file sizes must be specified in multiples of 64KB. If a value is not in multiples of 64KB, Event Viewer automatically sets the log file size to a multiple of 64KB.
When you need to clear the event log, click the Clear Log button in the lower 2right of the property page.
Understanding the Security Log
Effectively logging an accurate and wide range of security events in Event Viewer requires an understanding of auditing in Windows Server 2016. It is important to know events are not audited by default. You can enable auditing in the local security policy for a local server, the domain controller security policy for a domain controller machine, and the Active Directory (AD) Group Policy Object (GPO) for a domain. Through auditing, you can track Windows Server 2016 security events. It is possible to request that an audit entry be written to the security event log whenever certain actions are carried out or an object such as a file or printer in AD is accessed. The audit entry shows the action carried out, the user responsible for the action, and the date and time of the action.
Related PowerShell Functionality
As discussed, one of the main functions of Event Viewer is to quickly see filtered Event Log entries. Here are some ways to go about similar tasks with Windows PowerShell.
Get-EventLog
The Get-EventLog cmdlet gets the events in an event log, or a list of the event logs, on the local or remote computers.
Description
The cmdlet returns events and event logs on the specified computer (local or remote). This is useful when scripting searches for specific event message or ID. Creating reports for recent event messages is also facilitated by this command.
The cmdlet parameters provide the ability to refine the returned result set using any property values. The EventLog cmdlets work only on classic event logs. To get events from applications and services event logs, you must use Get-WinEvent.
What it does: Searches for the word failed in the message body of the Application Log entries and returns applicable event log entries.
Get-EventLog "Windows PowerShell" | Where-Object {$_.EventID -eq 403}
What it does: Returns event ID 403 PowerShell log entries.
Get-EventLog–LogName System–Newest 80 | ConvertTo-HTML | Out-File
C:ReportsEvents.htm
What it does: Returns 80 newest system log entries, converts to HTML and exports to C:ReportsEvent.htm.
Get-EventLog -LogName Application -newest 500 | Group-Object -Property source
[nd]NoElement
What it does: Returns 500 newest application log entries and sorts them by count of each unique source.
Get-EventLog–LogName System -newest 10000 | Where-Object { $_.EventID -like "200?"}
|
Format-Table TimeWritten, EventID, Message–auto
What it does: Returns events from the System event log that have an event ID between 2000 and 2009 and are in the 10,000 newest events in the log. Events are returned as a table with the indicated fields.
Get-EventLog Application -EntryType Error -After (Get-Date).AddDays(-1)
What it does: Return errors received in the past day in the application log.
Performance Monitoring
Performance is a basis for measuring how fast application and system tasks are completed on a computer, and reliability is a basis for measuring system operation. How reliable a system is will be based on whether it regularly operates at the level at which it was designed to perform. Based on these descriptions, it should be easy to recognize that performance and reliability monitoring are crucial aspects in the overall availability and health of a Windows Server 2016 infrastructure. To ensure maximum uptime, a well-thought-through process needs to be put in place to monitor, identify, diagnose, and analyze system performance. This process should invariably provide a means for quickly comparing system performances at varying instances in time and detecting and potentially preventing a catastrophic incident before it causes system downtime.
Performance Monitor, which is an MMC snap-in, provides a number of tools for administrators that enable them to conduct real-time system monitoring, examine system resources, collect performance data, and create performance reports from a single console. This tool is literally a combination of three legacy Windows Server monitoring tools: System Monitor, Performance Monitor, and Server Performance Advisor. However, new features and functionalities have been introduced to shake things up, including data collector sets, Resource view, scheduling, diagnostic reporting, and wizards and templates for creating logs. To launch the Performance Monitor MMC snap-in tool, select Server Manager or type perfmon.msc at a command prompt.
The Performance Monitor MMC snap-in consists the following elements:
![]() Overview screen
Overview screen
![]() Performance Monitor
Performance Monitor
![]() Data collector sets
Data collector sets
![]() Report generation
Report generation
The upcoming sections further explore these major elements of the Performance Monitoring tool.
Performance Monitor Overview
The first area of interest in the Performance Monitor snap-in is the Overview of Performance Monitor screen, also known as the Performance icon. It is displayed as the home page in the central details pane when the Performance Monitor tool is invoked.
The Overview of Performance Monitor screen presents holistic, real-time graphical illustrations of a Windows Server 2016 system’s CPU usage, disk usage, network usage, and memory usage, as displayed in Figure 32.10.

Additional process-level details can be viewed to better understand your system’s current resource usage by reviewing subsections beneath each metric being displayed. For example, the Memory section includes % Committed Bytes in Use, Available Mbytes, and Cache Faults/sec.
The Overview of Performance Monitor screen is the first level of defense when there is a need to get a quick overview of a system’s resources. If quick diagnosis of an issue cannot be achieved, an administrator should leverage the additional tools within Performance Monitor. These are covered in the upcoming sections.
Performance Monitor
First, defining some terms used in performance monitoring will help clarify the function of Performance Monitor and how it ties in to software and system functionality. The three components noted in Performance Monitor, data collector sets, and reports are as follows:
![]() Object—Components contained in a system are grouped into objects. Objects are grouped according to system functionality or by association within the system. Objects can represent logical entities such as memory or a physical mechanism such as a hard disk drive. The number of objects available in a system depends on the configuration. For example, if Microsoft Exchange Server is installed on a server, some objects pertaining to Exchange would be available.
Object—Components contained in a system are grouped into objects. Objects are grouped according to system functionality or by association within the system. Objects can represent logical entities such as memory or a physical mechanism such as a hard disk drive. The number of objects available in a system depends on the configuration. For example, if Microsoft Exchange Server is installed on a server, some objects pertaining to Exchange would be available.
![]() Counter—Counters are subsets of objects. Counters typically provide more detailed information for an object such as queue length or throughput for an object. The System Monitor can collect data through the counters and display it in either a graphical format or a text log format.
Counter—Counters are subsets of objects. Counters typically provide more detailed information for an object such as queue length or throughput for an object. The System Monitor can collect data through the counters and display it in either a graphical format or a text log format.
![]() Instances—If a server has more than one similar object, each one is considered an instance. For example, a server with multiple processors has individual counters for each instance of the processor. Counters with multiple instances also have an instance for the combined data collected for the instances.
Instances—If a server has more than one similar object, each one is considered an instance. For example, a server with multiple processors has individual counters for each instance of the processor. Counters with multiple instances also have an instance for the combined data collected for the instances.
Performance Monitor provides an interface that allows for the analysis of system data, research performance, and bottlenecks. Performance Monitor displays performance counter output in line graphs, histogram (bar chart), and report format.
The histogram and line graphs can be used to view multiple counters at the same time, as shown in Figure 32.11. However, each data point displays only a single value that is independent of its object. The Report view is better for displaying multiple values.

Accessing Performance Monitor is accomplished by selecting Performance Monitor from the Monitoring Tools folder in the Performance Monitor MMC snap-in. When a new Performance Monitor session is started, it loads a blank system monitor graph into the console with % Processor Time as the only counter defined.
Adding Counters with Performance Monitor
Before counters can be displayed, they have to be added. The counters can be added simply by using the menu bar. The Counter button on the toolbar includes Add, Delete, and Highlight. You can use the Add Counter button to display new counters. Use the Delete Counter button to remove unwanted counters from the display. The Highlight Counter button is helpful for highlighting a particular counter of interest; a counter can be highlighted with either a white or black color around the counter.
To add counters to Performance Monitor, follow these steps:
1. In the navigation tree of Performance Monitor, first expand Performance, Monitoring Tools, and then Performance Monitoring.
2. Either click the Add icon on the menu bar or right-click anywhere on the graph and select Add Counters.
NOTE
Typical baseline counters include Memory—Pages/Sec, PhysicalDisk—Avg. Disk Queue Length, and Processor—% Processor Time.
3. The Add Counters dialog box is invoked, as shown in Figure 32.12. In the Available Counters section, select the desired counters, and then click the Add button.

NOTE
Windows Server 2016 includes a tremendous number of counters to choose from when conducting performance monitoring. It is challenging to fully explain what each counter offers in this section. If you are interested in finding out more about a counter, enable the Show Description option in the Add Counters dialog box and highlight a specific counter to obtain a detailed explanation of it.
4. Review the selected counters in the Added Counters section, and then click OK.
When adding counters, it is possible to conduct remote monitoring by selecting counters from another system. To simplify things, it is also possible to search for instances of a counter and add a group of counters.
Managing Performance Monitor Settings
While back on the Performance Monitor display, update displays by clicking the Clear Display button. Clicking the Freeze Display button or pressing Ctrl+F freezes displays, which suspends data collection. Data collection can be resumed by pressing Ctrl+F or clicking the Freeze Display button again. Click the Update Data button to display an updated data analysis.
It is also possible to export and import a display by using the Cut and Paste buttons. For example, a display can be saved to the Clipboard and then imported into another instance of Performance Monitor. This is commonly used to view or analyze system information about a different system, such as information from a production server.
The Properties page of Performance Monitor has five additional tabs of configuration: General, Source, Data, Graph, and Appearance. Generally, the Properties page provides access to settings that control the graph grid, color, style of display data, and so on. Data can be saved from the monitor in different ways. The easiest way to retain the display features is to save the control as an HTML file.
Performance Monitor enables you to also save log files in HTML or tab-separated (.tsv) format, which you can then analyze by using third-party tools. Alternatively, a tab-separated file can be imported into a spreadsheet or database application such as Excel or Microsoft Access. Windows Server 2016 also enables you to collect data in SQL database format. This is useful for performance analysis at an enterprise level rather than a per-server basis. Reports displayed in Excel can help you better understand the data and provide reports to management. As well as saving log files, you can save the results from Performance Monitor as an image. This is great when you need to obtain a point-in-time depiction of a performance graph.
Data Collector Sets
The Data Collector Sets subfolder is a vital feature available within the Performance Monitor snap-in. The purpose of a data collector set is to review or log system performance data. This is achievable through a single component that encompasses organized multiple data collection points. This information can then be analyzed to diagnose problems, correct system performance issues, or create baselines.
Performance counters, event trace data, and system configuration information are all data collector elements that can be captured and contained in a data collector set. Data collector sets can be based on a predefined template, from a data collector set that already exists, by creating it manually, with a wizard, or it can be user defined. Data collector sets can be exported and used for multiple systems, easing the administrative load involving the configuration of new systems producing more effective monitoring. Wizards facilitate the creation of data collector sets and enable an administrator to quickly create collections based on server roles or the type of information that is required.
NOTE
To create data collector sets, you must be a member of the Administrators group or logged on with an account that is a member of the Performance Log Users group.
Creating Data Collector Sets
You can create data collector sets manually from a template or from Performance Monitor. The following examples will help you understand the different methods for creating data collector sets.
To create a data collector set from Performance Monitor, follow these steps:
1. In the Performance Monitor console, navigate to Performance Monitor.
2. Add counters based on items you want to capture. For this example, the following counters were used: Memory—Pages/Sec, Physical Disk—Avg. Disk Queue Length, and Processor—% Processor Time.
3. After the counters are added, right-click Performance Monitor in the navigation tree, select New, and then select Data Collector Set. The Create New Data Collector Set Wizard is launched.
4. Enter a name for this new data collector set on the Create New Data Collector Set page, and then click Next.
5. On the next page, specify where you want the data to be saved. The default path is the %systemdrive%PerfLogs. Click Finish to save the current settings and exit or click Next to enter a user account to run as.
6. Click the Change button to enter a user for this dataset.
7. Select the option to Save and Close or Start This Data Collector Set Now, and then click Finish to complete the data collector set creation process.
You can configure the resulting data collector set to run immediately by right-clicking the new data collector set and selecting Start. You can view the properties of the data collector set by right-clicking and selecting Properties.
Data collector sets can be created, saved, or restored from templates. Many templates are built in and can be created using the Create New Data Collector Set Wizard in Windows Performance Monitor. This wizard is invoked by right-clicking the User Defined folder, the Event Trace Sessions folder, or the Startup Event Trace Sessions folder under Data Collector Sets and selecting New, Data Collector Set.
To create a data collector set from a template, follow these steps:
1. Expand the Data Collector Sets folder and then the User Defined subfolder in the Performance Monitor snap-in.
2. Right-click the User Defined subfolder and select New Data Collector Set to launch the Create New Data Collector Set Wizard.
3. Enter a name for this new data collector set, select the Create from a Template option, and then click Next.
4. On the next page, select the desired template to use, and then click Next.
NOTE
The Create New Data Collector Set Wizard offers four templates for creating Data Collector Sets: Basic, System Diagnostics, System Performance, and WDAC Diagnostics. Use the Basic template when you want create a basic data collector set. The System Diagnostics template generates a report detailing the status of local hardware resources, system response times, system information, and configuration data. The Systems Performance template is leveraged when you want to not only generate a report detailing the status of local hardware resources and system response times, but also processes on the local computers. In summary, the Basic template usually provides basic diagnostics, the Systems Diagnostics template is good for maximizing performance and streamlining system operations, the System Performance template is a good choice when you want to identify performance issues, and the WDAC Diagnostics template is used for performing analyzing WDAC components. Each of the templates can be edited after they have been created. In addition, it is possible to click the Browse button and import templates from other servers.
5. On the next page, specify where you want the data to be saved. The default path is the %systemdrive%PerfLogs. Click Finish to save the current settings and exit or click Next to enter a user account to run as.
6. Click the Change button to enter a user for this data collector set.
7. Select the option to Save and Close, Start This Data Collector Set Now, or Open Properties for This Data Collector Set, and then click Finish to complete the data collector set creation process.
Reports
The final folder in the Performance Monitor snap-in is Reports. The Reports folder provides diagnostic reports to support administrators in troubleshooting and diagnosing system performance problems including reliability. Reports are viewed in the central details pane of the Performance Monitor snap-in.
The reports are based on data collector sets that were previously defined by users or preconfigured and included with Windows Server 2016 Performance Monitor. The report console’s features and functionality are very similar to those seen by means of the reports introduced with Server Performance Advisor in Windows Server 2003.
The Reports folder contains two subfolders: User Defined reports and System reports. The default System reports typically include reports relating to LAN diagnostics, system diagnostics, and system performance. Additional system reports are automatically generated depending on the server role installed on the Windows Server 2016 system. For example, an Active Directory Diagnostics system report is automatically included in the console when the AD DS server role is installed on the Windows Server 2016 system.
Creating a User-Defined Report
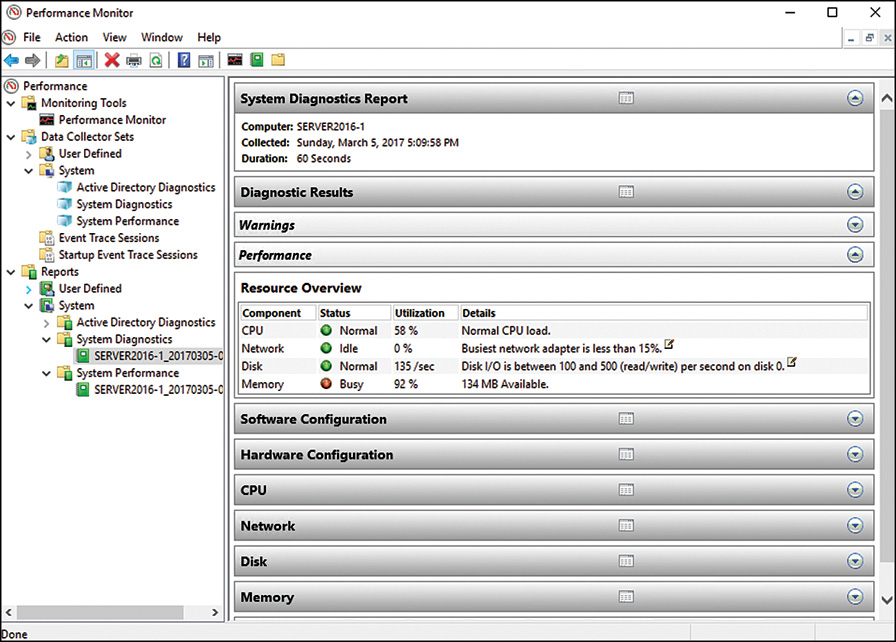
The first step in creating a user-defined report is creating a user-defined collector set and defining the parameters for a collection. After the user-defined collector set is created, data collection must be manually started or scheduled to run at a specific date. At this time, a report folder is automatically generated under the User Defined folder. After the report is created, you can review the contents by selecting it. When viewing reports, it is possible to expand specific items such as the report summary, diagnostic results, or CPU for additional information. This is shown in the System Performance Monitor Report in Figure 32.13.
Viewing Predefined System Reports
Another option for assessing system health and troubleshooting system anomalies is to leverage the predefined system reports. To view these system reports, follow these steps:
1. In the Performance Monitor navigation tree, expand the Data Collector Sets folder and then System.
2. Right-click one of the predefined data collector sets, such as System Diagnostics, and then click Start. This starts the data collection process.
3. Now expand the Reports folder, System, and then System Diagnostics.
4. Highlight the newly created report and review the contents of the report in the central details pane.
NOTE
The report generates and appears when the data collection process is complete. The report is automatically tagged with the current date.
Resource Monitor
Resource Monitor’s functionality remains unchanged from past Windows Server versions, providing real-time data about the core components of your server: CPU, disk, network, and memory. This allows for monitoring health and performance, identifying utilization hogs, or making business decisions, including increasing or decreasing resources as needed, resuming or suspending activities, utilizing a server for additional roles, and setting up firewall rules based on network activities (see Figure 32.14).
![]() Resource Monitor can be invoked in any of the following ways:
Resource Monitor can be invoked in any of the following ways:
![]() Clicking Open Resource Monitor within the Performance tab of Task Manager
Clicking Open Resource Monitor within the Performance tab of Task Manager
![]() Clicking Resource Monitor from the Tools link within the new Server Manager
Clicking Resource Monitor from the Tools link within the new Server Manager
![]() Typing ResMon at the command prompt or in the Run window
Typing ResMon at the command prompt or in the Run window
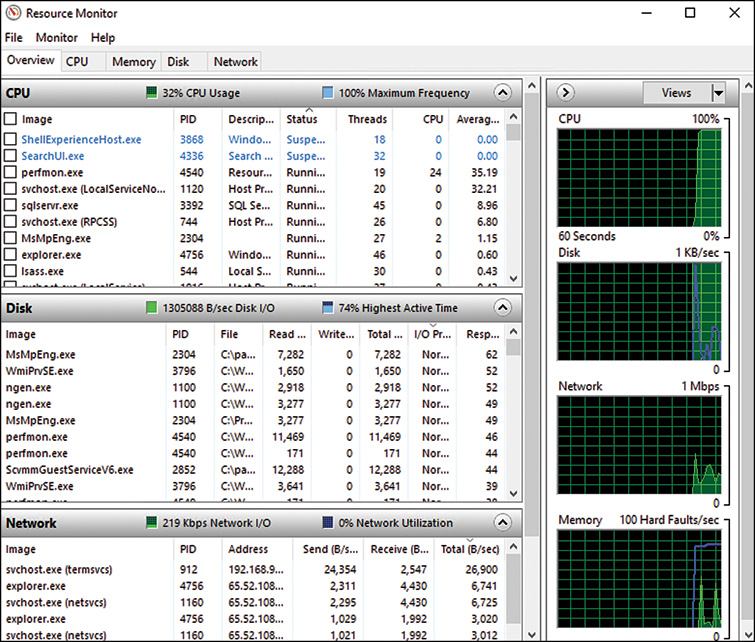
Overview Tab
The Overview tab hosts CPU, disk, network, and memory details and graphs. Of note is that not only is the current information shown, but maximum frequency (CPU) for the system overall and average CPU utilization for each process is listed. This allows for more a real-time, yet more relevant view of utilization.
TIP
To filter on a specific process or processes, simply choose the check mark in the Image column (under the CPU header). All Disk, network, and memory details will be limited to the selected processes. This option carries over to the other tabs.
Although not as complete as specific properties in Performance Manager, you can watch Resource Monitor before making changes to investigate the high level, yet core impact experienced during or after the change.
Using the information in the Overview screen to identify a potential issue, you can then proceed to the related Tab for further analysis and troubleshooting.
CPU Tab
The CPU tab provides CPU-related information about processes, services, associated handles, and associated module sections. After taking a look at this tab in Figure 32.15, let’s review the details behind each section and the information it provides.
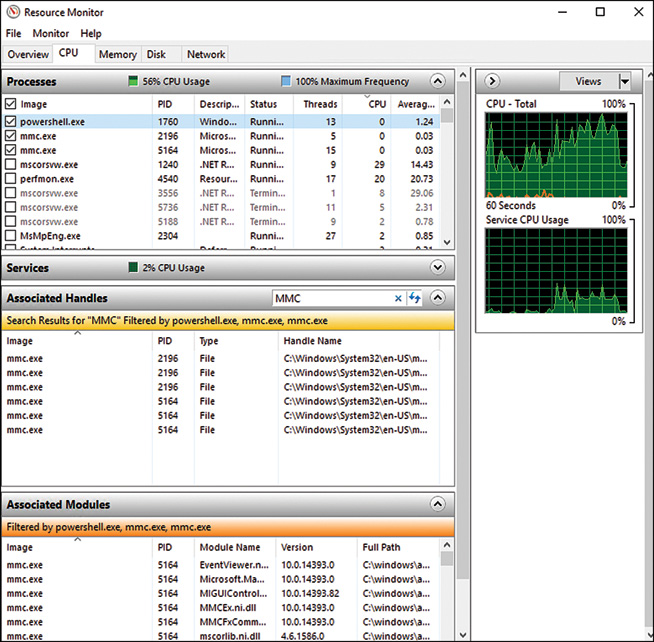
Processes
This section lists any process actively running and consuming CPU resources.
TIP
In the Processes section, you can right-click and choose End Task.
![]() Image—Filename.exe of each process
Image—Filename.exe of each process
![]() PID—Process ID of each associated process, which can be used to identify the process in Task Manager, other tools, or even the command line
PID—Process ID of each associated process, which can be used to identify the process in Task Manager, other tools, or even the command line
![]() Description—The file description that can be found by checking the properties of the EXE
Description—The file description that can be found by checking the properties of the EXE
![]() Status—Shows whether a process is running or terminated
Status—Shows whether a process is running or terminated
![]() Threads—Number of processor instances
Threads—Number of processor instances
![]() CPU—Current CPU utilization percent for a given process
CPU—Current CPU utilization percent for a given process
![]() Average CPU—Average CPU utilization percent over 60 seconds for a given process
Average CPU—Average CPU utilization percent over 60 seconds for a given process
Services
This section lists any services actively running and consuming CPU resources.
TIP
In the Services section, you can right-click and choose Start/Stop/Restart Services.
![]() Name—Name of service
Name—Name of service
![]() PID—Process ID of each associated process, which can be used to identify the process in Task Manager, other tools, or even the command line
PID—Process ID of each associated process, which can be used to identify the process in Task Manager, other tools, or even the command line
![]() Description—The service description
Description—The service description
![]() Status—Shows whether a process is running or terminated
Status—Shows whether a process is running or terminated
![]() Group—Group of Services running together
Group—Group of Services running together
![]() CPU—Current CPU utilization percent for a given process
CPU—Current CPU utilization percent for a given process
![]() Average CPU—Average CPU utilization percent over 60 seconds for a given process
Average CPU—Average CPU utilization percent over 60 seconds for a given process
Associated Handles
This section lists associated pointers to files, regkeys, directories, events, sections, and so on. When an application calls the appropriate API to create or open a resource, it is allocated a handle.
TIP
In the Search Handles box, type the name of the file/path to file and a list of processes with associated handles are listed.
Why is this information useful? With the type and handle name provided, you can check applications against handle leaks, paged pool, and so on. This information is also useful in determining when an item needs to be updated, but is seen as “in use.”
Associated Modules
In this section, modules, including dynamic link libraries (DLLs), system files, and .exe files, are referenced and used by processes to perform a function:
![]() Image—Name of service
Image—Name of service
![]() PID—Process ID of each associated process, which can be used to identify the process in Task Manager, other tools, or even the command line
PID—Process ID of each associated process, which can be used to identify the process in Task Manager, other tools, or even the command line
![]() Module Name—Name of the module used by a given process
Module Name—Name of the module used by a given process
![]() Version—The version number of the associated module
Version—The version number of the associated module
![]() Full Path—The full path to the module in use
Full Path—The full path to the module in use
Why is this information useful? With the version number, you can see the effects of a hotfix or other patch that intends to update a module. By sorting on Full Path, various processes can be identified as running the same module (DLL, for example).
Graphs
On the right, you see CPU-specific graphs:
![]() CPU-Total—Shows an overall utilization
CPU-Total—Shows an overall utilization
![]() Service CPU Usage—Shows background processes’ utilization
Service CPU Usage—Shows background processes’ utilization
![]() CPU 0-CPU 7—Shows utilization on a per core basis
CPU 0-CPU 7—Shows utilization on a per core basis
Memory Tab
The Memory tab provides memory-related information about Processes and Physical Memory sections. After taking a look at this tab in Figure 32.16, review the details behind each section and the information it provides.
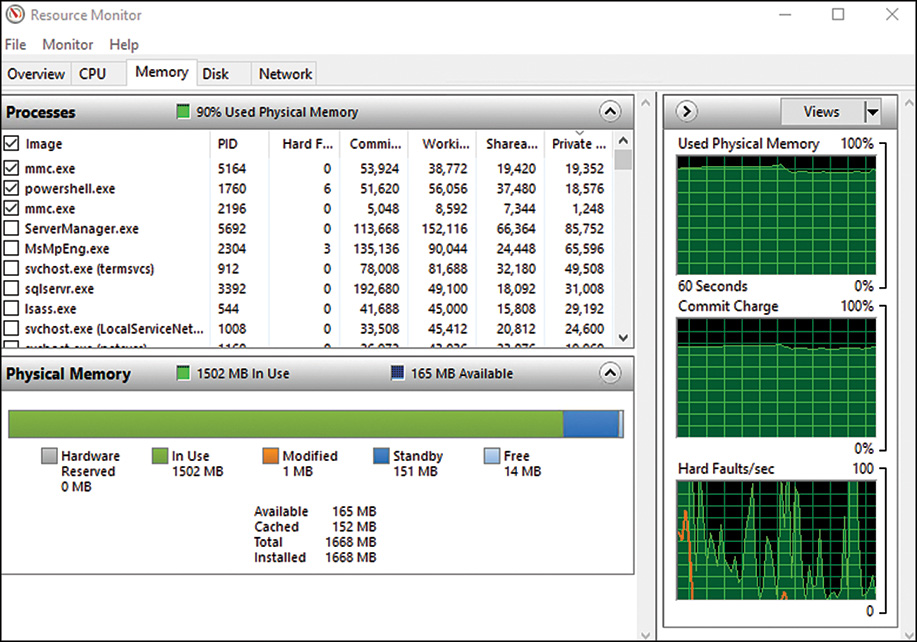
Processes
This section displays the following information about all running processes:
![]() Image—Filename.exe of each process
Image—Filename.exe of each process
![]() PID—Process ID of each process, which can be used to identify the process in Task
PID—Process ID of each process, which can be used to identify the process in Task
![]() Manager, other tools, or even the command line
Manager, other tools, or even the command line
![]() Hard Faults/sec—Number of instances per second when information has been retrieve from disk-based virtual memory rather than RAM
Hard Faults/sec—Number of instances per second when information has been retrieve from disk-based virtual memory rather than RAM
![]() Commit (KB)—Total amount of memory (physical and virtual) committed to a process
Commit (KB)—Total amount of memory (physical and virtual) committed to a process
![]() Working Set (KB)—Total amount of physical memory (shareable and private) committed to a process
Working Set (KB)—Total amount of physical memory (shareable and private) committed to a process
![]() Shareable (KB)—Total amount of physical memory committed to a process (shareable by another process)
Shareable (KB)—Total amount of physical memory committed to a process (shareable by another process)
![]() Private (KB)—Total amount of physical memory committed to a process (not shareable by another process)
Private (KB)—Total amount of physical memory committed to a process (not shareable by another process)
Physical Memory
A variety of system statistics about memory usage are displayed in this section:
![]() Hardware Reserved—Total memory reserved by various hardware devices on the server
Hardware Reserved—Total memory reserved by various hardware devices on the server
![]() In Use—Total current physical memory used
In Use—Total current physical memory used
![]() Modified—Modified pages that have not yet been released
Modified—Modified pages that have not yet been released
![]() Standby—Cached data that is not actively in use, but readily available if called
Standby—Cached data that is not actively in use, but readily available if called
![]() Free—Total physical memory that is available, but not in use, modified, or in standby
Free—Total physical memory that is available, but not in use, modified, or in standby
![]() Available—Total physical memory that is available, including in use, modified, or in standby
Available—Total physical memory that is available, including in use, modified, or in standby
![]() Cached—Modified and standby combined
Cached—Modified and standby combined
Why is this information useful? Persistent high numbers in the Hard Faults/sec column suggests a need for additional physical RAM. However, if the amount of cached memory is high, but the hard faults remain low, applications may very well be designed to cache a high percentage of free memory for better performance.
Disk Tab
The Disk tab provides disk-related information about Processes with Disk Activity, Disk Activity, and Storage sections. After taking a look at this tab in Figure 32.17, review the details behind each section and the information it provides.

Processes with Disk Activity
This section provides a list of processes that are currently running and showing disk resource usage:
![]() Name—Name of process
Name—Name of process
![]() PID—Process ID of each associated process, which can be used to identify the process in Task Manager, other tools, or even the command line
PID—Process ID of each associated process, which can be used to identify the process in Task Manager, other tools, or even the command line
![]() Read (B/sec)—Average bytes/sec read by the process over the past 60 seconds
Read (B/sec)—Average bytes/sec read by the process over the past 60 seconds
![]() Write (B/sec)—Average bytes/sec written by the process over the past 60 seconds
Write (B/sec)—Average bytes/sec written by the process over the past 60 seconds
![]() Total (B/sec)—Read (B/sec) + Write (B/sec)
Total (B/sec)—Read (B/sec) + Write (B/sec)
Why is this information useful? Look for applications/processes that generate a lot of disk activity and ensure that the activity is expected.
Disk Activity
This section provides a list of files, I/O priority, and response time per process:
![]() Name—Name of process
Name—Name of process
![]() PID—Process ID of each associated process, which can be used to identify the process in Task Manager, other tools, or even the command line
PID—Process ID of each associated process, which can be used to identify the process in Task Manager, other tools, or even the command line
![]() File—Full path to file used by specified process
File—Full path to file used by specified process
![]() I/O Priority—Priority of I/O for specified process
I/O Priority—Priority of I/O for specified process
![]() Response Time (ms)—Disk response time in milliseconds
Response Time (ms)—Disk response time in milliseconds
Why is this information useful? Look at the response times and ensure that the numbers are below 15ms for good responses; higher numbers mean degraded performance. I/O numbers may be indicate a need for disk changes or might indicate an effect of other issues such as CPU overutilization and request delays.
TIP
The following are expected response time examples (in milliseconds) based on disk type:
![]() 7200 RPM HD @ 13ms
7200 RPM HD @ 13ms
![]() 10K RPM HD @ 8ms
10K RPM HD @ 8ms
![]() 15K RPM HD @ 7ms
15K RPM HD @ 7ms
![]() Solid state drive @ 0.2ms
Solid state drive @ 0.2ms
Storage
This section displays the following information about each fixed disk:
![]() Logical Disk—The drive letter associated a given drive
Logical Disk—The drive letter associated a given drive
![]() Physical Disk—The system number associated to a given drive
Physical Disk—The system number associated to a given drive
![]() Active Time (%)—Percentage of time that the disk is active
Active Time (%)—Percentage of time that the disk is active
![]() Available Space (MB)—Available space for a given driven
Available Space (MB)—Available space for a given driven
![]() Total Space (MB)—Total size of given drive
Total Space (MB)—Total size of given drive
![]() Disk Queue Length—Number of pending/waiting requests
Disk Queue Length—Number of pending/waiting requests
Why is this information useful? High Active Time (over 75%) and/or High Disk Queue Length (one to two times the number of disks) may indicate a need for faster disk to support an I/O activity-hungry application.
![]() Disk—Transfer speeds between system and disk
Disk—Transfer speeds between system and disk
![]() Disk 0 (C:) Queue Length—A series of graphs presenting queue length on a per disk basis
Disk 0 (C:) Queue Length—A series of graphs presenting queue length on a per disk basis
Network Tab
The Network tab provides network-related information about processes with Network Activity, Network Activity, TCP Connections, and Listening Ports sections. After taking a look at this tab in Figure 32.18, review the details behind each section and the information it provides.
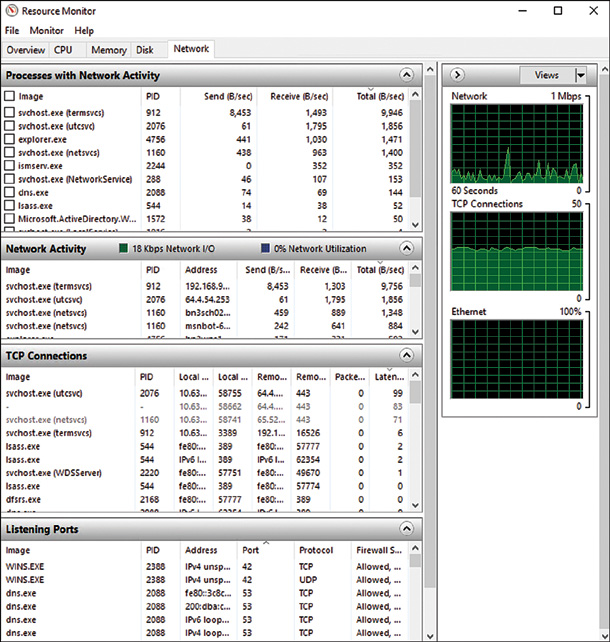
Processes with Network Activity and Network Activity
These sections provide useful information for running processes:
![]() Image—Name of process
Image—Name of process
![]() PID—Process ID of each associated process, which can be used to identify the process in Task Manager, other tools, or even the command line
PID—Process ID of each associated process, which can be used to identify the process in Task Manager, other tools, or even the command line
![]() Address (Network Activity section only)—Name or IP address to which the process is connected
Address (Network Activity section only)—Name or IP address to which the process is connected
![]() Send (B/sec)—Average bytes/sec sent over the network by the process over the past 60 seconds
Send (B/sec)—Average bytes/sec sent over the network by the process over the past 60 seconds
![]() Receive (B/sec)—Average bytes/sec received over the network by the process over the past 60 seconds
Receive (B/sec)—Average bytes/sec received over the network by the process over the past 60 seconds
![]() Total (B/sec)—Send (B/sec) + Receive (B/sec)
Total (B/sec)—Send (B/sec) + Receive (B/sec)
TIP
Note the little graphs in the Network Activity section: Kbps Network I/O (Total I/O Activity on the Network) and % Network Utilization (Total Percentage Utilized). The graphs are extremely useful in that they provide the size of network activity and the percentage of network utilization. Even if high usage is anticipated, constant high utilization may indicate a bottleneck.
TCP Connections
This extremely useful section shows information such as the following about all open TCP connections and the process that opened the connection:
![]() Image—Name of process
Image—Name of process
![]() PID—Process ID of each associated process, which can be used to identify the process in Task Manager, other tools, or even the command line
PID—Process ID of each associated process, which can be used to identify the process in Task Manager, other tools, or even the command line
![]() Local Address—Local address of the connection (one of the local NICs)
Local Address—Local address of the connection (one of the local NICs)
![]() Local Port—Local port of the connection (one of the local NICs)
Local Port—Local port of the connection (one of the local NICs)
![]() Remote Address—Remote address of the connection
Remote Address—Remote address of the connection
![]() Remote Port—Remote port of the connection
Remote Port—Remote port of the connection
![]() Packet Loss (%)—Percent of packets lost
Packet Loss (%)—Percent of packets lost
![]() Latency (ms)—Round-trip latency measuring time it takes for a packet to travel
Latency (ms)—Round-trip latency measuring time it takes for a packet to travel
Why is this information useful? High packet loss or latency indicates performance issues that should be looked into, especially for live communication traffic such as VoIP.
![]() Image—Name of process
Image—Name of process
![]() PID—Process ID of each associated process, which can be used to identify the process in Task Manager, other tools, or even the command line
PID—Process ID of each associated process, which can be used to identify the process in Task Manager, other tools, or even the command line
![]() Address—Listed here if an address is not specified for a given process
Address—Listed here if an address is not specified for a given process
![]() Protocol—TCP (Transmission Control Protocol) or UDP (User Datagram Protocol)
Protocol—TCP (Transmission Control Protocol) or UDP (User Datagram Protocol)
![]() Firewall Status—Identifies whether traffic is not allowed or is restricted by Windows Firewall
Firewall Status—Identifies whether traffic is not allowed or is restricted by Windows Firewall
Related PowerShell Functionality
As discussed, Resource Monitor provides lists and graphical representations of various counters. Here are some ways to go about similar tasks with PowerShell:
Get-Counter
The Get-Counter cmdlet returns performance counter data from a specified computer (local or remote).
Description
The cmdlet returns real-time performance counter data directly from the operating system’s performance monitoring components. It can be used to get performance data from any computer as long as access and credentials are available. The command can specify the sample interval and can therefore be used to create a rudimentary monitoring tool for troubleshooting purposes.
Without parameters, the Get-Counter cmdlet returns counter data for a default set of system counters. The parameters can be used not only to direct the command to a specific computer but also to specify the required counters.
Examples
Get-Counter
What it does: Returns the values of a set of default counters on the local computer.
Get-Counter 'MemoryAvailable MBytes'
What it does: Returns the specified counter—current available memory in MB on the local computer.
Get-Counter “\ABCDC1Processor(_Total)\% Processor Time”–SampleInterval 10
–MaxSamples 5
What it does: Returns the CPU utilization counter on the specified computer (local or remote) every ten seconds until it has five returned values.
$diskreads = “LogicalDisk(C:)Disk Writes/sec”
$diskreads | get-counter -computer abcdc1, abcdc2 -maxsamples 10
What it does: Returns ten samples of the Disk Writes/sec counter from the two listed servers.
Server Manager
Having looked at Task Manager, Event Viewer, Performance Monitor, command-line debugging tools, and various aspects of each, we have noted that it’s feasible to connect remotely with most tools, and it’s preferred to do so in the interest of reducing overhead. With this in mind, look at Server Manager, which not only serves as a central repository to call many of logging and debugging tools, but also allows us to do access servers remotely and collectively.
Server Manager has additional functions discussed in this book that can be used for the control and configuration of the enterprise, allowing manageability of grouped servers.
Server Manager can be installed on an administrator’s desktop and utilized in the same manner as when used locally on a server:
![]() Add servers or custom groups
Add servers or custom groups
![]() Get status of servers, groups or roles
Get status of servers, groups or roles
![]() Manage groups of servers simultaneously (adding/removing roles and features)
Manage groups of servers simultaneously (adding/removing roles and features)
Server Manager opens up at logon (by default), can be called by typing Server Manager in the Metro start screen, or by entering servermanager.exe from the Run prompt or command prompt.
On opening, Server Manager loads to the Dashboard screen where you can see red item counts on manageability, events, service, performance, and BPA results for local servers or server group.
To best make use of the Dashboard, server groups should be composed of the servers you monitor, in groupings that make sense for your role.
To create a server group, click Manage in the top menu, and choose Create Server Group from the drop-down menu. The Create Server Group screen pops up. First, simply enter a name for the server group. Then, choose a server from the list already present under the Server Pool tab, by browsing Active Directory, by entering a name or IP address under the DNS tab, or by using a list of servers in a text file under the Import tab (or a combination of all four). In Figure 32.19, we’re importing a text file of server names. Select any servers on the frame on the left that you want to add to the server group, and then click the arrow to bring them to the right frame. When you have a complete list of selected computers on the frame on the right, just click OK.
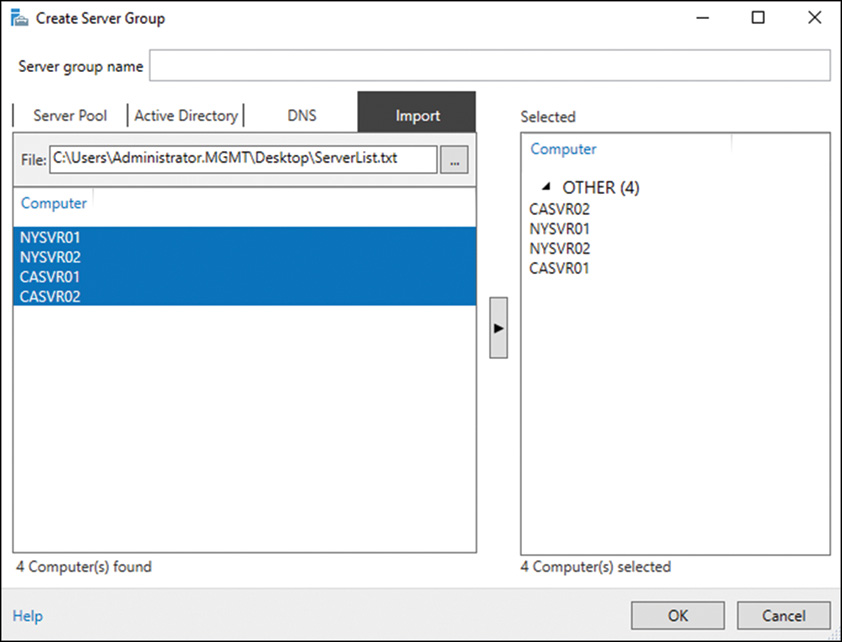
The Import Wizard is intelligent enough to skip duplicate servers. Even though we listed NYCDM01 twice in our text file, only one was added to the selected computer list.
As shown on the frame on the left in Figure 32.19, we’ve created three examples: SQL Servers 2016 (based on role and functionality), Walnut Creek Servers (based on location and security), and YSA Servers (consisting of a couple of servers that serve as a backend to our YSA application).
Clicking any of our server groups provides a centralized view, capturing Events, Services, Best Practices Analyzer results, Performance Alerts, and Roles & Features for the selected server in the group, as shown in Figure 32.20.
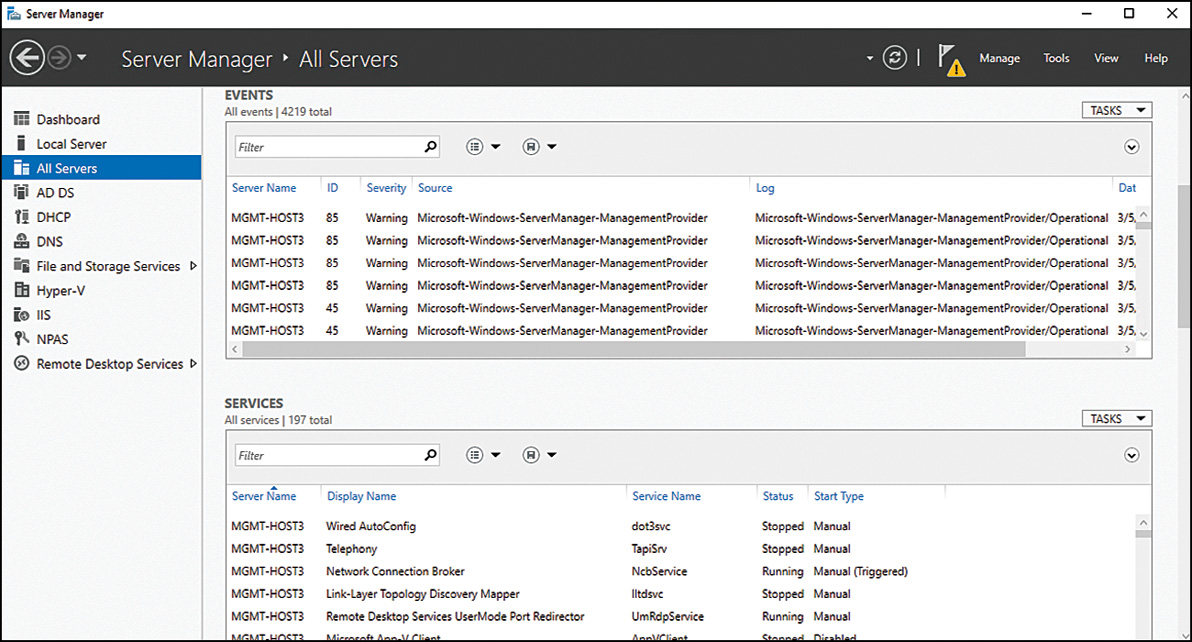
TIP
Right-clicking a server provides you several interactive options, including the ability to call Computer Manager, call PowerShell, or restart the server.
Clicking the Tasks drop-down menu above each section provides some configuration options. For example, the Performance Tasks menu shows Configure Performance Alerts, bringing the option to define performance alert thresholds.
The YSA Servers (consisting of a couple of servers that serve as a backend to our YSA application): The YSA application is CPU-use intensive, so while we leave the default alerting on both CPU and memory in place, we increased the alert level for CPU from the default 85% to 95%, as shown in Figure 32.21.

Dashboard View
Back in the top choice in the left frame (our Dashboard view, shown in Figure 32.22), we go on to view alerts and customize the alerts shown/counted for each server group.
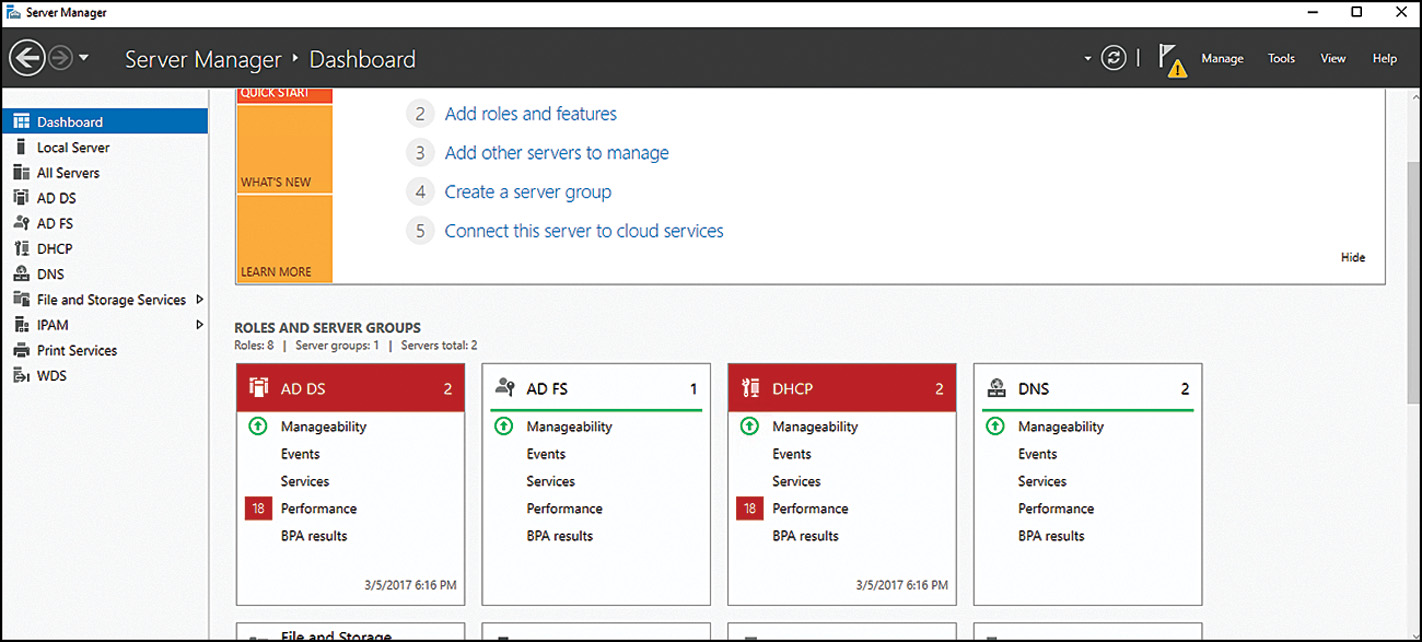
Some of the categories of alerts are as follows:
![]() Events alerts
Events alerts
![]() Manageability alerts
Manageability alerts
![]() Services alerts
Services alerts
![]() Performance alerts
Performance alerts
![]() BPA results
BPA results
Events Alerts
A noninteractive look at events on monitored services, this is a complement to Event Viewer and Subscriptions discussed earlier in this chapter.
SQL Servers 2016 (based on role and functionality): Because we have monitoring tools capturing additional details on these servers, our Dashboard is filtered for this server group to report on SQL-specific event IDs only within Events (for high-level support when a systems administrator is backing up our SQL administrator).
Clicking the word Events underneath the SQL Server 2016 Dashboard widget brings up the option to specify event IDs, as shown in Figure 32.23. Also, the current alerts, if any, are listed at the bottom of the screen.

Manageability Alerts
Manageability alerts cover the general inability to access and manage a remote server. Figure 32.24 shows the default filtered selections, which include missing components, unsupported operating systems, concerns with credentials, connectivity concerns, and unknown errors. These filters can be configured differently for each monitored server group.
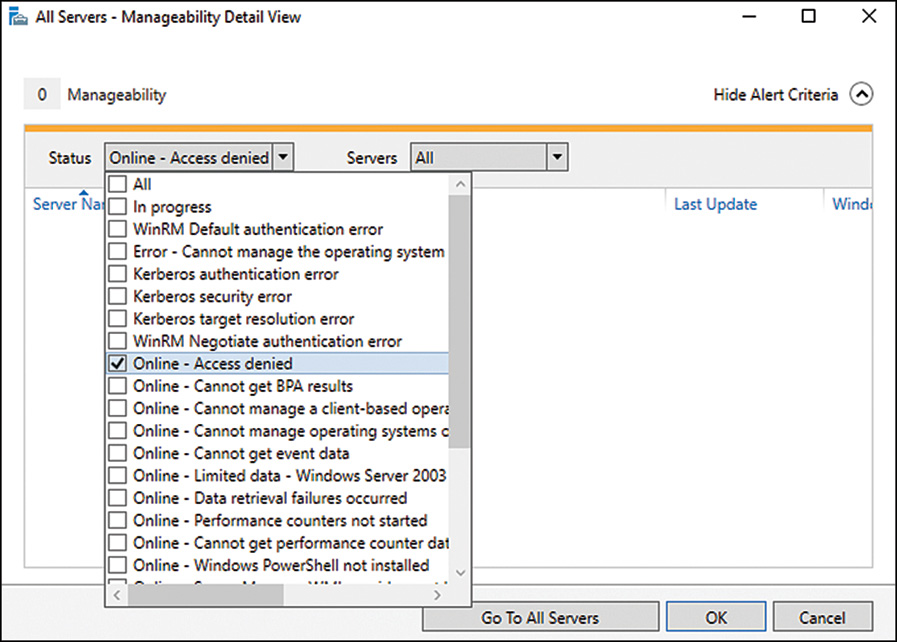
Walnut Creek Servers (based on location and security): The dashboard is configured only to capture Credentials Not Valid status within Manageability. These servers are on a DMZ with intentional safeguards that prevent elevated permissions. The accounts used to manage the Walnut Creek Servers are used for specific connectivity through homegrown apps, which require user manual input. By monitoring the credentials, we can confirm that the servers are online and the accounts are valid.
Clicking the word Manageability underneath the Walnut Creek Servers widget, we have the option to filter on specific statuses, similar to what was shown in Figure 32.24. Also, the current alerts, if any, are listed at the bottom of the screen.
Looking at our SQL Servers 2016 Server Group, we see a red 2 next to Manageability Alerts. Clicking the 2 brings us to a detailed view explaining these alerts. It appears that we have invalid credentials on one server and an unknown error on another. Right-clicking an alert brings us to a menu of tools to address the concerns. In our example, one alert is addressed by providing alternate credentials using the Manage As option, shown in Figure 32.25; the other required a firewall change, which was configured remotely using the Windows PowerShell option.
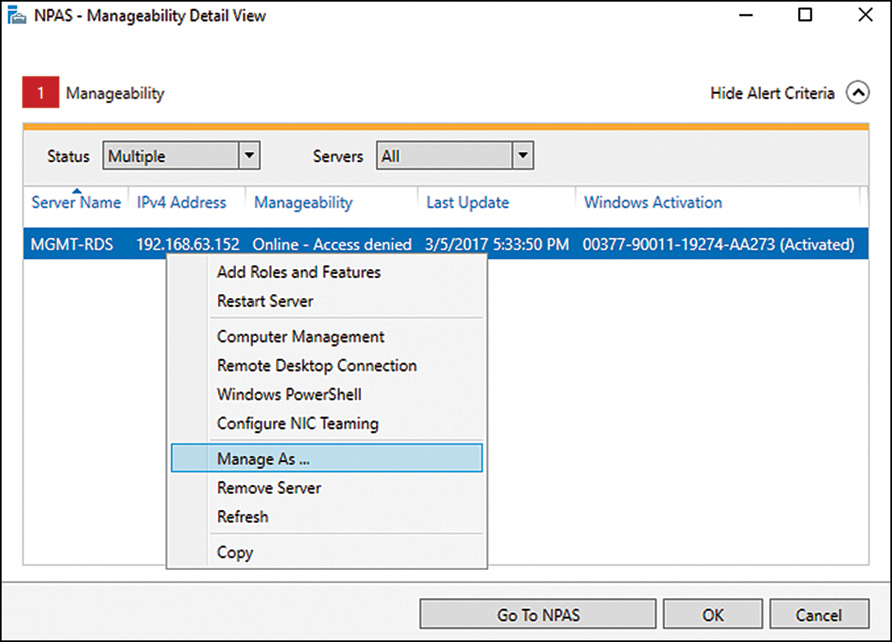
Services Alerts
As its name implies, this section provides a look at the service status. This view can be filtered to show alerts for any combination of specific services, specific servers, specific startup types (automatic/delayed start, automatic, manual, restart, system, disabled, unknown), and/or specific service status (resume pending, start pending, stop pending, stopped, pause pending, or paused). By default, the Dashboard alerts on automatic/delayed start and automatic services only.
The Services Detail view also has the added functionality of directly interacting with a service, to start, stop, restart, pause or resume it, as desired, simply by right-clicking an alert and choosing to do so (see Figure 32.26).

Performance Alerts
This section raises alerts on the basis of CPU utilization (%) and Memory (MB available). As discussed earlier, default thresholds are 85% and 512MB. Filtering here allows you to monitor CPU, memory, or both (default). You also have the option to turn off performance alerts.
Clicking the word Performance underneath a given server group allows you to make these decisions. Also, the current alerts, if any, are listed at the bottom of the screen.
In Performance Detail view, you also have the option to right-click and choose View Details. This brings up the alert and a list of services at the bottom of the screen, each identified with PID and utilization, as shown in Figure 32.27.
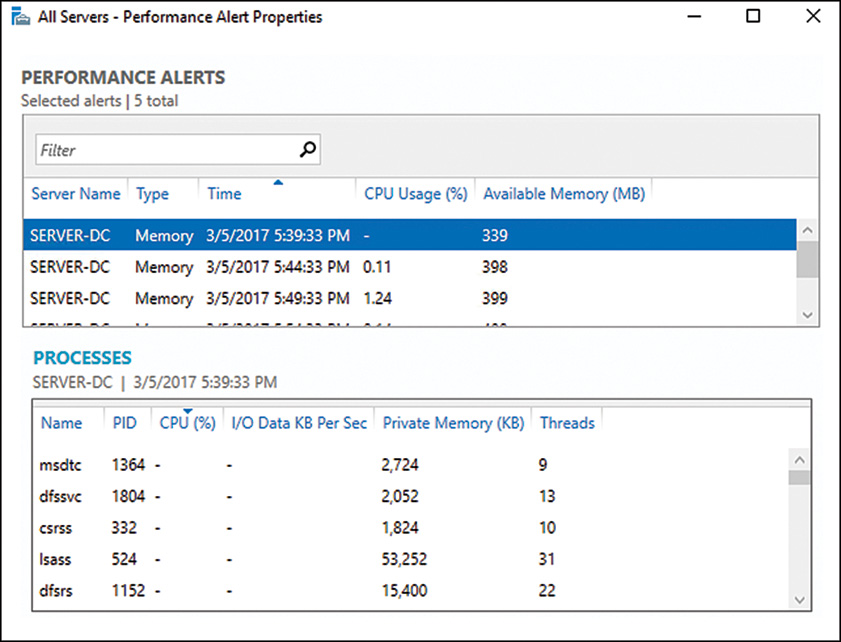
BPA Results
These alerts display only if a Best Practices Analyzer (BPA) scan has been executed. The alerts are informational, warning, and error. Only errors are alerted on in the default filter.
It is worth noting that a direct link exists within Server Manager to a number of tools. The Tools menu in the top menu includes shortcuts to Computer Manager, Event Viewer, Performance Monitor, Resource Monitor, Services, Task Scheduler, and PowerShell, as shown in Figure 32.28.

Setting Baseline Values
A baseline is a performance level that can be used as a starting point to compare against future network performance operations. When a server is first monitored, there is very little to compare the statistics against. After a baseline is created, information can be gathered at any time in the future and compared against the baseline. The difference between the current statistics and the baseline statistics is the variance caused by system load, application processing, or system performance contention.
To be able to set a baseline value, you need to gather a normal set of statistics on each system that will eventually be monitored or managed in the future. Baselines should be created for normal and stressed times. The workload on a machine at night when there are fewer users connected to it provides a poor baseline to compare real-time data in the middle of the day. Information sampled in the middle of the day should be compared with a baseline of information collected at around the same time of day during normal load prior to the sample comparison.
Creating baselines should be an ongoing process. If an application or a new service is added to a server, a new baseline should be created so that any future comparisons can be made with a baseline with the most current status of system performance.
Reducing Performance Monitoring Overhead
Performance monitoring uses system resources that can affect the performance of a system as well as affect the data being collected. To ensure that performance monitoring and analyzing do not affect the machines being monitored themselves, you need to decrease the impact of performance monitoring. Some steps can be taken to ensure that performance monitoring overhead is kept to a minimum on the server being monitored to create as accurate of an analysis on a system as possible:
![]() Use a remote server to monitor the target server. Servers can actually be dedicated to monitoring several remote servers. Although this might also lead to an increase in network bandwidth, at least the monitoring and tracking of information do not drastically degrade CPU or disk I/O as if the monitoring tool were actually running on the server being monitored.
Use a remote server to monitor the target server. Servers can actually be dedicated to monitoring several remote servers. Although this might also lead to an increase in network bandwidth, at least the monitoring and tracking of information do not drastically degrade CPU or disk I/O as if the monitoring tool were actually running on the server being monitored.
![]() Consider reducing the frequency of the data collection interval because more frequent collection can increase overhead on the server.
Consider reducing the frequency of the data collection interval because more frequent collection can increase overhead on the server.
![]() Avoid using too many counters. Some counters are costly in terms of taxing a server for system resources and can increase system overhead. Monitoring several activities at one time also becomes difficult.
Avoid using too many counters. Some counters are costly in terms of taxing a server for system resources and can increase system overhead. Monitoring several activities at one time also becomes difficult.
![]() Use logs instead of displaying graphs. The logs can then be imported into a database or report. Logs can be saved on hard disks not being monitored or analyzed.
Use logs instead of displaying graphs. The logs can then be imported into a database or report. Logs can be saved on hard disks not being monitored or analyzed.
Important Objects to Monitor
The numbers of system and application components, services, and threads to measure in Windows Server 2016 are so extensive that it is impossible to monitor thousands of processor, print queue, network, or storage usage statistics. Defining the roles a server plays in a network environment helps to narrow down what needs to be measured. Servers could be defined and categorized based on the function of the server, such as application server, file and print server, or services server such as DNS (Domain Name Server), domain controller, and so on.
Because servers perform different roles, and hence have different functions, it makes sense to monitor the essential performance objects. This helps prevent the server from being overwhelmed from the monitoring of unnecessary objects for measurement or analysis.
Overall, four major areas demand the most concern: memory, processor, disk subsystem, and network infrastructure. They all tie into any role the server plays.
The following list describes objects to monitor based on the roles played by the server:
![]() Active Directory Domain Services—Because the DC provides authentication, stores the Active Directory database, holds schema objects, and so on, it receives many requests. To be able to process all these requests, it uses up a lot of CPU resources, disks, memory, and network bandwidth. Consider monitoring memory, CPU, system, network segment, network interface, and protocol objects such as TCP, UDP, NBT, NetBIOS, and NetBEUI. Also worth monitoring are the Active Directory NTDS service and site server Lightweight Directory Access Protocol (LDAP) service objects. DNS and WINS also have applicable objects to be measured.
Active Directory Domain Services—Because the DC provides authentication, stores the Active Directory database, holds schema objects, and so on, it receives many requests. To be able to process all these requests, it uses up a lot of CPU resources, disks, memory, and network bandwidth. Consider monitoring memory, CPU, system, network segment, network interface, and protocol objects such as TCP, UDP, NBT, NetBIOS, and NetBEUI. Also worth monitoring are the Active Directory NTDS service and site server Lightweight Directory Access Protocol (LDAP) service objects. DNS and WINS also have applicable objects to be measured.
![]() File and print server—The print servers that process intensive graphics jobs can utilize extensive resources of system CPU cycles very quickly. The file server takes up a lot of storage space. Monitor the PrintQueue object to track print spooling data. Also monitor CPU, memory, network segment, and logical and physical disks for both file and print data collection.
File and print server—The print servers that process intensive graphics jobs can utilize extensive resources of system CPU cycles very quickly. The file server takes up a lot of storage space. Monitor the PrintQueue object to track print spooling data. Also monitor CPU, memory, network segment, and logical and physical disks for both file and print data collection.
![]() Messaging collaboration server—A messaging server such as an Exchange Server 2010 uses a lot of CPU, disk, and memory resources. Monitor memory collection, cache, processor, system, and logical and physical disks. Exchange objects are added to the list of objects after Exchange is installed, such as message queue length or name resolution response time.
Messaging collaboration server—A messaging server such as an Exchange Server 2010 uses a lot of CPU, disk, and memory resources. Monitor memory collection, cache, processor, system, and logical and physical disks. Exchange objects are added to the list of objects after Exchange is installed, such as message queue length or name resolution response time.
![]() Web server—A web server is usually far less disk-intensive and more dependent on processing performance or memory space to cache web pages and page requests. Consider monitoring the cache, network interface, processor, and memory usage.
Web server—A web server is usually far less disk-intensive and more dependent on processing performance or memory space to cache web pages and page requests. Consider monitoring the cache, network interface, processor, and memory usage.
![]() Database server—Database servers such as Microsoft SQL Server 2016 can use a lot of CPU and disk resources. Database servers can also use an extensive amount of memory to cache tables and data, so RAM usage and query response times should be monitored. Monitoring objects such as system, processor, logical disk, and physical disk is helpful for overall system performance operations.
Database server—Database servers such as Microsoft SQL Server 2016 can use a lot of CPU and disk resources. Database servers can also use an extensive amount of memory to cache tables and data, so RAM usage and query response times should be monitored. Monitoring objects such as system, processor, logical disk, and physical disk is helpful for overall system performance operations.
Using the Debugging Tools Available in Windows Server 2016
Several useful tools are available in Windows Server 2016 for troubleshooting and diagnosing various problems, ranging from TCP/IP connection issues to verification and maintenance issues. These tools also make it much easier for IT professionals and administrators, allowing IT personnel to focus on business improvement tasks and functions, not on simply running specific tools in the networking environment.
Best Practices Analyzer Tools
Many years ago, Microsoft introduced Best Practices Analyzer (BPA) tools for server products such as SQL Server and Exchange. The tools enabled IT professionals to conduct a scan against a product to ensure it was configured based on industry best practices. For many years, IT professionals wanted a similar tool to scan their Windows infrastructure; however, one did not exist. Windows Server 2008 R2 introduced a BPA tool, which is included with all editions of Windows Server 2016 except for Server Core. When scanning server roles to find best-practice violations, the BPA tool measures a server role’s compliance based on eight different rule categories. The rule categories are Security, Performance, Configuration, Policy, Operation, Predeployment, Postdeployment, and BPA Prerequisites. Compliance is measured based on three severity levels: Error, Warning, and Information. It is worth noting that only a select few server roles are supported with BPA.
NOTE
The Windows BPA tool should be run on a regular basis to alleviate incorrect configurations, poor performance, poor reliability, and security violations.
Follow these steps to launch the Best Practice Analyzer tool:
1. Open Server Manager from the taskbar.
2. From the left pane, select a server role view.
3. Scroll down to the Best Practice Analyzer section, and from the Tasks menu select Start BPA Scan.
4. From the Select Servers dialog, select the servers that should scanner for best-practice configuration for the selected role.
5. When the scan is complete, review the results in the same Best Practices Analyzer section, as displayed in Figure 32.29. Each result is categorized as Information, Warning, or Error.

When using the GUI to run a BPA scan, it is possible to filter the scan results using a variety of criteria. The common filter tools of Server Manager are available for the BPA GUI and can be used to include or exclude specific categories and severities among other fields.
TCP/IP Tools
TCP/IP forms the backbone of communication and transportation in Windows Server 2016. Before you can communicate between machines, TCP/IP must be configured.
In Windows Server 2016, TCP/IP is installed by default during the OS installation, which also makes it impossible to add or remove TCP/IP through the GUI.
If a TCP/IP connection fails, you need to determine the cause or point of failure. Windows Server 2016 includes some dependable and useful tools that can be used to troubleshoot connections and verify connectivity. The tools described in the following 10 subsections are very useful for debugging TCP/IP connectivity problems. Most of these tools have been updated to include switches for IPv4 and IPv6.
Ping
Ping means Packet Internet Groper. It is used to send an Internet Control Message Protocol (ICMP) echo request and echo reply to verify the availability of a local or remote machine. You can think of ping as a utility that sends a message to another machine asking, “Are you still there?” By default, in Windows Server 2016, ping sends out four ICMP packages and waits 1 second for responses back. However, the number of packages sent or time to wait for responses can be changed through the options available for ping.
Besides verifying the availability of a remote machine, ping can help determine a name-resolution problem.
To use ping, go to a command prompt and type Ping Targetname. Different parameters can be used with ping. To display them, type Ping /? or Ping (without parameters).
The parameters for the ping command are as follows:
![]() -4—Specifies that IPv4 is used to ping. This parameter is not required to identify the target host with an IPv4 address. It is required only to identify the target host by name.
-4—Specifies that IPv4 is used to ping. This parameter is not required to identify the target host with an IPv4 address. It is required only to identify the target host by name.
![]() -6—Specifies that IPv6 is used to ping. Just like -4, this parameter is not required to identify the target host with an IPv6 address. It is required only to identify the target host by name.
-6—Specifies that IPv6 is used to ping. Just like -4, this parameter is not required to identify the target host with an IPv6 address. It is required only to identify the target host by name.
![]() -a—Resolves the IP address to the hostname. The hostname of the target machine is displayed if this command is successful.
-a—Resolves the IP address to the hostname. The hostname of the target machine is displayed if this command is successful.
![]() -f—Requests that echo back messages are sent with the Don’t Fragment flag in packets. This parameter is available only in IPv4.
-f—Requests that echo back messages are sent with the Don’t Fragment flag in packets. This parameter is available only in IPv4.
![]() -i ttl—Increases the timeout on slow connections. The parameter also sets the value of the Time to Live (TTL). The maximum value is 255.
-i ttl—Increases the timeout on slow connections. The parameter also sets the value of the Time to Live (TTL). The maximum value is 255.
![]() -j HostList—Routes packets using the host list, which is a series of IP addresses separated by spaces. The host can be separated by intermediate gateways (loose source route).
-j HostList—Routes packets using the host list, which is a series of IP addresses separated by spaces. The host can be separated by intermediate gateways (loose source route).
![]() -k HostList—Similar to –j, but hosts cannot be separated by intermediate gateways (strict source route).
-k HostList—Similar to –j, but hosts cannot be separated by intermediate gateways (strict source route).
![]() -l size—Specifies the length of packets in bytes. The default is 32. The maximum size is 65,527.
-l size—Specifies the length of packets in bytes. The default is 32. The maximum size is 65,527.
![]() -n count—Specifies the number of packets sent. The default is 4.
-n count—Specifies the number of packets sent. The default is 4.
![]() -r count—Specifies the route of outgoing and incoming packets. It is possible to specify a count that is equal to or greater than the number of hops between the source and destination. The count can be between 1 and 9 only.
-r count—Specifies the route of outgoing and incoming packets. It is possible to specify a count that is equal to or greater than the number of hops between the source and destination. The count can be between 1 and 9 only.
![]() -R—Specifies that the round-trip path is traced (available on IPv6 only).
-R—Specifies that the round-trip path is traced (available on IPv6 only).
![]() -s count—Sets the time stamp for the number of hops specified by count. The count must be between 1 and 4.
-s count—Sets the time stamp for the number of hops specified by count. The count must be between 1 and 4.
![]() -S SrcAddr—Specifies the source address to use (available on IPv6 only).
-S SrcAddr—Specifies the source address to use (available on IPv6 only).
![]() -t—Specifies that ping should continue sending packets to the destination until interrupted. To stop and display statistics, press Ctrl+Break. To stop and quit ping, press Ctrl+C.
-t—Specifies that ping should continue sending packets to the destination until interrupted. To stop and display statistics, press Ctrl+Break. To stop and quit ping, press Ctrl+C.
![]() -v TOS—Specifies the value of the type of service in the packet sent. The default is zero. TOS is specified as a decimal value between 0 and 255.
-v TOS—Specifies the value of the type of service in the packet sent. The default is zero. TOS is specified as a decimal value between 0 and 255.
![]() -w timeout—Specifies the time in milliseconds for packet timeout. If a reply is not received within the timeout, the Request Timed Out error message is displayed. The default timeout is four seconds.
-w timeout—Specifies the time in milliseconds for packet timeout. If a reply is not received within the timeout, the Request Timed Out error message is displayed. The default timeout is four seconds.
![]() TargetName—Specifies the hostname or IP address of the destination to ping.
TargetName—Specifies the hostname or IP address of the destination to ping.
Some remote hosts can be configured to ignore ping traffic as a method of preventing acknowledgment as a security measure. Therefore, your inability to ping a server might not necessarily mean that the server is not operational, just that the server is not responding for some reason.
Tracert
Tracert is generally used to determine the route or path taken to a destination by sending ICMP packets with varying TTL values. Each router the packet meets on the way decreases the value of the TTL by at least one; invariably, the TTL is a hop count. The path is determined by checking the ICMP Time Exceeded messages returned by intermediate routers. Some routers do not return Time Exceeded messages for expired TTL values and are not captured by tracert. In such cases, asterisks are displayed for that hop.
To display the different parameters that can be used with tracert, open a command prompt and type tracert (without parameters) to display help or type tracert /?. The parameters associated with tracert are as follows:
![]() -4—Specifies that tracert.exe can use only IPv4 for the trace.
-4—Specifies that tracert.exe can use only IPv4 for the trace.
![]() -6—Specifies that tracert.exe can use only IPv6 for the trace.
-6—Specifies that tracert.exe can use only IPv6 for the trace.
![]() -d—Prevents resolution of IP addresses of routers to their hostname. This is particularly useful for speeding up results of tracert.
-d—Prevents resolution of IP addresses of routers to their hostname. This is particularly useful for speeding up results of tracert.
![]() -h maximumHops—Specifies the maximum number of hops to take before reaching the destination. The default is 30 hops.
-h maximumHops—Specifies the maximum number of hops to take before reaching the destination. The default is 30 hops.
![]() -j HostList—Specifies that packets use the loose source route option. Loose source routing allows successive intermediate destinations to be separated by one or multiple routers. The maximum number of addresses in the host list is nine. This parameter is useful only when tracing IPv4 addresses.
-j HostList—Specifies that packets use the loose source route option. Loose source routing allows successive intermediate destinations to be separated by one or multiple routers. The maximum number of addresses in the host list is nine. This parameter is useful only when tracing IPv4 addresses.
![]() -R—Sends packets to a destination in IPv6, using the destination as an intermediate destination and testing reverse route.
-R—Sends packets to a destination in IPv6, using the destination as an intermediate destination and testing reverse route.
![]() -S—Specifies the source address to use. This parameter is useful only when tracing IPv6 addresses.
-S—Specifies the source address to use. This parameter is useful only when tracing IPv6 addresses.
![]() -w timeout—Specifies the time in milliseconds to wait for each reply.
-w timeout—Specifies the time in milliseconds to wait for each reply.
NOTE
Tracert is a good utility to determine the number of hops and the latency of communications between two points. Even if an organization has an extremely high-speed connection to the Internet, if the Internet is congested or if the route a packet must follow requires forwarding the information between several routers along the way, the performance and, ultimately, the latency (or delay in response between servers) will cause noticeable communications delays.
Pathping
Pathping is a route-tracing tool that combines both features of ping and tracert commands with some more information that neither of those two commands provides. Pathping is most ideal for a network with routers or multiple routes between the source and destination hosts. The Pathping command sends packets to each router on its way to a destination, and then gets results from each packet returned from the router. Because Pathping computes the loss of packets from each hop, you can easily determine which router is causing a problem in the network.
To display the parameters in Pathping, open a command prompt and type Pathping /?. The parameters for the Pathping command are as follows:
![]() -4—Specifies that tracert.exe can use only IPv4 for the trace.
-4—Specifies that tracert.exe can use only IPv4 for the trace.
![]() -6—Specifies that tracert.exe can use only IPv6 for the trace.
-6—Specifies that tracert.exe can use only IPv6 for the trace.
![]() -g Host-list—Allows hosts to be separated by intermediate gateways.
-g Host-list—Allows hosts to be separated by intermediate gateways.
![]() -h maximumHops—Specifies the maximum number of hops before reaching the target. The default is 30 hops.
-h maximumHops—Specifies the maximum number of hops before reaching the target. The default is 30 hops.
![]() -i address—Uses the specified source address.
-i address—Uses the specified source address.
![]() -n—Specifies that it is not necessary to resolve the address to the hostname.
-n—Specifies that it is not necessary to resolve the address to the hostname.
![]() -p period—Specifies the number of seconds to wait between pings. The default is a quarter of a second.
-p period—Specifies the number of seconds to wait between pings. The default is a quarter of a second.
![]() -q num_queries—Specifies the number of queries to each host along the route. The default is three.
-q num_queries—Specifies the number of queries to each host along the route. The default is three.
![]() -w timeout—Specifies the timeout for each reply in milliseconds.
-w timeout—Specifies the timeout for each reply in milliseconds.
Ipconfig
Ipconfig displays all TCP/IP configuration values. It is of particular use on machines running DHCP. It is used to refresh DHCP settings and to determine which TCP/IP configuration values have been assigned by DHCP. If Ipconfig is used without parameters, it displays IP addresses, subnet masks, and gateways for each of the adapters on a machine. The adapters can be physical network adapters or logical adapters such as dial-up connections.
Some of the parameters for Ipconfig are as follows:
![]() /all—Displays all TCP/IP configuration values.
/all—Displays all TCP/IP configuration values.
![]() /displaydns—Displays the contents of the DNS client resolver cache.
/displaydns—Displays the contents of the DNS client resolver cache.
![]() /flushdns—Resets and flushes the contents of the DNS client resolver cache. This includes entries made dynamically.
/flushdns—Resets and flushes the contents of the DNS client resolver cache. This includes entries made dynamically.
![]() /registerdns—Sets manual dynamic registration for DNS names and IP addresses configured on a computer. This is particularly useful in troubleshooting DNS name registration or dynamic update problems between a DNS server and client.
/registerdns—Sets manual dynamic registration for DNS names and IP addresses configured on a computer. This is particularly useful in troubleshooting DNS name registration or dynamic update problems between a DNS server and client.
![]() /release[Adapter]—Sends a DHCP release message to the DHCP server to discard DHCP-configured settings for adapters. This parameter is available only for DHCP-enabled clients. If no adapter is specified, IP address configuration is released for all adapters.
/release[Adapter]—Sends a DHCP release message to the DHCP server to discard DHCP-configured settings for adapters. This parameter is available only for DHCP-enabled clients. If no adapter is specified, IP address configuration is released for all adapters.
![]() /renew[Adapter]—Renews DHCP configuration for all adapters (if an adapter is not specified) and for a specific adapter if the Adapter parameter is included. This parameter is available only for DHCP-enabled clients.
/renew[Adapter]—Renews DHCP configuration for all adapters (if an adapter is not specified) and for a specific adapter if the Adapter parameter is included. This parameter is available only for DHCP-enabled clients.
![]() /setclassid Adapter [classID]—Configures the DHCP class ID for a specific adapter. You can configure the DHCP class ID for all adapters by using the wildcard (*) character in place of Adapter.
/setclassid Adapter [classID]—Configures the DHCP class ID for a specific adapter. You can configure the DHCP class ID for all adapters by using the wildcard (*) character in place of Adapter.
![]() /showclassid Adapter—Displays the DHCP class ID for a specific adapter.
/showclassid Adapter—Displays the DHCP class ID for a specific adapter.
![]() /allcompartments—Displays information about all compartments.
/allcompartments—Displays information about all compartments.
![]() /allocmpartments /all—Displays detailed information about all compartments.
/allocmpartments /all—Displays detailed information about all compartments.
NOTE
Ipconfig displays the assigned configuration for a system such as the default gateway, DNS servers, local IP address, subnet mask, and so on. When you’re debugging network problems, you can use Ipconfig to validate that the proper TCP/IP settings have been set up for a system so that a server properly communicates on the network.
ARP
ARP stands for Address Resolution Protocol. ARP enables the display and modification of the ARP table on a local machine, which matches physical MAC addresses of machines to their corresponding IP addresses. ARP increases the speed of connection by eliminating the need to match MAC addresses with IP addresses for subsequent connections.
Some of the parameters for the Arp command are as follows:
![]() -a[InetAddr] [-N IfaceAddr]—Displays the ARP table for all adapters on a machine. Use Arp–a with the InetAddr (IP address) parameter to display the ARP cache entry for a specific IP address.
-a[InetAddr] [-N IfaceAddr]—Displays the ARP table for all adapters on a machine. Use Arp–a with the InetAddr (IP address) parameter to display the ARP cache entry for a specific IP address.
![]() -dInetAddr [IfaceAddr]—Deletes an entry with a specific IP address (InetAddr). Use the IfaceAddr parameter (IP address assigned to the interface) to delete an entry in a table for a specific interface. Use the wildcard character in place of InetAddr to delete all entries.
-dInetAddr [IfaceAddr]—Deletes an entry with a specific IP address (InetAddr). Use the IfaceAddr parameter (IP address assigned to the interface) to delete an entry in a table for a specific interface. Use the wildcard character in place of InetAddr to delete all entries.
![]() -g[InetAddr] [-N IfaceAddr]—Similar to the–a parameter.
-g[InetAddr] [-N IfaceAddr]—Similar to the–a parameter.
![]() -sInetAddr EtherAddr [IfaceAddr]—Adds a static entry to the ARP cache that resolves the IP address (InetAddr) to a physical address (EtherAddr). To add a static ARP cache entry to the table for a specific interface, use the IP address assigned to the interface (IfaceAddr).
-sInetAddr EtherAddr [IfaceAddr]—Adds a static entry to the ARP cache that resolves the IP address (InetAddr) to a physical address (EtherAddr). To add a static ARP cache entry to the table for a specific interface, use the IP address assigned to the interface (IfaceAddr).
Netstat
As its name implies, Netstat (or Network Statistics) is used to display protocol statistics for any active connections, monitor connections to a remote host, and monitor IP addresses or domain names of hosts with established connections.
The parameters for Netstat are as follows:
![]() -a—Displays all connections and listening ports by hostname.
-a—Displays all connections and listening ports by hostname.
![]() -b—Displays the executable involved in creating each connection.
-b—Displays the executable involved in creating each connection.
![]() -e—Displays Ethernet packets and bytes to and from the host.
-e—Displays Ethernet packets and bytes to and from the host.
![]() -n—Displays address and port numbers without resolving the address to the hostname.
-n—Displays address and port numbers without resolving the address to the hostname.
![]() -o—Displays TCP connections and includes the corresponding process ID (PID). Used in combination with -a, -n, and -p. Not available in previous Windows versions.
-o—Displays TCP connections and includes the corresponding process ID (PID). Used in combination with -a, -n, and -p. Not available in previous Windows versions.
![]() -p protocol—Displays statistics based on the protocol specified. Protocols that can be specified are TCP, UDP, TCPv6, or UDPv6. It can be used with -s to display TCP, UDP, ICMP, IP, TCPv6, UDPv6, ICMPv6, or IPv6.
-p protocol—Displays statistics based on the protocol specified. Protocols that can be specified are TCP, UDP, TCPv6, or UDPv6. It can be used with -s to display TCP, UDP, ICMP, IP, TCPv6, UDPv6, ICMPv6, or IPv6.
![]() -s—Displays statistics on a protocol-by-protocol basis. Can be used with the -p parameter to specify a set of protocols.
-s—Displays statistics on a protocol-by-protocol basis. Can be used with the -p parameter to specify a set of protocols.
![]() -t—Displays the current connection offload state.
-t—Displays the current connection offload state.
![]() -r—Displays the route table. Information displayed includes network destination, netmask, gateway, interface, and metric (number of hops).
-r—Displays the route table. Information displayed includes network destination, netmask, gateway, interface, and metric (number of hops).
![]() [Parameter] Interval—Displays the information at every interval specified. Interval is a numeral in seconds. Press Ctrl+C to stop the intervals.
[Parameter] Interval—Displays the information at every interval specified. Interval is a numeral in seconds. Press Ctrl+C to stop the intervals.
Route
Route is particularly useful for troubleshooting incorrect static routes or for adding a route to a route table to temporarily bypass a problem gateway. Static routes can be used in place of implicit routes specified by a default gateway. Use Route to add static routes to forward packets going to a gateway specified by default to avoid loops, improve traffic time, and so on.
The parameters for Route are as follows:
![]() -add—Adds a route to a table. Use–p to make the route persistent for subsequent sessions.
-add—Adds a route to a table. Use–p to make the route persistent for subsequent sessions.
![]() -Delete—Deletes a route from the table.
-Delete—Deletes a route from the table.
![]() -Print—Prints a route.
-Print—Prints a route.
![]() -change—Modifies an existing route.
-change—Modifies an existing route.
![]() -destination—Specifies the host address.
-destination—Specifies the host address.
![]() -gateway—Specifies the address of gateway for Route.
-gateway—Specifies the address of gateway for Route.
![]() IF interface—Specifies the interface for the routing table to modify.
IF interface—Specifies the interface for the routing table to modify.
![]() -mask Netmask—Uses the subnet mask specified by Netmask. If -mask is not used, it defaults to 255.255.255.255.
-mask Netmask—Uses the subnet mask specified by Netmask. If -mask is not used, it defaults to 255.255.255.255.
![]() -METRIC Metric—Specifies the metric, or cost, for the route using the value Metric.
-METRIC Metric—Specifies the metric, or cost, for the route using the value Metric.
![]() -f—Clears the routing table of all gateway entries.
-f—Clears the routing table of all gateway entries.
![]() -p—Used with -add to create a persistent route.
-p—Used with -add to create a persistent route.
Nslookup
Nslookup is used to query DNS. You can think of Nslookup as a simple diagnostic client for DNS servers. It can operate in two modes: Interactive and Noninteractive. Use Noninteractive mode to look up a single piece of data. To look up more than one piece of data, use Interactive mode. To stop Interactive mode at any time, press Ctrl+B. To exit from the command, type exit. If Nslookup is used without any parameters, it uses the default DNS name server for lookup.
The parameters for Nslookup are as follows:
![]() -ComputerToFind—Looks up information for the specified ComputerToFind. By default, it uses the current default DNS name server.
-ComputerToFind—Looks up information for the specified ComputerToFind. By default, it uses the current default DNS name server.
![]() -Server—Specifies the server as the DNS name server.
-Server—Specifies the server as the DNS name server.
![]() -SubCommand—Specifies one or more Nslookup subcommands as a command-line option. Type a question mark (?) to display a list of subcommands available.
-SubCommand—Specifies one or more Nslookup subcommands as a command-line option. Type a question mark (?) to display a list of subcommands available.
DCDiag
The Domain Controller Diagnostic (DCDiag) tool analyzes the state of domain controllers and services in an Active Directory forest. It is installed when the Active Directory Domain Services (AD DS) role is added to a Windows Server 2016 installation. This is a great general-purpose test tool for checking the health of an Active Directory infrastructure.
Tests include domain controller connectivity, replication errors, permissions, proper roles, and connectivity, and other general Active Directory health checks. It can even run non-domain controller-specific tests, such as whether a server can be promoted to a domain controller (the dcpromo test), or register its records properly in DNS (RegisterInDNS test).
DCDiag is run on domain controllers exclusively, with the exception of the dcpromo and RegisterInDNS tests.
When run without any parameters, the tests will be run against the current domain controller. This runs all the key tests and is usually sufficient for most purposes.
The parameters for DCDiag are as follows:
![]() /s:DomainController—Uses the domain controller as the home server
/s:DomainController—Uses the domain controller as the home server
![]() /n:NamingContext—Uses the specified naming context (NetBIOS, FQDN, or distinguished name) to test
/n:NamingContext—Uses the specified naming context (NetBIOS, FQDN, or distinguished name) to test
![]() /u:DomainUserName /p:{*|Password|””}—Uses the supplied credentials to run the tool
/u:DomainUserName /p:{*|Password|””}—Uses the supplied credentials to run the tool
![]() /a—Tests all domain controllers in the site
/a—Tests all domain controllers in the site
![]() /e—Tests all domain controllers in the enterprise
/e—Tests all domain controllers in the enterprise
![]() /q—Displays quiet output (errors only)
/q—Displays quiet output (errors only)
![]() /v—Displays verbose output
/v—Displays verbose output
![]() /I—Ignores minor error messages
/I—Ignores minor error messages
![]() /fix—Fixes minor problems
/fix—Fixes minor problems
![]() /f:LogFile—Logs to the specified log file
/f:LogFile—Logs to the specified log file
![]() /ferr:ErrorLogFile—Logs errors to the specified log file
/ferr:ErrorLogFile—Logs errors to the specified log file
![]() /c—Comprehensively runs all tests
/c—Comprehensively runs all tests
![]() /test:TestName—Runs the specified tests only
/test:TestName—Runs the specified tests only
![]() /skip:TestName—Skips the specified tests
/skip:TestName—Skips the specified tests
When specifying tests to run or to skip, nonskippable tests will still be run.
NOTE
DCDiag is automatically included on a Windows Server 2016 system when the Active Directory Domain Services role is added. Otherwise, on non-domain controllers, the utility can be added by adding the Remote Server Administration Tools feature in Server Manager.
Other Useful Troubleshooting Command-Line Tools
Driverquery
Displays a list of all installed device drivers and their properties.
Commonly used parameters of Driverquery are as follows:
![]() /Computer—Specifies the name (or IP address) of the target computer (without backslashes). The default is the local computer.
/Computer—Specifies the name (or IP address) of the target computer (without backslashes). The default is the local computer.
![]() /UDomain User—Runs the command with the account permissions of the user entered. The default is the currently logged-on user.
/UDomain User—Runs the command with the account permissions of the user entered. The default is the currently logged-on user.
![]() /P Password—Specifies the password of the user account that is specified in the /u parameter.
/P Password—Specifies the password of the user account that is specified in the /u parameter.
![]() /FO { TABLE | LIST | CSV }—Specifies output format.
/FO { TABLE | LIST | CSV }—Specifies output format.
![]() /NH—Doesn’t include column headers in the output.
/NH—Doesn’t include column headers in the output.
![]() /V—Displays verbose driver information.
/V—Displays verbose driver information.
![]() /SI—Displays digital signature information for device drivers.
/SI—Displays digital signature information for device drivers.
Eventcreate
Enables an administrator to create a custom event in a specified event log.
Commonly used parameters of Eventcreate are as follows:
![]() /S Computer—Specifies the name (or IP address) of the target computer (without backslashes). The default is the local computer.
/S Computer—Specifies the name (or IP address) of the target computer (without backslashes). The default is the local computer.
![]() /U Domain User—Runs the command with the account permissions of the user entered. The default is the currently logged-on user.
/U Domain User—Runs the command with the account permissions of the user entered. The default is the currently logged-on user.
![]() /P Password—Specifies the password of the user account that is specified in the /u parameter.
/P Password—Specifies the password of the user account that is specified in the /u parameter.
![]() /L { APPLICATION | SYSTEM }—Specifies the event log where the event will be created. Valid values are APPLICATION and SYSTEM.
/L { APPLICATION | SYSTEM }—Specifies the event log where the event will be created. Valid values are APPLICATION and SYSTEM.
![]() /SO Source—Specifies the event source.
/SO Source—Specifies the event source.
![]() /T { ERROR | WARNING | INFORMATION | SUCCESSAUDIT | FAILUREAUDIT
/T { ERROR | WARNING | INFORMATION | SUCCESSAUDIT | FAILUREAUDIT
![]() }—Specifies the type of event. Valid values are ERROR, WARNING, INFORMATION, SUCCESSAUDIT, and FAILUREAUDIT.
}—Specifies the type of event. Valid values are ERROR, WARNING, INFORMATION, SUCCESSAUDIT, and FAILUREAUDIT.
![]() /ID EventID—Specifies the event ID for the event.
/ID EventID—Specifies the event ID for the event.
![]() /D Description—Specifies the description for the event.
/D Description—Specifies the description for the event.
Fc
Compares two files and displays the differences between them.
Commonly used parameters of Fc are as follows:
![]() /A—Abbreviated output for a text file comparison. Only ranges of lines that are different are displayed.
/A—Abbreviated output for a text file comparison. Only ranges of lines that are different are displayed.
![]() /B—Binary mode. The two files are compared byte by byte. This is the default mode for comparing files that have the following file extensions .exe, .com, .sys, .obj, .lib, or .bin.
/B—Binary mode. The two files are compared byte by byte. This is the default mode for comparing files that have the following file extensions .exe, .com, .sys, .obj, .lib, or .bin.
![]() /C—Non-case-sensitive (ignores the case of letters).
/C—Non-case-sensitive (ignores the case of letters).
![]() /L—ASCII (text) mode. Fc compares the files line by line and attempts to resynchronize the files after finding a mismatch. This is the default mode for all files except files with the following file extensions .exe, .com, .sys, .obj, .lib, or .bin.
/L—ASCII (text) mode. Fc compares the files line by line and attempts to resynchronize the files after finding a mismatch. This is the default mode for all files except files with the following file extensions .exe, .com, .sys, .obj, .lib, or .bin.
![]() /LBn—Sets the limit of number of consecutive different lines. If the files have more than n consecutive differing lines, Fc cancels the comparison.
/LBn—Sets the limit of number of consecutive different lines. If the files have more than n consecutive differing lines, Fc cancels the comparison.
![]() /N—Displays the line numbers during an ASCII comparison.
/N—Displays the line numbers during an ASCII comparison.
![]() /U—Unicode mode.
/U—Unicode mode.
![]() [ drive1 : ][ path1 ] filename1—Specifies the first file you want to compare. This parameter is required.
[ drive1 : ][ path1 ] filename1—Specifies the first file you want to compare. This parameter is required.
![]() [ drive2 : ][ path2 ] filename2—Specifies the second file you want to compare. This parameter is required.
[ drive2 : ][ path2 ] filename2—Specifies the second file you want to compare. This parameter is required.
Getmac
Returns the Media Access Control (MAC) address and list of network protocols associated with each address for all network cards in each computer, either locally or across a network. This command is especially useful to capture the MAC address of a remote computer.
Commonly used parameters of Getmac are as follows:
![]() /S System—Specifies the name (or IP address) of the target computer (without backslashes). The default is the local computer.
/S System—Specifies the name (or IP address) of the target computer (without backslashes). The default is the local computer.
![]() /U DomainUser—Runs the command with the account permissions of the user entered. The default is the currently logged-on user.
/U DomainUser—Runs the command with the account permissions of the user entered. The default is the currently logged-on user.
![]() /P Password—Specifies the password of the user account that is specified in the /u parameter.
/P Password—Specifies the password of the user account that is specified in the /u parameter.
![]() /FO { TABLE | LIST | CSV }—Specifies output format.
/FO { TABLE | LIST | CSV }—Specifies output format.
![]() /NH—Doesn’t include column headers in the output.
/NH—Doesn’t include column headers in the output.
![]() /V—Displays verbose information.
/V—Displays verbose information.
Taskkill
Ends one or more tasks or processes. Processes can be killed by process ID or image name.
Commonly used parameters of Taskkill are as follows:
![]() /S System—Specifies the name (or IP address) of the target computer (without backslashes). The default is the local computer.
/S System—Specifies the name (or IP address) of the target computer (without backslashes). The default is the local computer.
![]() /U DomainUser—Runs the command with the account permissions of the user entered. The default is the currently logged-on user.
/U DomainUser—Runs the command with the account permissions of the user entered. The default is the currently logged-on user.
![]() /P Password—Specifies the password of the user account that is specified in the /u parameter.
/P Password—Specifies the password of the user account that is specified in the /u parameter.
![]() /FI FilterName—Creates a filter for the query based on a variety of fields. All processes that meet the filter are terminated.
/FI FilterName—Creates a filter for the query based on a variety of fields. All processes that meet the filter are terminated.
![]() /PID ProcessID—Specifies the process ID of the process to be terminated.
/PID ProcessID—Specifies the process ID of the process to be terminated.
![]() /IM ImageName—Specifies the image name of the process to be terminated. Use the wildcard (*) to specify all image names.
/IM ImageName—Specifies the image name of the process to be terminated. Use the wildcard (*) to specify all image names.
![]() /F—Forces the processes to be terminated. When specifying a remote computer, processes are always forcefully terminated.
/F—Forces the processes to be terminated. When specifying a remote computer, processes are always forcefully terminated.
![]() /T—Specifies to terminate all child processes along with the parent process (known as a tree kill).
/T—Specifies to terminate all child processes along with the parent process (known as a tree kill).
Tasklist
Displays a list of applications and services with their PID for all tasks running on either a local or a remote computer.
Commonly used parameters of Tasklist are as follows:
![]() /S System—Specifies the name (or IP address) of the target computer (without backslashes). The default is the local computer.
/S System—Specifies the name (or IP address) of the target computer (without backslashes). The default is the local computer.
![]() /U DomainUser—Runs the command with the account permissions of the user entered. The default is the currently logged-on user.
/U DomainUser—Runs the command with the account permissions of the user entered. The default is the currently logged-on user.
![]() /P Password—Specifies the password of the user account that is specified in the /u parameter.
/P Password—Specifies the password of the user account that is specified in the /u parameter.
![]() /FO { TABLE | LIST | CSV }—Specifies output format.
/FO { TABLE | LIST | CSV }—Specifies output format.
![]() /NH—Doesn’t include column headers in the output.
/NH—Doesn’t include column headers in the output.
![]() /FI FilterName—Creates a filter for the query based on a variety of fields.
/FI FilterName—Creates a filter for the query based on a variety of fields.
![]() /V—Displays verbose task information in the output.
/V—Displays verbose task information in the output.
System Startup and Recovery
The System Startup and Recovery utility stores system startup, system failure, and debugging information. It also controls the behavior (what to do) when a system failure occurs.
To open System Startup and Recovery, launch Control Panel, select System and Security, select System, Advanced System Settings, click the Advanced tab in the Systems Settings dialog box, and then click Settings under Startup and Recovery to display a property page similar to the one shown in Figure 32.30.
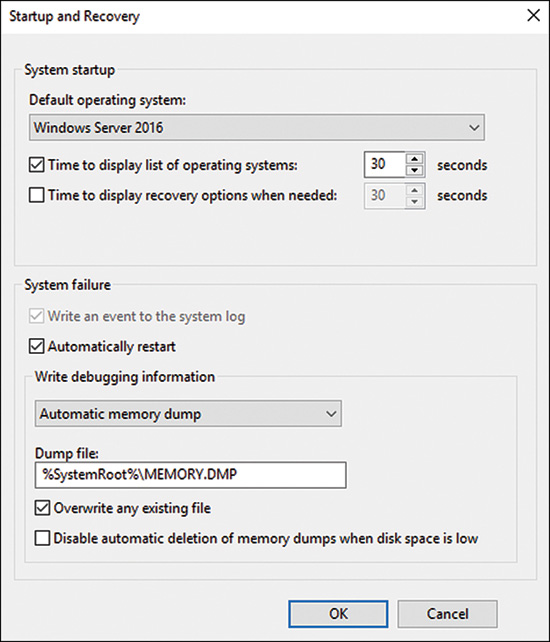
The Default Operating System field contains information that is displayed at startup. This information is typically the name of the operating system such as Windows Server 2016. You can edit this information using bcdedit from a command prompt. If the machine is dual-booted, there will be an entry for each operating system. The Time to Display List of Operating Systems option specifies the time the system takes to display the name of the operating system at startup. The default time is 30 seconds. This can be increased or reduced. The Time to Display Recovery Options When Needed is unchecked by default, but can be selected and an interval in seconds entered.
You can set the action to be taken when system failure occurs in the System Failure section. There are two options. The first option is Write an Event to the System Log. This action is not editable in Windows Server 2016 because this action occurs by default every time a stop error occurs. The next option, Automatically Restart, reboots the system in the event of a system failure.
The Write Debugging Information section tells the system where to write debugging information when a system failure occurs. The options available include where the debugging information can be written to and the level of debugging information: Small Memory Dump (128KB), Kernel Memory Dump, Complete Memory Dump, or (None). The Write Debugging Information To option requires a paging file on the boot volume, which should be large enough to contain the select debugging option.
Windows Memory Diagnostics Tool
Many troubleshooting scenarios revolve around memory-related issues associated with a system. Typical memory issues can involve an errant application, a specific process consuming too much memory, or failing hardware such as bad RAM or the memory system on the motherboard. Thankfully, Windows Server 2016 includes a tool for diagnosing problems associated with system memory.
By using Windows Memory Diagnostics Tool, an administrator has another way to isolate root issues when a server is performing poorly, subject to crashes, or is exhibiting other abnormal behavior not caused by issues with the OS or installed applications.
To launch the Windows Memory Diagnostics Tool, follow these steps:
1. Save all work and close down open applications and utilities.
2. To invoke the tool, select Start by hovering your mouse at the bottom-left corner of the screen and type Windows Memory Diagnostic into the search box to display and then launch the program.
3. Select whether you want to Restart Now and Check for Problems or Check for Problems the Next Time I Start My Computer, as displayed in Figure 32.31.

4. When the system is rebooted, the Diagnostics tool automatically launches and conducts a Basic test by using default settings. Additional Test Mix options, Cache options, and Pass Count can be selected by pressing F1. The Test Mix options consist of Basic, Standard, and Extended. The Cache option includes Default, On, or Off. In addition, set the pass count value. The value represents the number of times the entire test mix will be repeated. Note a value of 0 represents infinitely. Press F10 to apply the settings and start the memory tests. Status is reported throughout the test indicating results.
The Windows Memory Diagnostics Tool might not detect all the problems with the system RAM. Just because no errors are reported doesn’t mean the RAM or even the motherboard is working properly. Typically, the manufacturer of the hardware device will have additional diagnostics utilities that enable an administrator to conduct a deeper analysis of the root problems at the hardware level.
Task Scheduler
The Task Scheduler in Windows Server 2008 R2 replaced the Scheduled Tasks tool that was literally unchanged since the release of Windows 98. The tool remains unchanged in Windows Server 2016. The main focal point of the tool is to assist administrators by automating tasks. In addition, by consolidating standard and recurring tasks into a central location, administrators gain insight into system functionality and control over their Windows Server 2016 infrastructure through automation. These things together assist administrators in the areas of logging and debugging.
One of the most compelling features of the Task Scheduler is that it fully integrates with Event Viewer. As such, a task can be triggered based on an event captured in the event log. This is a great feature because administrators can be automatically notified when a specific event transpires.
Understanding Task Scheduler
Scheduling tasks involves triggers and actions. A task runs once it is triggered. Tasks are initiated by triggers that are based on an event or time. Multiple triggers can be associated with a task as defined by an administrator. An action represents the work being performed as the task is being executed. Examples of actions include starting a program or sending an email. When a task is running multiple actions, up to 32 can be performed.
An additional functionality is task conditions. When a task is triggered, it will only run if specific defined conditions are met. Task conditions eliminate ambiguous situations by providing criteria-based functions. With these improvements to Task Scheduler functionality, it has become a very powerful and extensive development and activation tool for automating and assisting with troubleshooting tasks.
Windows Server 2016 Task Scheduler is accessed using the Tools menu in Server Manager. Figure 32.32 shows the user interface.
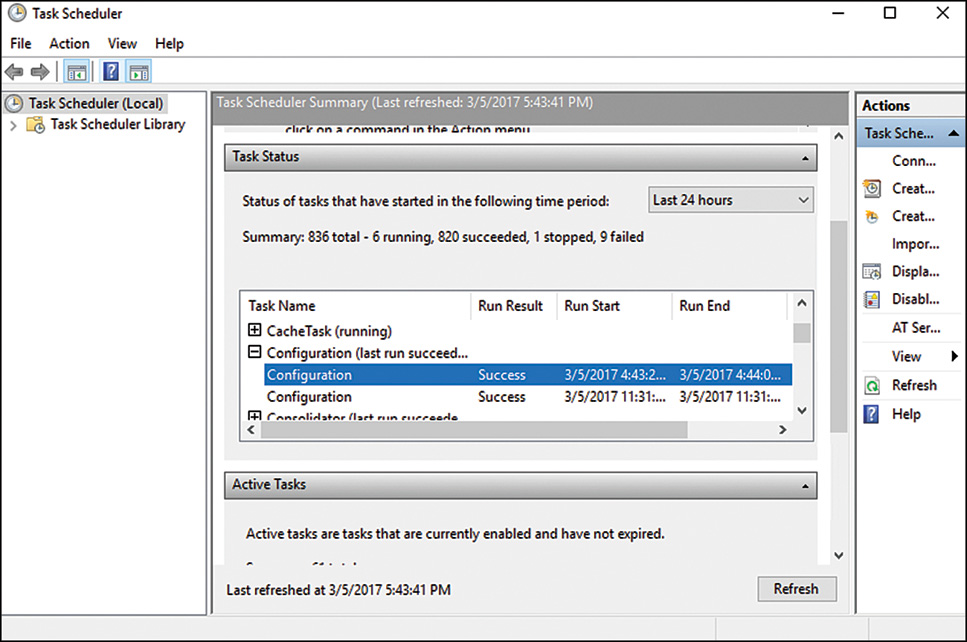
Tasks are created by selecting Create Basic Task, Create Task, or Import Task from the Actions pane in the Task Scheduler snap-in. When creating a task, you need to configure five tabs of options: Settings, Triggers, Actions, Conditions, and Additional Settings. The following subsections explain the options when creating tasks.
Understanding Trigger Options and Settings
The first thing to consider when configuring a task is what triggers will cause the task to execute. Triggers can be based on time, events, or various system states. As noted earlier, each task can contain multiple triggers. With more than one trigger, the task will launch when any of the conditions in any of the triggers is met.
The following list describes the various trigger types and the settings that you can configure for each type:
![]() On a Schedule—Triggers for a schedule allow tasks to run on a specific date (one time), daily, weekly, or monthly. For recurring tasks, the start time can be configured along with reoccurring options to completely customize when the task will run.
On a Schedule—Triggers for a schedule allow tasks to run on a specific date (one time), daily, weekly, or monthly. For recurring tasks, the start time can be configured along with reoccurring options to completely customize when the task will run.
![]() At Log On—Tasks scheduled to run when At Log On is set for any user or for a specific user or group of users.
At Log On—Tasks scheduled to run when At Log On is set for any user or for a specific user or group of users.
![]() At Startup—There are no specific settings for tasks configured to run at startup. This type of trigger runs whenever the system starts and the only settings are the advanced ones, which are described later in the chapter.
At Startup—There are no specific settings for tasks configured to run at startup. This type of trigger runs whenever the system starts and the only settings are the advanced ones, which are described later in the chapter.
![]() On Idle—The settings for tasks set to run when the computer is idle are set on the Conditions tab.
On Idle—The settings for tasks set to run when the computer is idle are set on the Conditions tab.
![]() On an Event—This trigger causes a task to run when specific events are created in an event log. You can choose either a basic event trigger or custom event settings. Basic settings fire based on a single event from a specific event log. You choose which log contains the event, the publisher name, and the event ID. If you specify the custom event trigger settings, you can specify an XML event query or custom event filter to query for events that will fire the task.
On an Event—This trigger causes a task to run when specific events are created in an event log. You can choose either a basic event trigger or custom event settings. Basic settings fire based on a single event from a specific event log. You choose which log contains the event, the publisher name, and the event ID. If you specify the custom event trigger settings, you can specify an XML event query or custom event filter to query for events that will fire the task.
NOTE
It is easier to create event-based triggers from within the event log unless you know exactly what events you want to trigger. See the section “Customizing the Event Log,” earlier in this chapter, for a detailed explanation of how to create events from within the event log.
![]() At Task Creation/Modification—Tasks created with this trigger are fired as soon as they are created or whenever they are modified. The only settings for this trigger are the advanced settings as described in the next section, “Understanding the Advanced Settings Associated with Triggers.”
At Task Creation/Modification—Tasks created with this trigger are fired as soon as they are created or whenever they are modified. The only settings for this trigger are the advanced settings as described in the next section, “Understanding the Advanced Settings Associated with Triggers.”
![]() On Connection to User Session—The trigger fires when a user connects to the system using the Remote Desktop Connection program from another system and can be set to run when any user connects, or when a specific user or group connects to the server.
On Connection to User Session—The trigger fires when a user connects to the system using the Remote Desktop Connection program from another system and can be set to run when any user connects, or when a specific user or group connects to the server.
![]() On Disconnect from User Session—This trigger works the same as the On Connection to User Session; however, it fires when users disconnect from the server from a Remote Desktop Connection session. The trigger can be set to run for all users or a specific user or group.
On Disconnect from User Session—This trigger works the same as the On Connection to User Session; however, it fires when users disconnect from the server from a Remote Desktop Connection session. The trigger can be set to run for all users or a specific user or group.
![]() On Workstation Lock—The trigger fires when the workstation is locked. The settings for this trigger enable you to set it for all users or a specific user or group.
On Workstation Lock—The trigger fires when the workstation is locked. The settings for this trigger enable you to set it for all users or a specific user or group.
![]() On Workstation Unlock—This trigger fires when the workstation is unlocked. The settings for this trigger enable you to set it for all users or a specific user or group.
On Workstation Unlock—This trigger fires when the workstation is unlocked. The settings for this trigger enable you to set it for all users or a specific user or group.
Understanding the Advanced Settings Associated with Triggers
Advanced settings exist when creating triggers. Familiarize yourself with these advanced settings to ensure trigger creation and the workflow process is fully optimized. The following bullets explain each of the advanced settings associated with triggers:
![]() Delay Task for or Delay Task for Up To (Random Delay)—Tasks can be delayed randomly so that they do not start immediately when the schedule triggers a task. For systems that might run the same tasks, this ensures there is some load balancing and that all systems do not run tasks at exactly the same time. Random delays can be set for 30 seconds, 1 minute, 30 minutes, 1 hour, 8 hours, or up to 1 day.
Delay Task for or Delay Task for Up To (Random Delay)—Tasks can be delayed randomly so that they do not start immediately when the schedule triggers a task. For systems that might run the same tasks, this ensures there is some load balancing and that all systems do not run tasks at exactly the same time. Random delays can be set for 30 seconds, 1 minute, 30 minutes, 1 hour, 8 hours, or up to 1 day.
![]() Repeat Task Every—Tasks can also be set to repeat at regular intervals and for a set duration (e.g., a task could be set to ping a particular system every minute for 1 day, write an event to the event log in the case of a failure, and email a distribution group to notify the IT team about the issue).
Repeat Task Every—Tasks can also be set to repeat at regular intervals and for a set duration (e.g., a task could be set to ping a particular system every minute for 1 day, write an event to the event log in the case of a failure, and email a distribution group to notify the IT team about the issue).
![]() Stop Any Task if It Runs Longer Than—Tasks can be stopped if they run past a defined amount of time and can be set to expire at a certain date and time.
Stop Any Task if It Runs Longer Than—Tasks can be stopped if they run past a defined amount of time and can be set to expire at a certain date and time.
![]() Start and Expire—Start and Expiration times can be set to synchronize across time zones to ensure tasks set to run on systems in multiple time zones start and stop at the same time.
Start and Expire—Start and Expiration times can be set to synchronize across time zones to ensure tasks set to run on systems in multiple time zones start and stop at the same time.
![]() Enabled—Tasks can be enabled or disabled by checking or unchecking the enabled box.
Enabled—Tasks can be enabled or disabled by checking or unchecking the enabled box.
Actions Associated with a Task
As mentioned earlier, an action is the work conducted when a task runs. Tasks can have a single action or up to a maximum of 32 actions. The Actions tab of a task contains a list of actions associated with a particular task. An administrator can edit each action as follows:
![]() Start a Program—This action starts a program or script. In the Program/Script text box, type either the name of the program or script that should be run. Alternatively, the administrator can browse the application or script. If further command-line arguments are required, these can be specified in the Add Arguments (Optional) text box. In the Start In (Optional) text box, the working directory can be specified for the command line that executes the program or script. This path is either the path to the program or script or to the files that are used by the executable.
Start a Program—This action starts a program or script. In the Program/Script text box, type either the name of the program or script that should be run. Alternatively, the administrator can browse the application or script. If further command-line arguments are required, these can be specified in the Add Arguments (Optional) text box. In the Start In (Optional) text box, the working directory can be specified for the command line that executes the program or script. This path is either the path to the program or script or to the files that are used by the executable.
![]() Send an E-mail—This action sends an email when the task is triggered. In the Edit Action dialog box, you enter whom the email is from, whom it should be sent to, a subject, and any desired text. You must also enter a valid SMTP server.
Send an E-mail—This action sends an email when the task is triggered. In the Edit Action dialog box, you enter whom the email is from, whom it should be sent to, a subject, and any desired text. You must also enter a valid SMTP server.
![]() Display a Message—This action simply displays a message on the console of the system where the task is created. You can enter a title for the message as well as any text that should be displayed. This type of action only launches if the Run Only if User Is Logged On security option has been selected on the General tab of the Task Properties in the Create Task dialog box.
Display a Message—This action simply displays a message on the console of the system where the task is created. You can enter a title for the message as well as any text that should be displayed. This type of action only launches if the Run Only if User Is Logged On security option has been selected on the General tab of the Task Properties in the Create Task dialog box.
Understanding Conditions Associated with a Task
Conditions in conjunction with triggers determine whether the task will run. Tasks will not run if any condition associated with a given task is not fulfilled. The following list describes the types of conditions associated with a task:
![]() Idle Conditions—A trigger can be based on idle time of a computer. Idle time is checked by the Task Scheduler service every 15 minutes. Computers are idle if a screensaver is running. When a screensaver is not running, the computer is considered to be idle if for 15 minutes the CPU usage and disk input or output were at 0% for 90% of the overall time. In this situation, mouse or keyboard input should also be nil during this period of time. The Task Scheduler service only waits for user input to mark the end of an idle state.
Idle Conditions—A trigger can be based on idle time of a computer. Idle time is checked by the Task Scheduler service every 15 minutes. Computers are idle if a screensaver is running. When a screensaver is not running, the computer is considered to be idle if for 15 minutes the CPU usage and disk input or output were at 0% for 90% of the overall time. In this situation, mouse or keyboard input should also be nil during this period of time. The Task Scheduler service only waits for user input to mark the end of an idle state.
![]() Power Conditions—Administrators can specify that tasks run only on computers operating on AC power. If administrators do not want a task to run when a computer is on battery power, a condition must be set to stop the task. Also, if the computer is off, a condition can be set to awaken the computer from a Sleep or Hibernate mode so that the task can run. Although this is unlikely in a server environment, it is still an option.
Power Conditions—Administrators can specify that tasks run only on computers operating on AC power. If administrators do not want a task to run when a computer is on battery power, a condition must be set to stop the task. Also, if the computer is off, a condition can be set to awaken the computer from a Sleep or Hibernate mode so that the task can run. Although this is unlikely in a server environment, it is still an option.
![]() Network Conditions—Administrators can choose to start a task only if a specified network connection is available. This setting is appropriate if the action requires access to a remote system or network.
Network Conditions—Administrators can choose to start a task only if a specified network connection is available. This setting is appropriate if the action requires access to a remote system or network.
Understanding Task Settings
The Settings tab of the Tasks Properties or Create Task dialog box offers settings that help you control how the task is run, restarted, stopped, or deleted, as follows:
![]() Allow Task to Be Run on Demand—If selected, this setting enables the administrator to manually start the task regardless of triggers or conditions by selecting the tasks and clicking Run in the Actions pane or right-clicking the task and selecting Run from the context menu.
Allow Task to Be Run on Demand—If selected, this setting enables the administrator to manually start the task regardless of triggers or conditions by selecting the tasks and clicking Run in the Actions pane or right-clicking the task and selecting Run from the context menu.
![]() Run Task as Soon as Possible After a Scheduled Start Is Missed—If this option is selected, a task that has been scheduled to start at a specific time but did not run (e.g., the computer was off or the scheduler service was busy) will be started, but only after 10 minutes has elapsed from the original start time.
Run Task as Soon as Possible After a Scheduled Start Is Missed—If this option is selected, a task that has been scheduled to start at a specific time but did not run (e.g., the computer was off or the scheduler service was busy) will be started, but only after 10 minutes has elapsed from the original start time.
![]() If the Task Fails, Restart Every—This setting controls what to do when a task does not run (e.g., if a task fails to start a service due to an undetermined system problem). If this option is selected, an administrator can also configure the number of attempts that should be made to initiate the task.
If the Task Fails, Restart Every—This setting controls what to do when a task does not run (e.g., if a task fails to start a service due to an undetermined system problem). If this option is selected, an administrator can also configure the number of attempts that should be made to initiate the task.
![]() If the Running Task Does Not End When Requested, Force It to Stop—If a task does not respond to a request to stop, an administrator can set a condition to force it to stop.
If the Running Task Does Not End When Requested, Force It to Stop—If a task does not respond to a request to stop, an administrator can set a condition to force it to stop.
![]() Stop the Task If It Runs Longer Than—If this item is checked, a limit on how long the task can run is enforced. As a result of this setting, a task might not be completed when it is stopped.
Stop the Task If It Runs Longer Than—If this item is checked, a limit on how long the task can run is enforced. As a result of this setting, a task might not be completed when it is stopped.
![]() If the Task Is Not Scheduled to Run Again, Delete It After—This selection helps the administrator keep the Task Scheduler MMC free from old tasks that might have been put in place to accomplish a specific action, but are no longer needed or will never be repeated. Note that a trigger must contain an expiration task.
If the Task Is Not Scheduled to Run Again, Delete It After—This selection helps the administrator keep the Task Scheduler MMC free from old tasks that might have been put in place to accomplish a specific action, but are no longer needed or will never be repeated. Note that a trigger must contain an expiration task.
![]() If the Task Is Already Running: Do Not Start a New Instance—The task will not start a new instance if an instance of the task is already running.
If the Task Is Already Running: Do Not Start a New Instance—The task will not start a new instance if an instance of the task is already running.
![]() If the Task Is Already Running: Run a New Instance in Parallel—A new task will run in parallel if one instance is running and the triggers and conditions cause the task to be triggered again.
If the Task Is Already Running: Run a New Instance in Parallel—A new task will run in parallel if one instance is running and the triggers and conditions cause the task to be triggered again.
![]() If the Task Is Already Running: Queue a New Instance—A new task will queue, but it will not start until the first instance is complete and will not stop the instance that is already running.
If the Task Is Already Running: Queue a New Instance—A new task will queue, but it will not start until the first instance is complete and will not stop the instance that is already running.
![]() If the Task Is Already Running: Stop the Existing Instance—A new task is triggered and conditions specified in the task will first stop the current instance and then start a new instance of the task.
If the Task Is Already Running: Stop the Existing Instance—A new task is triggered and conditions specified in the task will first stop the current instance and then start a new instance of the task.
Viewing Task History
The History tab on the properties page for a task contains events filtered from the Operational events for the Task Scheduler in the Event Viewer and enables an administrator to see success and failures for any given task without having to review all task-related event information for a system or collection of systems.
NOTE
Although the Task Scheduler enables an administrator to create folders for organizing tasks and new tasks can be given meaningful names, after a folder or task is created, it cannot be renamed. Further, tasks cannot be moved from one folder to another. However, tasks can be exported and then imported into a new folder or another system.
Summary
Logging and debugging tools help administrators monitor, manage, and problem solve errors on a Windows Server 2016 system and infrastructure. Many of the tools used to identify system problems in a Windows Server 2016 environment have been improved from earlier versions of the applications in earlier releases of the Windows operating system. In addition, new tools have been introduced to enhance the administration logging and debugging experience. Key to problem-solving is enabling logging and monitoring the logs to identify errors, research the errors, and perform system recovery based on problem resolution.
In addition to the tools and utilities that come with the Windows Server 2016 environment are resources such as the Microsoft TechNet database (www.microsoft.com/technet/). Between utility and tool improvements as well as online technical research databases, problem-solving can be simplified in a Windows Server 2016 infrastructure.
Best Practices
The following are best practices from this chapter:
![]() Use the Task Manager to provide an instant view of system resources, such as processor activity, process activity, memory usage, and resource consumption.
Use the Task Manager to provide an instant view of system resources, such as processor activity, process activity, memory usage, and resource consumption.
![]() Use Event Viewer to check whether Windows Server 2016 is experiencing problems.
Use Event Viewer to check whether Windows Server 2016 is experiencing problems.
![]() To mitigate configuration issues, server roles should be scanned with the Best Practices Analyzer tool on a regular basis.
To mitigate configuration issues, server roles should be scanned with the Best Practices Analyzer tool on a regular basis.
![]() Use filters, grouping, and sorting to help isolate and identify key events.
Use filters, grouping, and sorting to help isolate and identify key events.
![]() Create custom filters to expedite problem identification and improve monitoring processes.
Create custom filters to expedite problem identification and improve monitoring processes.
![]() Create alerts using triggers and actions to identify issues quickly.
Create alerts using triggers and actions to identify issues quickly.
![]() Archive security logs to a central location on your network and then review them periodically against local security logs.
Archive security logs to a central location on your network and then review them periodically against local security logs.
![]() Use subscriptions to consolidate logs from multiple systems to ensure that problems are identified quickly.
Use subscriptions to consolidate logs from multiple systems to ensure that problems are identified quickly.
![]() Set an auditing policy to shut down the server immediately when the security log is full. This prevents generated logs from being overwritten or old logs from being erased.
Set an auditing policy to shut down the server immediately when the security log is full. This prevents generated logs from being overwritten or old logs from being erased.
![]() Establish a process for monitoring and analyzing system performance to promote maximum uptime and to meet service-level agreements.
Establish a process for monitoring and analyzing system performance to promote maximum uptime and to meet service-level agreements.
![]() Run Resource Monitor from a remote computer to monitor servers.
Run Resource Monitor from a remote computer to monitor servers.
![]() Use logging when monitoring a larger number of servers.
Use logging when monitoring a larger number of servers.
![]() Establish performance baselines.
Establish performance baselines.
![]() Create logging jobs based on established baselines to ensure performance data is captured during times when the system is having resource issues and to facilitate altering for proactive system management.
Create logging jobs based on established baselines to ensure performance data is captured during times when the system is having resource issues and to facilitate altering for proactive system management.
![]() Create new baselines as applications or new services are added to a server.
Create new baselines as applications or new services are added to a server.
![]() Consider reducing the frequency of data collection to reduce the amount of data that must be collected and analyzed.
Consider reducing the frequency of data collection to reduce the amount of data that must be collected and analyzed.
![]() Use logs to capture performance data.
Use logs to capture performance data.
![]() Use the Memory Diagnostics Tool to facilitate hardware troubleshooting.
Use the Memory Diagnostics Tool to facilitate hardware troubleshooting.
![]() Use Server Manager as a central console to monitor and address issues from a consolidated view, easily switching to other tools as needed.
Use Server Manager as a central console to monitor and address issues from a consolidated view, easily switching to other tools as needed.