CHAPTER 33
Capacity Analysis and Performance Optimization
Capacity analysis and performance optimization are critical parts of deploying or migrating to Windows Server 2016. Capacity analysis and performance optimization ensures that resources and applications are available, uptime is maximized, and systems scale well to meet the growing demands of business. The release of Windows Server 2016 includes some new and some refreshed tools to assist IT administrators and staff with properly assessing server capacity and performance—before and after Windows Server 2016 is deployed on the network. If you invest time in understanding and using these processes, you will spend less time troubleshooting or putting out fires, thus making your life less stressful and also reducing business costs.
Defining Capacity Analysis
The majority of capacity analysis is working to minimize unknown or immeasurable variables, such as the number of gigabytes or terabytes of storage the system will need in the next few months or years (to adequately size a system). The high number of unknown variables is largely because network environments, business policy, and people are constantly changing. As a result, capacity analysis is an art as much as it involves experience and insight.
If you have ever found yourself having to specify configuration requirements for a new server or having to estimate whether your configuration will have enough power to sustain various workloads now and in the foreseeable future, proper capacity analysis can help in the design and configuration. These capacity-analysis processes help weed out the unknowns and assist you while making decisions as accurately as possible. They do so by giving you a greater understanding of your Windows Server 2016 environment. You can then use this knowledge and understanding to reduce time and costs associated with supporting and designing an infrastructure. The result is that you gain more control over the environment, reduce maintenance and support costs, minimize firefighting, and make more efficient use of your time.
Business depends on network systems for a variety of different operations, such as performing transactions or providing security so that the business functions as efficiently as possible. Systems that are underutilized are probably wasting money and are of little value. Systems that are overworked or cannot handle workloads might prevent the business from completing tasks or transactions in a timely manner, cause a loss of opportunity, or keep the users from being productive. Either way, these systems are typically not providing as much benefit as they can to operating the business. To keep network systems well tuned for the given workloads, capacity analysis seeks a balance between the resources available and the workload required of the resources. The balance provides just the right amount of computing power for given and anticipated workloads.
This concept of balancing resources extends beyond the technical details of server configuration to include issues such as gauging the number of administrators that might be needed to maintain various systems in your environment. Many of these questions relate to capacity analysis, and the answers are not readily known because they cannot be predicted with complete accuracy.
To lessen the burden and dispel some of the mysteries of estimating resource requirements, capacity analysis provides the processes to guide you. These processes include vendor guidelines, industry benchmarks, analysis of present system resource utilization, and more. Through these processes, you’ll gain as much understanding as possible of the network environment and step away from the compartmentalized or limited understanding of the systems. In turn, you’ll also gain more control over the systems and increase your chances of successfully maintaining the reliability, serviceability, and availability of your system.
There is no set or formal way to start your capacity-analysis processes. However, a proven and effective means to begin to proactively manage your system is to first establish systemwide policies and procedures. Policies and procedures, discussed shortly, help shape service levels and users’ expectations. After these policies and procedures are classified and defined, you can more easily start characterizing system workloads, which will help gauge acceptable baseline performance values.
The Benefits of Capacity Analysis and Performance Optimization
The benefits of capacity analysis and performance optimization are almost inconceivable. Capacity analysis helps define and gauge overall system health by establishing baseline performance values, and then the analysis provides valuable insight into where the system is heading. Continuous performance monitoring and optimization will ensure systems are stable and perform well, reducing support calls from end users, which, in turn, reduces costs to the organization and helps employees be more productive. It can be used to uncover both current and potential bottlenecks and can also reveal how changing management activities can affect performance today and tomorrow.
Another benefit of capacity analysis is that it can be applied to small environments and scale well into enterprise-level systems. The level of effort needed to initially drive the capacity-analysis processes will vary depending on the size of your environment, geography, and political divisions. With a little upfront effort, you’ll save time, expense, and gain a wealth of knowledge and control over the network environment.
Establishing Policy and Metric Baselines
As mentioned earlier, it is recommended that you first begin defining policies and procedures regarding service levels and objectives. Because each environment varies in design, you can’t create cookie-cutter policies—you need to tailor them to your particular business practices and to the environment. In addition, you should strive to set policies that set user expectations and, more important, help winnow out empirical data.
Essentially, policies and procedures define how the system is supposed to be used—establishing guidelines to help users understand that they cannot use the system in just any way they see fit. Many benefits are derived from these policies and procedures. For example, in an environment where policies and procedures are working successfully but where network performance becomes sluggish, it would be safe to assume that groups of people weren’t playing a multiuser network game, that several individuals weren’t sending enormous email attachments to everyone in the global address list, or that a rogue web or FTP server was not placed on the network.
The network environment is shaped by the business more so than the IT department. Therefore, it is equally important to gain an understanding of users’ expectations and requirements through interviews, questionnaires, surveys, and more. Some examples of policies and procedures that you can implement in your environment pertaining to end users are the following:
![]() Email message size, including attachments, cannot exceed 10MB.
Email message size, including attachments, cannot exceed 10MB.
![]() SQL Server databases settings are enforced with Policy-Based Management.
SQL Server databases settings are enforced with Policy-Based Management.
![]() Beta software, freeware, and shareware can be installed only on test equipment (that is, not on client machines or servers in the production environment).
Beta software, freeware, and shareware can be installed only on test equipment (that is, not on client machines or servers in the production environment).
![]() Specify what software is allowed to run on a user’s PC through centrally managed but flexible group policies.
Specify what software is allowed to run on a user’s PC through centrally managed but flexible group policies.
![]() All computing resources are for business use only (in other words, no gaming or personal use of computers is allowed).
All computing resources are for business use only (in other words, no gaming or personal use of computers is allowed).
![]() Only business-related and approved applications are supported and allowed on the network.
Only business-related and approved applications are supported and allowed on the network.
![]() All home directories are limited in size (e.g., 5GB) per user.
All home directories are limited in size (e.g., 5GB) per user.
![]() Users can receive IT support by filling out the technical support web form or through the advertised help desk phone number.
Users can receive IT support by filling out the technical support web form or through the advertised help desk phone number.
Policies and procedures, however, aren’t just for end users. They can also be established and applied to IT personnel. In this scenario, policies and procedures can serve as guidelines for technical issues, rules of engagement, or an internal set of rules to abide by. The following list provides some examples of policies and procedures that might be applied to the IT department:
![]() System backups must include system state data and should be completed by 5 a.m. each workday, and restores should be tested monthly for accuracy and disaster preparedness.
System backups must include system state data and should be completed by 5 a.m. each workday, and restores should be tested monthly for accuracy and disaster preparedness.
![]() Routine system maintenance should be performed only outside of normal business hours (e.g., weekdays between 8 p.m. and 5 a.m. or on weekends).
Routine system maintenance should be performed only outside of normal business hours (e.g., weekdays between 8 p.m. and 5 a.m. or on weekends).
![]() Basic technical support requests should be attended to within two business days.
Basic technical support requests should be attended to within two business days.
![]() Priority technical support requests should be attended to within four hours of the request.
Priority technical support requests should be attended to within four hours of the request.
![]() Any planned downtime for servers should follow a change-control process and must be approved by the IT director at least one week in advance with a 5-day lead time provided to those impacted by the change.
Any planned downtime for servers should follow a change-control process and must be approved by the IT director at least one week in advance with a 5-day lead time provided to those impacted by the change.
Benchmark Baselines
If you’ve begun defining policies and procedures, you’re already cutting down the number of immeasurable variables and amount of empirical data that challenge your decision-making process. The next step to prepare for capacity analysis is to begin gathering baseline performance values. The Microsoft Baseline Security Analyzer (MBSA) is one tool that performs a security compliance scan against a predefined baseline.
Baselines give you a starting point with which you can compare results. For the most part, determining baseline performance levels involves working with hard numbers that represent the health of a system. A few variables coincide with the statistical representations, however, such as workload characterization, vendor requirements or recommendations, industry-recognized benchmarks, and the data that you collect.
Workload Characterization
Workloads are defined by how processes or tasks are grouped, the resources they require, and the type of work being performed. Examples of how workloads can be characterized include departmental functions, time of day, the type of processing required (such as batch or real time), companywide functions (such as payroll), volume of work, and much more.
It is unlikely that each system in your environment is a separate entity that has its own workload characterization. Most, if not all, network environments have systems that depend on other systems or are even intertwined among different workloads. This makes workload characterization difficult at best.
So, why is workload characterization so important? Identifying system workloads allows you to determine the appropriate resource requirements for each of them. This way, you can properly plan the resources according to the performance levels the workloads expect and demand.
Benchmarks
Benchmarks are a means to measure the performance of a variety of products, including operating systems, nearly all computer components, and even entire systems. Many companies rely on benchmarks to gain competitive advantage because so many professionals rely on them to help determine what is appropriate for their network environment.
As you would suspect, sales and marketing departments all too often exploit the benchmark results to sway IT professionals over their way. For this reason, it is important to investigate the benchmark results and the companies or organizations that produced the results. Vendors, for the most part, are honest with the results, but it is always a good idea to check with other sources, especially if the results are suspicious. For example, if a vendor has supplied benchmarks for a particular product, check to ensure that the benchmarks are consistent with other benchmarks produced by third-party organizations (such as magazines, benchmark organizations, and in-house testing labs). If none are available, try to gain insight from other IT professionals or run benchmarks on the product yourself before implementing it in production.
Although some suspicion might arise from benchmarks because of the sales and marketing techniques, the real purpose of benchmarks is to point out the performance levels that you can expect when using the product. Benchmarks can be extremely beneficial for decision-making, but they should not serve as your sole source for evaluating and measuring performance. Use the benchmark results only as a guideline or starting point when consulting benchmark results during capacity analysis. It is also recommended that you pay close attention to their interpretation.
Table 33.1 lists companies or organizations that provide benchmark statistics and benchmark-related information, and some also offer tools for evaluating product performance.
TABLE 33.1 Organizations that Provide Benchmarks
Company/Organization Name |
Web Address |
The Tolly Group |
|
Transaction Processing Performance Council |
|
LioNBRIDGE (VeriTest) |
|
Computer Measurement Group |
Using Capacity-Analysis Tools
Analyzing system capacity and performance requires a handful of tools and the knowledge to use them properly to obtain valuable data. Windows Server 2016 includes several tools to assist with this initiative, and even more are available for download or purchase from Microsoft. In addition, several other companies have performance and capacity-analysis solutions available. Some of these tools can even forecast system capacity, depending on the amount of information they are given.
A number of sizing tools are available from various companies. A sizing tool takes data relative to the networking environment and returns recommended hardware configurations, usually in a Microsoft Excel spreadsheet or similar reporting application. One such tool is the Microsoft Assessment and Planning (MAP) Toolkit. This tool, available for download from Microsoft at http://technet.microsoft.com/en-us/solutionaccelerators/dd537566, assists you when planning your migration to Windows Server 2016 by creating an inventory of your current server infrastructure; therefore, you can determine hardware and device compatibility and Windows Server 2016 readiness.
Microsoft also offers free virtualization solution accelerators. For example, you can use the MAP Toolkit to accelerate your migration to Hyper-V on Windows Server 2016 by identifying underutilized servers within your infrastructure, which can be potential virtualization candidates.
Microsoft also offers several useful utilities that are either inherent to Windows Server 2016 or are sold as separate products. Some of these utilities are included with the operating system, such as Task Manager, Network Monitor, Performance Monitor, and the enhanced Event Viewer. Data that is collected from these applications can be exported to other applications, such as Excel or Microsoft Access, for inventory and analysis. Other Microsoft utilities like System Center Configuration Manager (SCCM) and System Center Operations Manager (OpsMgr) can also be used; however, they are sold separately.
Task Manager
The Windows Server 2016 Task Manager is similar to its Windows Server 2008, Windows Server 2008 R2 and Windows Server 2012 predecessors in that it offers multifaceted functionality. You can view and monitor processor, memory, application, network, disk, services, user, and process-related information in real time for a given system. This utility is a well-known favorite among IT personnel and is great for getting a quick view of key system health indicators with the lowest performance overhead.
To begin using Task Manager, use any of the following methods:
![]() Right-click the taskbar and select Task Manager.
Right-click the taskbar and select Task Manager.
![]() Press Ctrl+Alt+Delete, and then click Task Manager.
Press Ctrl+Alt+Delete, and then click Task Manager.
![]() Press Ctrl+Shift+Esc or Ctrl+Alt+End (if connected through Remote Desktop).
Press Ctrl+Shift+Esc or Ctrl+Alt+End (if connected through Remote Desktop).
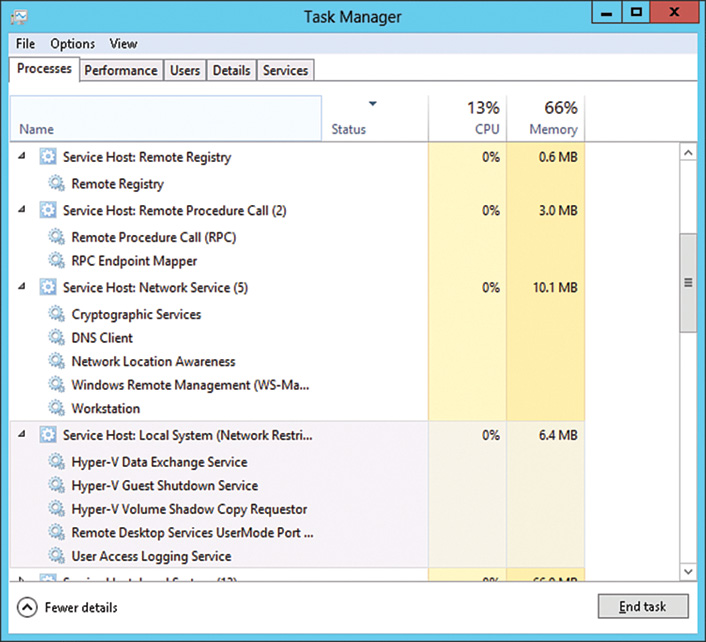
When you start Task Manager, a screen similar to that shown in Figure 33.1 opens.

The default view of Task Manager in Windows Server 2016 is the Summary view, which shows the list of running applications. You can end applications from this view.
The More Details button opens the more familiar Task Manager window, which contains the following five tabs:
![]() Processes—On this tab, you can find basic information about processes currently running on the system. Sorted by application processes and background processes, available data includes CPU and memory usage, process status, command line, and more.
Processes—On this tab, you can find basic information about processes currently running on the system. Sorted by application processes and background processes, available data includes CPU and memory usage, process status, command line, and more.
NOTE
One welcome addition to the Windows Server 2016 version is a better identification of the program using commonly used processes, such as Microsoft Management Console or Services Host. Task Manager now identifies the specific application or service for each instance of the process, as shown in Figure 33.2.
![]() Performance—This tab provides a lot of information about CPU utilization and configuration, memory usage and allocation, and network utilization and configuration. This tab also includes a link to Resource Monitor, a full-featured monitoring tool included in Windows Server 2016 and discussed in depth in this chapter.
Performance—This tab provides a lot of information about CPU utilization and configuration, memory usage and allocation, and network utilization and configuration. This tab also includes a link to Resource Monitor, a full-featured monitoring tool included in Windows Server 2016 and discussed in depth in this chapter.
![]() Users—This tab displays users who are currently logged on to the system and includes the option to disconnect users.
Users—This tab displays users who are currently logged on to the system and includes the option to disconnect users.
![]() Details—The Details tab presents detailed information about running processes in a view familiar from earlier versions of the Task Manager tool. The more in-depth information includes I/O information, session ID, memory pool data, process affinity, and priority.
Details—The Details tab presents detailed information about running processes in a view familiar from earlier versions of the Task Manager tool. The more in-depth information includes I/O information, session ID, memory pool data, process affinity, and priority.
![]() Services—A somewhat recent addition to Task Manager is the Services tab. With it, administrators can see what services are running and can start and stop services without having to load an additional console.
Services—A somewhat recent addition to Task Manager is the Services tab. With it, administrators can see what services are running and can start and stop services without having to load an additional console.
As you can see, Task Manager presents a variety of valuable real-time performance information. This tool is particularly useful for determining what processes or applications are problematic and gives you an overall picture of system health with quick access to terminate applications and processes or identify potential bottlenecks.
There are limitations, however, that prevent it from becoming a useful tool for long-term or historical analysis. For example, Task Manager cannot store collected performance information for future analysis and viewing; it is capable of monitoring only certain aspects of the system’s health, and the information that is displayed pertains only to the local machine. For these reasons alone, Task Manager is typically used for troubleshooting and only the most basic of capacity planning tasks.
Network Monitor
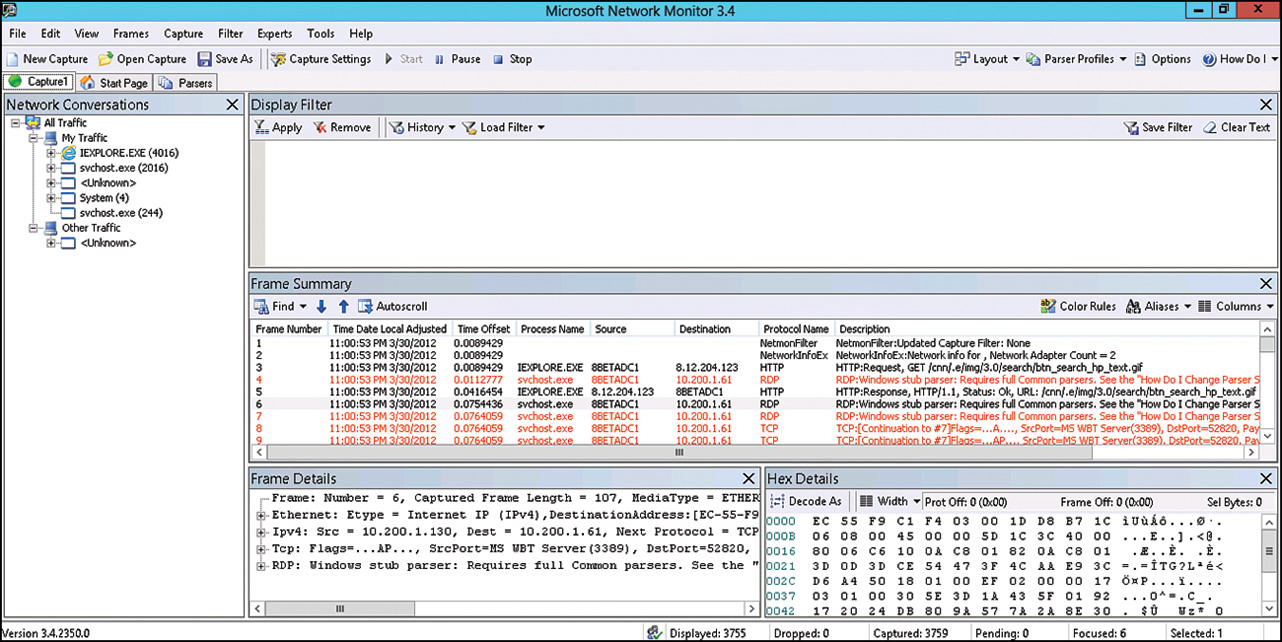
Network Monitor is a crucial tool that system administrators should have in their arsenal. Network Monitor, now in its third version, was overhauled to support the new networking changes that were introduced in Windows 2008 R2. Network Monitor 3.4 includes several enhancements for capturing network traffic and parsing the captured data for use in troubleshooting, capacity analysis, and performance tuning. The next few sections cover using Network Monitor to capture network traffic between two computers, on a wireless connection, over remote-access connections; how to analyze captured data; and how to parse captured data for analysis. You can download Network Monitor 3.4, shown in Figure 33.3, from Microsoft Download Center at www.microsoft.com/download/en/details.aspx?id=4865.

NOTE
The Network Monitor TechNet blog located at http://blogs.technet.com/netmon contains a wealth of information about Network Monitor and capturing and analyzing data.
NOTE
Network Monitor 3.4 is available in IA64, x64, and x86 versions and can run on Windows Server 2012, Windows Server 2008 R2, Windows Server 2008, Windows Server 2003 SP 2, Windows 8, Windows 7, Windows Vista SP1, and Windows XP SP3 systems.
What’s in Network Monitor 3.4
Network Monitor 3.4 expands on the capabilities of the earlier versions of Network Monitor by including several more features and fixes for issues that were discovered in the 3.x versions. Network Monitor 3.4 is very flexible and can even stop a capture based on an event log entry in Event Viewer.
The features in Network Monitor 3.4 include the following:
![]() Support for Windows Server 2016 and 2012, Hyper-V, Windows 8, and Windows 7
Support for Windows Server 2016 and 2012, Hyper-V, Windows 8, and Windows 7
![]() The ability to capture WWAN and tunnel traffic on Window 7 and Windows 8 computers
The ability to capture WWAN and tunnel traffic on Window 7 and Windows 8 computers
![]() Support for both IPv4 and IPv6
Support for both IPv4 and IPv6
Using Network Monitor 3.4
Before you can start using the advanced features of Network Monitor, analyzing captured data, and identifying potential issues and bottlenecks, you need a basic understanding of Network Monitor and how it works.
To capture network traffic, install Network Monitor 3.4 and follow these steps:
1. Run Network Monitor (Start, Microsoft Network Monitor 3.4).
2. Click the New Capture Tab link in the left pane.
3. Click the Start button or press F5 to start capturing traffic.
To apply filters to a captured stream of information, follow these steps:
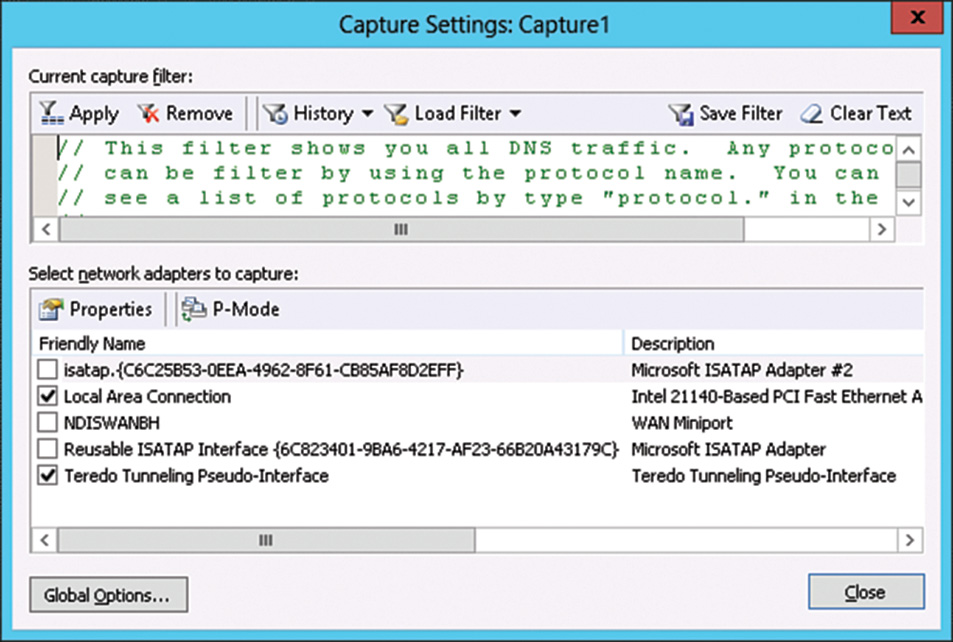
![]() To create a capture filter—With the Capture tab selected, click the Capture Settings button or press F4. Click Load Filter, Standard Filters to select a preconfigured filter that will capture traffic relative to a specific item such as DNS, as shown in Figure 33.4.
To create a capture filter—With the Capture tab selected, click the Capture Settings button or press F4. Click Load Filter, Standard Filters to select a preconfigured filter that will capture traffic relative to a specific item such as DNS, as shown in Figure 33.4.
![]() To create a display filter—From the Filter menu, click Display Filter, Load Filter, Standard Filters to select a preconfigured filter that will only display information relative to a specific item such as DNS from captured data.
To create a display filter—From the Filter menu, click Display Filter, Load Filter, Standard Filters to select a preconfigured filter that will only display information relative to a specific item such as DNS from captured data.
![]() To create a color filter—From the Frames menu, select Color Rules. Click New to create a new rule, select Load Filter, Standard Filters to apply a color effect to specific items such as DNS.
To create a color filter—From the Frames menu, select Color Rules. Click New to create a new rule, select Load Filter, Standard Filters to apply a color effect to specific items such as DNS.
After a capture or display filter has been added, it must be applied, as shown in Figure 33.5. Apply the filters:
![]() To apply a capture filter, open the capture settings and click the Apply button.
To apply a capture filter, open the capture settings and click the Apply button.
![]() To apply a display filter, select the Display Filter pane and click Apply Filter.
To apply a display filter, select the Display Filter pane and click Apply Filter.
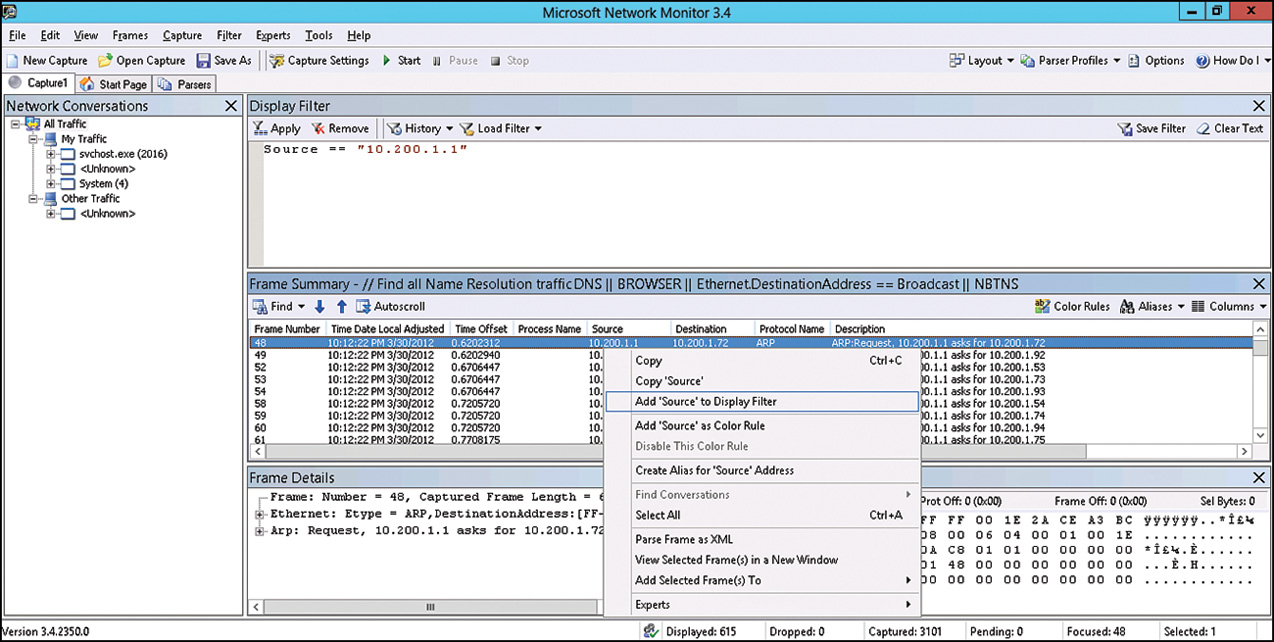
A color rule or display filter can be fine-tuned based on captured data. Hover the mouse over the desired value, right-click, and select Add Property to Color Rule or Display Filter. This action adds a filter condition for the property to equal the value of the selected frame, as shown in Figure 33.6.
To remove a filter, follow these steps:
![]() To remove a capture filter, open the capture settings and click the Remove button.
To remove a capture filter, open the capture settings and click the Remove button.
![]() To remove a display filter, select the Display Filter pane and click Remote.
To remove a display filter, select the Display Filter pane and click Remote.
![]() To remove a color rule, delete the rule from the Color Rules tab of the Options dialog.
To remove a color rule, delete the rule from the Color Rules tab of the Options dialog.
NOTE
Removing a filter does not remove it from the filter list. It just removes it from being applied.
Capturing Network Traffic Between Computers
As outlined previously, Network Monitor enables you to capture wireless, remote, local area network (LAN), and wide area network (WAN) traffic using a remote agent. In some cases, network administrators want to diagnose or monitor a conversation between two computers. The steps necessary to monitor traffic between two different computers are outlined in the following list.
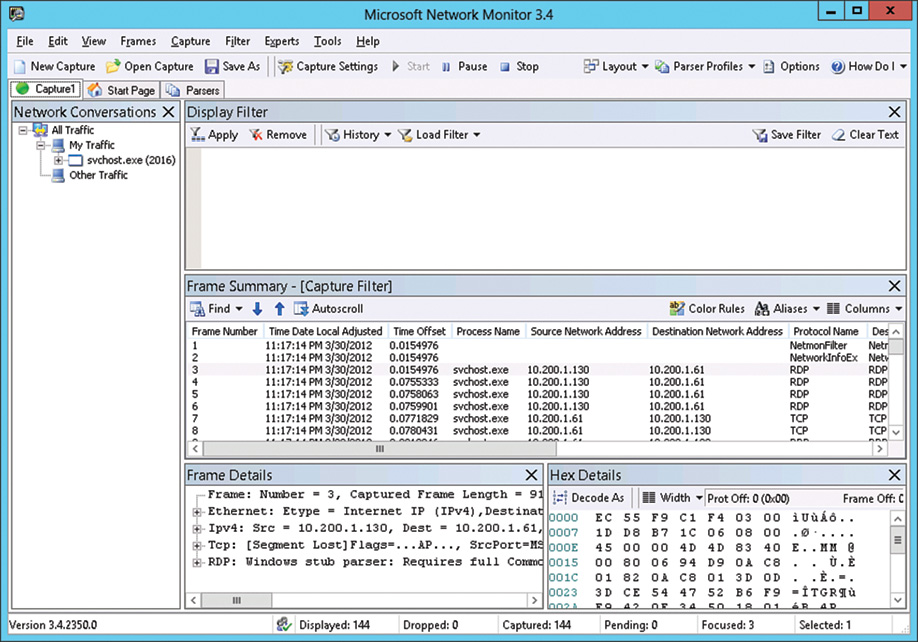
To capture network traffic between two different computers using IPv4 source and destination addresses, as shown in Figure 33.7, follow these steps:
1. In Network Monitor, click the New Capture button on the left.
2. Click the Capture Settings button. Click Load Filter, Standard Filters.
3. Select Addresses, and then IPv4 Addresses.
4. Edit the filter to specify the IP addresses that should be filtered in the Capture Filter window (for example, 192.168.0.100 and Any).
5. Click the Apply button in the Capture Filter pane, and then click Close.
6. Click the Start button on the main Network Monitor menu bar or press the F5 key to start the capture.
Parsing Captured Network Traffic Data
Parsing captured data allows the information to be converted into a format that is more legible to the naked eye. Parsing captured data makes analysis of the captured data easier—in fact, it’s almost essential.
To modify parsing of captured data in Network Monitor, follow these steps:
1. With a capture running or loaded from a saved file, select the Parsers tab in Network Monitor, as shown in Figure 33.8.
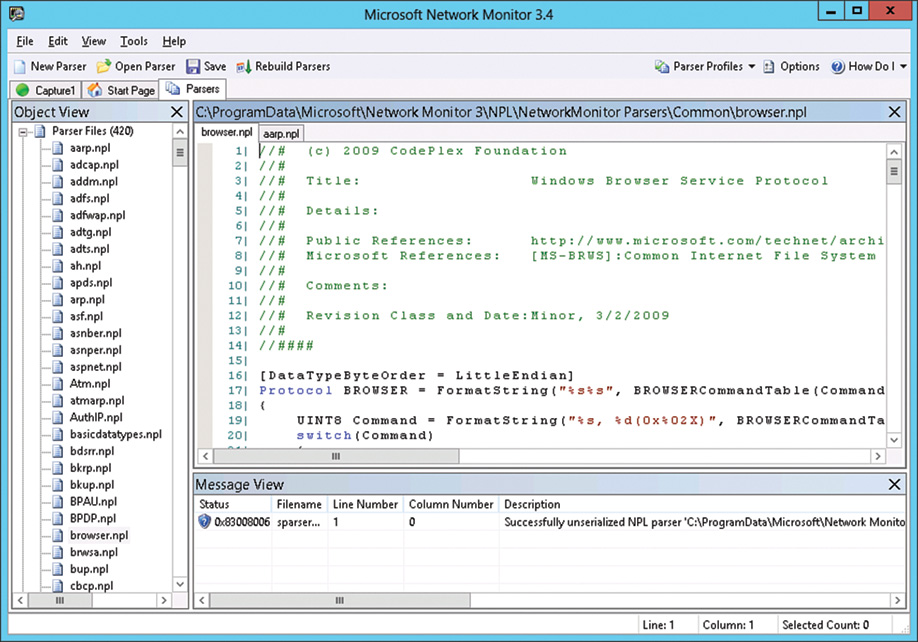
2. Expand the appropriate parsing category and double-click the desired parser to load the parser code into the editor. Parsers use Network Monitor Parser Language (NPL), a simple-to-use language. Help for NPL is included in the Network Monitor Help file.
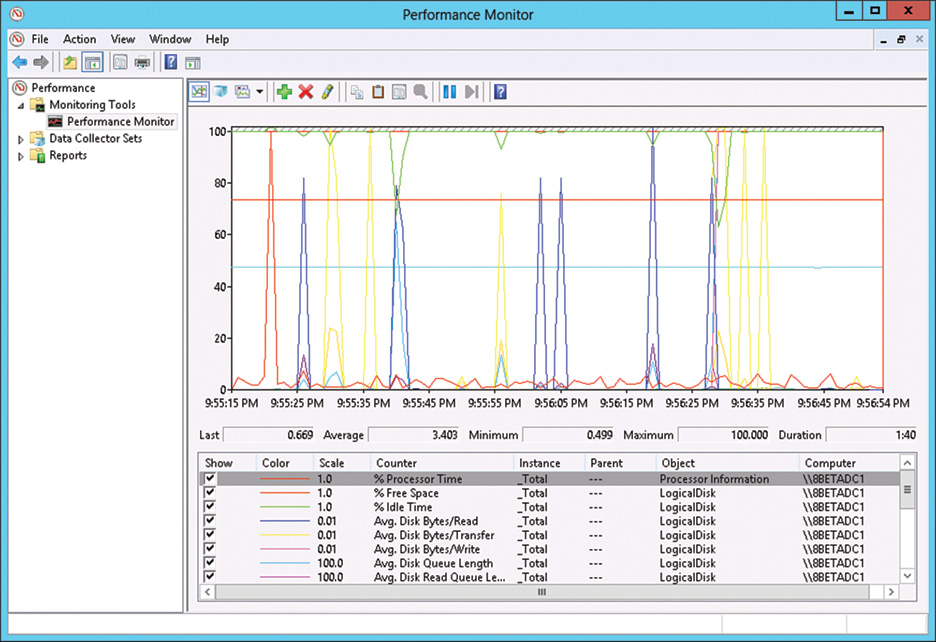
Windows Performance Monitor
The Performance Monitor in Windows Server 2016, shown in Figure 33.9, is structurally similar to Windows Server 2012 and 2008 R2. The Performance Monitor is composed of three main components: monitoring tools such as Performance Monitor, data collector sets, and a reporting component. You can launch Performance Monitor from within the Windows Server 2016 Server Manager or from the Metro UI.

Using Performance Monitor, administrators can identify bottlenecks and pinpoint resource issues with applications, processes, or hardware. Monitoring of these items can help identify and resolve issues, plan for capacity changes, and help establish baselines for use in future analysis. Upon launching the Performance Monitor, a summary of system performance is displayed, showing current memory, disk, processor, and network loads.
Performance Monitor in Action
Many IT professionals rely on the Performance Monitor because it is bundled with the operating system and it allows you to capture and monitor every measurable system object within Windows Server 2016. The tool requires little effort to learn. You can find and start the Performance Monitor by opening Server Manager, clicking Tools, and then selecting the Performance Monitor option. The Performance Monitor, shown in Figure 33.10, is by far the best utility provided in the operating system for capacity-analysis purposes. With this utility, you can analyze data from almost all aspects of the system, both in real time and historically. You can view this data analysis through charts, reports, and logs. The log format can be stored for use later so that you can scrutinize data from succinct periods of time.
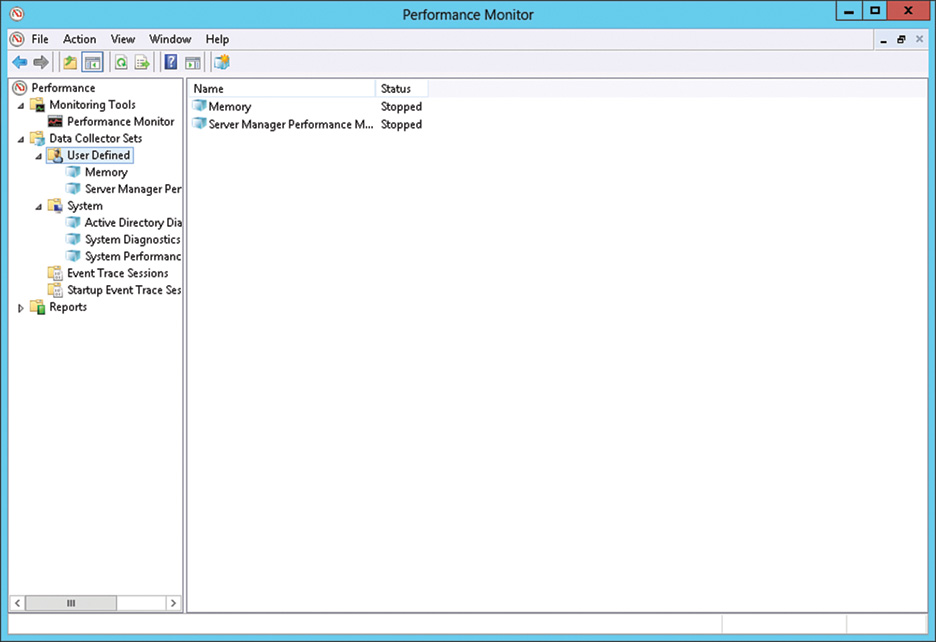
Data Collector Sets
As mentioned previously, data collector sets are a collective grouping of items to be monitored. You can use one of the predefined sets or create your own to group together items that you want to monitor. Data collector sets are useful for several reasons. First, data collectors can be a common theme or a mix of items. For example, you could have one data collector set that monitors only memory or a data collector set that contains myriad items such as memory, disk usage, processor time, and more. Data collector sets can also be scheduled to run when needed. Figure 33.11 shows the Data Collector Sets section of the Performance Monitor.
Reports
As previously discussed, the Performance Monitor includes an updated reporting mechanism and several template performance and diagnostic reports for use. In addition, reports can also be created manually or generated from data collector sets. Three system reports are included for diagnosing and assessing system performance: Active Directory Diagnostics, System Diagnostics, and System Performance. The following steps outline the process to view a System Diagnostics report. Figure 33.12 shows a sample System Diagnostics report.

To create and view reports in Performance Monitor, follow these steps:
1. Expand Data Collector Sets and System in the console tree of Performance Monitor.
2. Right-click either the System Diagnostics or System Performance sets and select Start. Windows will begin collecting data for the report.
3. When you have collected enough data, right-click the collection set again and select Stop.
4. Expand Reports, System and click the collection set you chose earlier. Double-click the report listed under that performance set.
The report will be compiled and displayed, as in Figure 33.12.
Other Microsoft Assessment and Planning Tools
Several other products and tools are available from Microsoft to assist with proper capacity analysis and performance monitoring. Some of these tools are available for purchase separately or can be downloaded for free. Selecting the right tool or product depends on the goal you are trying to accomplish. For example, if you want to implement thresholds for the amount of resources an application or process is allowed to consume, System Center Operations Manager can be deployed if you want to be notified when critical processes behave abnormally on production servers.
Discussing each of these tools in depth is beyond the scope of this book; however, a basic understanding and overview of their purposes will help you make an informed decision when selecting the right technologies for analyzing system resources, availability, and performance.
Assessment and Planning Solution Tool
As mentioned earlier in the chapter, the Microsoft Assessment and Planning Toolkit (MAP) provides a solution to IT personnel when faced with questions like “Which product should we buy or deploy?” or “Are we ready for Windows Server 2016?” Granted, there are multiple approaches to tackling questions like these; however, Microsoft has again developed a tool that will do most of the work for you. The Assessment and Planning Solution Tool inventories and assesses systems, hardware, and software and makes product and technology recommendations based on those results. The discovery and readiness tools included in the latest version of MAP include the following business scenarios: Windows Server 2016, Windows Server 2012, Windows Server 2008 R2, Windows 7 and IE 9, Office 365, Microsoft Azure, SQL Server 2016 and 2012, Office 2010, and more. You can download the Assessment and Planning Solution Tool from the Microsoft Download site at www.microsoft.com/downloads/.
System Center Operations Manager 2012
System Center Operations Manager (OpsMgr) 2016 provides substantial improvements on earlier versions in availability, scalability, and monitoring of heterogeneous systems. OpsMgr is a mature comprehensive monitoring and reporting solution that reports on conditions related to Capacity Analysis and Performance Optimization services, system, and network performance, and alerts administrators when problems arise (e.g., when critical services have failed to start, when CPU usage consistently stays above a designated threshold, or when excessive paging is observed by the OpsMgr agent). OpsMgr integrates directly with Active Directory, Windows Server 2016, and most other Microsoft technologies to provide an overall solution to help automate monitoring of critical systems and processes. OpsMgr uses management packs specific to the technology, such as the Windows Server 2016 baseline operating system, Exchange or Internet Information Services (IIS), so little configuration is needed out of the box.
Third-Party Toolset
Without a doubt, many third-party utilities are excellent for capacity-analysis and performance-monitoring purposes. Most of them provide additional functionality not found in Windows Server 2016’s Performance Monitor and other tools, but they have a cost and might have special requirements for deployment and integration into the organization’s network. You might want to evaluate some third-party utilities to get a more thorough understanding of how they might offer more features than Microsoft solutions. Generally speaking, these utilities enhance the functionality that’s inherent to Microsoft monitoring solutions, such as scheduling, an enhanced level of reporting functionality, superior storage capabilities, the ability to monitor non-Windows systems, or algorithms for future trend analysis. Table 33.2 lists some of these third-party tools.
TABLE 33.2 Third-Party Capacity-Planning and Monitoring Tools
Utility Name |
Company |
Website |
AppManager Suite |
NetIQ Corporation |
|
BMC ProactiveNet Performance Management |
BMC Software |
|
HP Service Health Optimizer |
HP |
|
Longitude |
Heroix |
|
NSM |
CA |
Although it might be true that most third-party capacity-analysis and performance-monitoring products might add more or different functionality to your capacity-analysis and performance-monitoring procedures or goals, there are still pros and cons to using them instead of the free tools included with Windows Server 2016 or other solutions available from Microsoft. The key is to decide what you need to adequately and efficiently perform capacity-analysis and performance-monitoring procedures in your environment. Taking the time to research and experiment with the different solutions available today, from Microsoft and others, will only benefit you in making an informed decision for managing your Windows Server 2016 environment.
Monitoring System Performance
Capacity analysis is not about how much information you can collect; it is about collecting the appropriate system health indicators and the right amount of information. Without a doubt, you can capture and monitor an overwhelming amount of information from performance counters. There are more than 1,000 counters, so you want to carefully choose what to monitor. Otherwise, you might collect so much information that the data will be hard to manage and difficult to decipher. Keep in mind that more is not necessarily better with regard to capacity analysis. This process is more about efficiency. Therefore, you need to tailor your capacity-analysis monitoring as accurately as possible to how the server is configured.
Every Windows Server 2016 server has a common set of resources that can affect performance, reliability, stability, and availability. For this reason, it is important that you monitor this common set of resources (namely CPU, memory, disk, and network utilization).
In addition to the common set of resources, the functions that the Windows Server 2016 server performs can influence what you should consider monitoring. So, for example, you would monitor certain aspects of system performance on file servers differently than you would for a domain controller running on Windows Server 2016 Active Directory Domain Services (AD DS). There are many functional roles (such as file and print sharing, application clustering, database functions, web server duties, domain controller roles, and more) that Windows Server 2016 can perform, and it is important to understand all those roles that pertain to each server system. By identifying these functions and monitoring them along with the common set of resources, you gain much greater control and understanding of the system.
The following sections go more in-depth on what specific items you should monitor for the different components that constitute the common set of resources. It’s important to realize, though, that there are several other items that should be considered when monitoring in addition to the ones described in this chapter. You should consider the following material a baseline of the minimum number of things to begin your capacity-analysis and performance-optimization procedures.
Key Elements to Monitor for Bottlenecks
As mentioned, four resources compose the common set of resources: memory and pagefile usage, processor, disk subsystem, and network subsystem. They are also the most common contributors to performance bottlenecks. A bottleneck can be defined in two ways. The most common perception of a bottleneck is that it is the slowest part of your system. It can either be hardware or software, but generally speaking, hardware is usually faster than software. When a resource is overburdened or just not equipped to handle higher workload capacities, the system might experience a slowdown in performance. For any system, the slowest component of the system is, by definition, considered the bottleneck. For example, a web server might be equipped with ample RAM, disk space, and a high-speed network interface card (NIC), but if the disk subsystem has older drives that are relatively slow, the web server might not be able to effectively handle requests. The bottleneck (that is, the antiquated disk subsystem) can drag the other resources down.
A less-common, but equally important, form of bottleneck is one where a system has significantly more RAM, processors, or other system resources than the application requires. In these cases, the system creates extremely large pagefiles, has to manage very large sets of disk or memory sets, but yet never uses the resources. When an application needs to access memory, processors, or disks, the system might be busy managing the idle resource, thus creating an unnecessary bottleneck caused by having too many resources allocated to a system. Thus, performance optimization means not having too few resources, but also means not having too many resources allocated to a system.
Monitoring System Memory and Pagefile Usage
Available system memory is usually the most common source for performance problems on a system. The reason is simply that incorrect amounts of memory are usually installed on a Windows Server 2016 system. Windows Server 2016 tends to consume a lot of memory. Fortunately, the easiest and most economical way to resolve the performance issue is to configure the system with additional memory. This can significantly boost performance and upgrade reliability.
There are many significant counters in the memory object that could help determine system memory requirements. Most network environments shouldn’t need to consistently monitor every single counter to get accurate representations of performance. For long-term monitoring, two very important counters can give you a fairly accurate picture of memory pressure: Page Faults/sec and Pages/sec Memory. These two memory counters alone can indicate whether the system is properly configured and experiencing memory pressure. Table 33.3 describes the counters necessary to monitor memory and pagefile usage.
TABLE 33.3 Important Counters and Descriptions Related to Memory Behavior
Object |
Counter |
Description |
Memory |
Committed Bytes |
Monitors how much memory (in bytes) has been allocated by the processes. As this number increases above available RAM, so does the size of the pagefile (because paging has increased). |
Memory |
Pages/sec |
Displays the number of pages that are read from or written to the disk. |
Memory |
Pages Output/sec |
Displays virtual memory pages written to the pagefile per second. Monitor this counter to identify paging as a bottleneck. |
Memory |
Page Faults/sec |
Reports both soft and hard faults. |
Process |
Working Set, _Total |
Displays the amount of virtual memory that is actually in use. |
Paging file |
%pagefile in use |
Reports the percentage of the paging file that is actually in use. This counter is used to determine whether the Windows pagefile is a potential bottleneck. If this counter remains above 50% or 75% consistently, consider increasing the pagefile size or moving the pagefile to a different disk. |
By default, the Memory tab in Resource Monitor, shown in Figure 33.13, provides a good high-level view of current memory activity. For more advanced monitoring of memory and pagefile activity, use the Performance Monitor snap-in.

Systems experience page faults when a process requires code or data that it cannot find in its working set. A working set is the amount of memory that is committed to a particular process. When this happens, the process has to retrieve the code or data in another part of physical memory (referred to as a soft fault) or, in the worst case, has to retrieve it from the disk subsystem (a hard fault). Systems today can handle a large number of soft faults without significant performance hits. However, because hard faults require disk subsystem access, they can cause the process to wait significantly, which can drag performance to a crawl. The difference between memory and disk subsystem access speeds is exponential even with the fastest solid state drives available. The Memory section of the Resource Monitor in Performance Monitor includes columns that display working sets and hard faults by default.
The Page Faults/sec counter reports both soft and hard faults. It’s not uncommon to see this counter displaying rather large numbers. Depending on the workload placed on the system, this counter can display several hundred faults per second. When it gets beyond several hundred page faults per second for long durations, you should begin checking other memory counters to identify whether a bottleneck exists.
Probably the most important memory counter is Pages/sec. It reveals the number of pages read from or written to disk and is, therefore, a direct representation of the number of hard page faults the system is experiencing. Microsoft recommends upgrading the amount of memory in systems that are seeing Pages/sec values consistently averaging above five pages per second. In actuality, you’ll begin noticing slower performance when this value is consistently higher than 20. So, it’s important to carefully watch this counter as it nudges higher than 10 pages per second.
NOTE
The Pages/sec counter is also particularly useful in determining whether a system is thrashing. Thrashing is a term used to describe systems experiencing more than 100 pages per second. Thrashing should never be allowed to occur on Windows Server 2016 systems because the reliance on the disk subsystem to resolve memory faults greatly affects how efficiently the system can sustain workloads.
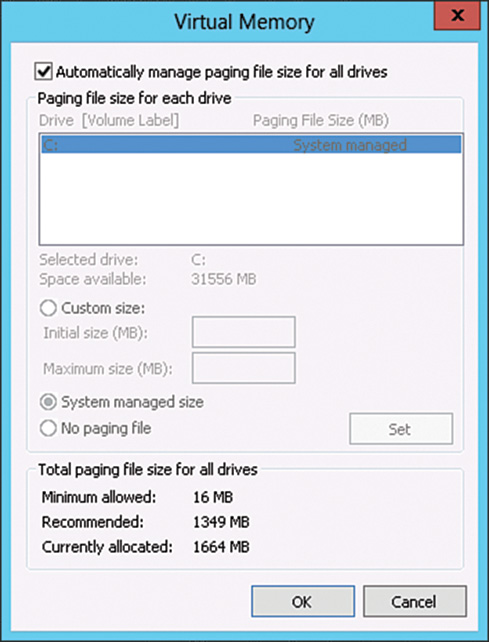
System memory (RAM) is limited in size, and Windows supplements the use of RAM with virtual memory, which is not as limited. Windows will begin paging to disk when all RAM is being consumed, which, in turn, frees RAM for new applications and processes. Virtual memory resides in the pagefile.sys file or in specific application-designated memory-mapped files. The primary paging file, pagefile.sys is usually located in the root of the system drive and can be relocated or configured for performance reasons. Each disk can contain a pagefile. The location and size of the pagefile is configured under the Virtual Memory section, shown in Figure 33.14.
To access the Performance Options window, follow these steps:
1. Open the metro UI and type Control Panel and launch the Control Panel from the search results.
2. Click the System and Security category and then the System control panel.
3. Click the Advanced System Settings link on the left.
4. When the System Properties window opens, click the Settings button under the Performance section.
5. Select the Advanced tab.
6. Click Change under Virtual Memory.
TIP
Windows usually automatically handles and increases the size of pagefile.sys as needed; however, in some cases, you might want to increase performance and manage virtual memory settings yourself. Keeping the default pagefile on the system drive and adding a second pagefile to another hard disk can significantly improve performance.
Spanning virtual memory across multiple disks or simply placing the pagefile.sys on another, less-used disk will also allow Windows to run faster. Just ensure that the other disk is not slower than the disk pagefile.sys is currently on. The more physical memory a system has, the more virtual memory will be allocated.
Analyzing Processor Usage
Most often, the processor resource is the first one analyzed when system performance decreases noticeably. For capacity-analysis purposes, you should monitor two counters: % Processor Time and Interrupts/sec.
The % Processor Time counter indicates the percentage of overall processor utilization. If the system has more than one processor, an instance for each one is included along with a total (combined) value counter. If this counter averages a usage rate of 50% or greater for long durations, you should first consult other system counters to identify any processes that might be improperly using the processors or consider upgrading the processor or processors. Generally speaking, consistent utilization in the 50% range doesn’t necessarily adversely affect how the system handles given workloads. When the average processor utilization spills over the 65% or higher range, performance might become intolerable. If you have multiple processors installed in the system, use the % Total Processor Time counter to determine the average usage of all processors.
The Interrupts/sec counter is also a good guide of processor health. It indicates the number of device interrupts that the processor (either hardware or software driven) is handling per second. Like the Page Faults/sec counter mentioned in the section “Monitoring System Memory and Pagefile Usage,” this counter might display very high numbers (in the thousands) without significantly impacting how the system handles workloads.
Conditions that could indicate a processor bottleneck include the following:
![]() Average of % Processor Time is consistently over 60% to 70%. In addition, spikes that occur frequently at 90% or greater could also indicate a bottleneck even if the average drops below the 60% to 70% mark.
Average of % Processor Time is consistently over 60% to 70%. In addition, spikes that occur frequently at 90% or greater could also indicate a bottleneck even if the average drops below the 60% to 70% mark.
![]() Maximum of % Processor Time is consistently over 90%.
Maximum of % Processor Time is consistently over 90%.
![]() Average of the System Performance Counter; Context Switches/second is consistently greater than 20,000.
Average of the System Performance Counter; Context Switches/second is consistently greater than 20,000.
![]() The System Performance Counter; Processor Queue Length is consistently greater than 2.
The System Performance Counter; Processor Queue Length is consistently greater than 2.
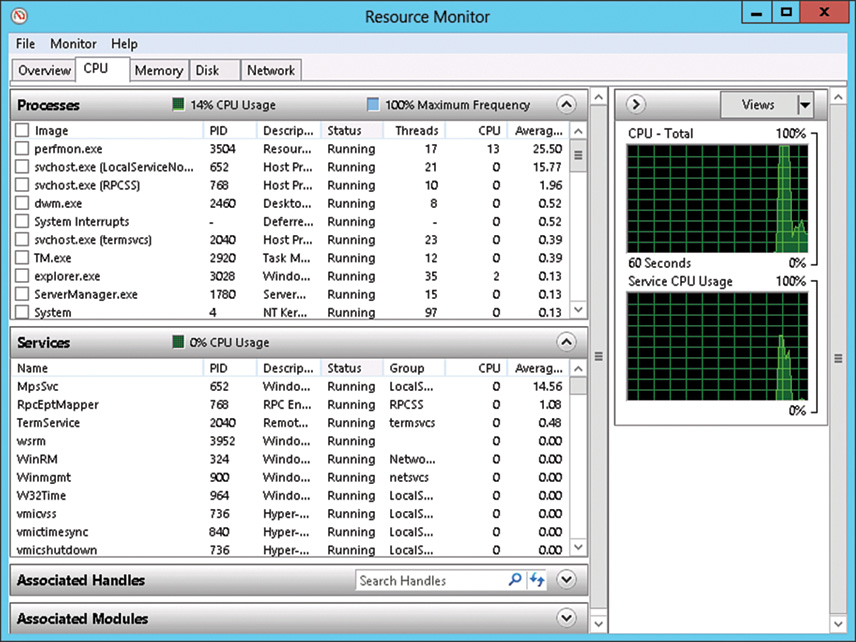
By default, the CPU tab in Resource Monitor, shown in Figure 33.15, provides a good high-level view of current processor activity. For more advanced monitoring of processors, use the Performance Monitor snap-in with the counters discussed previously.
Evaluating the Disk Subsystem
Hard disk drives and hard disk controllers are the two main components of the disk subsystem. The two objects that gauge hard disk performance are Physical and Logical Disk. Although the disk subsystem components are becoming more and more powerful, they are often a common bottleneck because their speeds are exponentially slower than other resources. The effects, though, can be minimal and maybe even unnoticeable, depending on the system configuration.
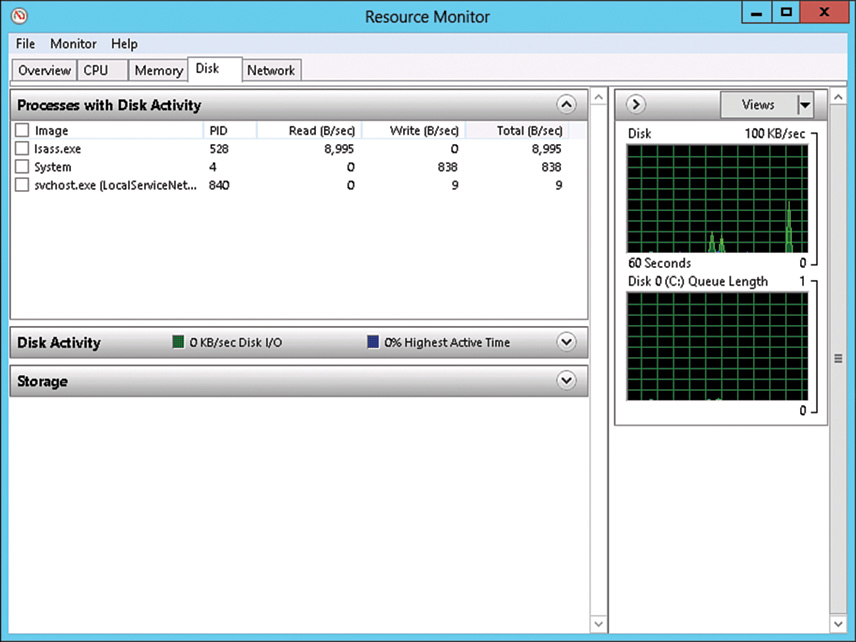
To support the Resource Monitor’s Disk section, the physical and logical disk counters are enabled by default in Windows Server 2016. The Disk section in Resource Monitor, shown in Figure 33.16, provides a good high-level view of current physical and logical disk activity (combined). For more advanced monitoring of disk activity, use the Performance Monitor component with the desired counters found in the Physical Disk and Logical Disk sections.
Monitoring with the Physical and Logical Disk objects does come with a small price. Each object requires a little resource overhead when you use them for monitoring. As a result, you might want to keep them disabled unless you are going to use them for monitoring purposes.
So, what specific disk subsystem counters should be monitored? The most informative counters for the disk subsystem are % Disk Time and Avg. Disk Queue Length. The % Disk Time counter monitors the time that the selected physical or logical drive spends servicing read and write requests. The Avg. Disk Queue Length monitors the number of requests not yet serviced on the physical or logical drive. The Avg. Disk Queue length value is an interval average; it is a mathematical representation of the number of delays the drive is experiencing. If the delay is frequently greater than two, the disks are not equipped to service the workload and delays in performance might occur.
Monitoring the Network Subsystem
The network subsystem is by far one of the most difficult subsystems to monitor because of the many different variables. The number of protocols used in the network, NICs, network-based applications, topologies, subnetting, and more play vital roles in the network, but they also add to its complexity when you’re trying to determine bottlenecks. Each network environment has different variables; therefore, the counters that you’ll want to monitor will vary.
The information that you’ll want to gain from monitoring the network pertains to network activity and throughput. You can find this information with the Performance Monitor alone, but it will be difficult at best. Instead, it is important to use other tools, such as Network Monitor, discussed earlier in this chapter in the section “Network Monitor,” in conjunction with Performance Monitor, to get the best representation of network performance as possible. You might also consider using third-party network-analysis tools such as network sniffers to ease monitoring and analysis efforts. Using these tools simultaneously can broaden the scope of monitoring and more accurately depict what is happening on the wire.
Because the TCP/IP suite is the underlying set of protocols for a Windows Server 2016 network subsystem, this discussion of capacity analysis focuses on this protocol.
NOTE
Windows Server 2016, Windows Server 2012, Windows 10, and Windows 8 deliver enhancement to the existing quality of service (QoS) network traffic–shaping solution that is available in earlier versions. QoS uses Group Policy to shape and give priority to network traffic without recoding applications or making major changes to the network. Network traffic can be “shaped” based on the application sending the data, TCP/UDP addresses (source/destination), TCP or UDP protocols, and the ports used by TCP or UDP, or any combination thereof. You can find more information about QoS at Microsoft TechNet: http://technet.microsoft.com/en-us/network/bb530836.aspx.
Several different network performance objects relate to TCP/IP, including ICMP, IPv4, IPv6, Network Interface, TCPv4, UDPv6, and more. Other counters, such as FTP Server and WINS Server, are added after these services are installed. Because entire books are dedicated to optimizing TCP/IP, this section focuses on a few important counters that you should monitor for capacity-analysis purposes.
First, examining error counters, such as Network Interface: Packets Received Errors or Packets Outbound Errors, is extremely useful in determining whether traffic is easily traversing the network. The greater the number of errors indicates that packets must be present, causing more network traffic. If a high number of errors are persistent on the network, throughput will suffer. This can be caused by a bad NIC, unreliable links, and so on.
If network throughput appears to be slowing because of excessive traffic, keep a close watch on the traffic being generated from network-based services, such as the ones described in Table 33.4. Figure 33.17 shows these items being recorded in Performance Monitor.
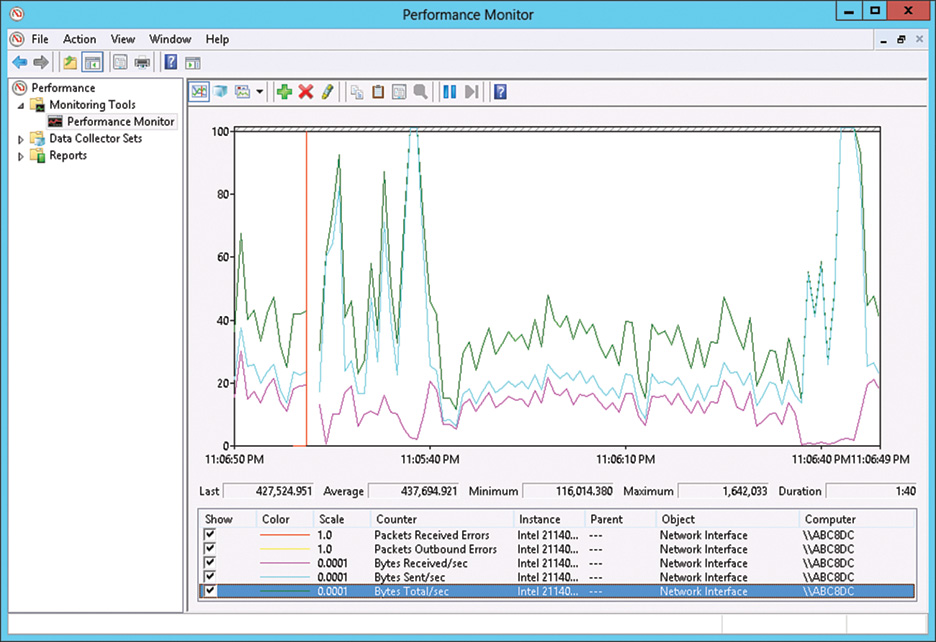
TABLE 33.4 Network-Based Service Counters Used to Monitor Network Traffic
Object |
Counter |
Description |
Network Interface |
Current Bandwidth |
Displays used bandwidth for the selected network adapter |
Server |
Bytes Total/sec |
Monitors the network traffic generated by the Server service |
Redirector |
Bytes Total/sec |
Processes data bytes received for statistical calculations |
NBT Connection |
Bytes Total/sec |
Monitors the network traffic generated by NetBIOS over TCP connections |
Optimizing Performance by Server Roles
In addition to monitoring the common set of bottlenecks (memory, processor, disk subsystem, and network subsystem), the functional roles of the server influence what other counters you should monitor. The following sections outline some of the most common roles for Windows Server 2016 that require the use of additional performance counters for analyzing system behavior, establishing baselines, and ensuring system availability and scalability.
Microsoft also makes several other tools available that will analyze systems and recommend changes. Ensuring a system is properly configured to deliver services for the role it supports is essential before performance monitoring and capacity planning can be taken seriously.
Domain Controllers
A Windows Server 2016 domain controller (DC) houses Active Directory Domain Services (AD DS) and may have additional roles such as being responsible for one or more Operations Master (OM) roles (schema master, domain naming master, relative ID master, PDC emulator, or infrastructure master) or a Global Catalog (GC) server. Also, depending on the size and design of the system, a DC might serve many other functional roles, such as domain name system (DNS) or Dynamic Host Configuration Protocol (DHCP). In this section, AD, replication, and DNS monitoring are explored.
Monitoring Active Directory and Active Directory Replication
AD DS is the heart of Windows Server 2016 domains and has been the directory of choice for years. AD has continuously been improved with each release, including performance enhancements. AD DS is used for many different facets, including authentication, authorization, encryption, and group policies. Because AD plays a vital role in a Windows Server 2016 network environment and organizations rely on it heavily for communication and user management, it must perform its responsibilities as efficiently as possible. You can find more information about Windows Server 2016’s AD in Chapter 4, “Active Directory Domain Services Primer.” Each facet by itself can be optimized, but this section focuses on the Directory Services and Database objects. Organizations that take advantage of System Center Operations Manager can take advantage of the management pack available for Active Directory.
The Directory Services Performance Monitor object provides various AD performance indicators and statistics that are useful for determining AD’s workload capacity. You can use many of these counters to determine current workloads and how these workloads can affect other system resources. This object has quite a few counters, so it’s recommended to identify your specific monitoring needs in advance. The naming convention of many counters is used to group them by component, such as Lightweight Directory Access Protocol (LDAP), DRA (directory replication agent), DS, and Security Accounts Manager (SAM). With this combination of counters, you can review the status of every component of AD DS and determine whether the system is overloaded and whether AD performance is impacted.
Measuring AD DS replication performance is a complex process because of the many variables associated with replication, including the following:
![]() Intrasite versus intersite replication
Intrasite versus intersite replication
![]() The compression being used (if any)
The compression being used (if any)
![]() Available bandwidth
Available bandwidth
![]() Inbound versus outbound replication traffic
Inbound versus outbound replication traffic
Fortunately, there are performance counters for every possible AD replication scenario. These counters are located within the Directory Services object and are prefixed by the primary process that is responsible for AD DS replication: the DRA. Therefore, to monitor AD replication, you need to choose those counters beginning with DRA.
Like most other server products, AD DS uses a database, and its performance should also be monitored to provide an accurate reflection of AD DS performance. Understanding a domain controller’s overall system resource usage and the performance of AD DS will help you align future upgrades and changes with capacity and performance needs. As companies continue to grow, it is essential that the systems be able to grow with them, especially with regard to something critical like AD DS. Many counters are available, and Table 33.5 describes some of the relevant counters necessary to monitor AD DS and the database. This is only a sample list, and additional counters might need to be added, depending on the desired outcome of the monitoring and specific AD DS functionality.
TABLE 33.5 Performance Counters Relative to AD DS Performance and Replication
Object |
Counter |
Description |
Directory Services |
DRA Inbound Full Sync Objects Remaining |
Objects remaining before synchronization is marked complete. |
Directory Services |
DRA Inbound Object Updates Remaining in Packet |
Objects remaining that need to be processed by the domain controller. Indicates delay in applying changes to the database. |
Directory Services |
DRA Pending Replication Synchronizations |
Number of queued directory synchronizations remaining. Indicates replication backlog. |
Directory Services |
LDAP Client Sessions |
Sessions generated from LDAP clients. |
Directory Services |
LDAP Searches/sec |
Search queries performed by LDAP clients per second. |
Directory Services |
LDAP Writes/sec |
Number of writes per second from LDAP clients. |
Security Systemwide Statistics |
Kerberos Authentications |
Client authentication tickets passed to the domain controller per second. |
Security Systemwide Statistics |
NTLM Authentications |
NTLM authentication requests served per second. |
Database |
Database Cache % Hit |
Percentage of page requests for the database file that were fulfilled by the database cache without causing a file operation. If this percentage is low (85% or lower), you might consider adding more memory. |
Database |
Database Cache Size |
Amount of system memory used by the database cache manager to hold commonly used information from the database to prevent file operations. |
Monitoring DNS
The domain name system (DNS) has been the primary name-resolution mechanism in almost all networks, and this continues with Windows Server 2016. For more information about DNS, see Chapter 9, “Domain Name System, WINS, and DNSSEC.” Numerous counters are available for monitoring various aspects of DNS in Windows Server 2016. The most important categories in terms of capacity analysis are name-resolution response times and workloads and replication performance.
The counters listed in Table 33.6 are used to compute name query traffic and the workload that the DNS server is servicing. These counters should be monitored along with the common set of bottlenecks to determine the system’s health under various workload conditions. If users are noticing slower responses, you can compare the query workload usage growth with your performance information from memory, processor, disk subsystem, and network subsystem counters.
TABLE 33.6 Performance Counters to Monitor DNS
Counter |
Description |
Dynamic Update Received/sec |
The average number of dynamic update requests received by the DNS server in each second |
Recursive Queries/sec |
The average number of recursive queries received by the DNS server in each second |
Recursive Query Failure/sec |
The average number of recursive query failures in each second |
Secure Update Received/sec |
The average number of secure update requests received by the DNS server in each second |
TCP Query Received/sec |
The average number of TCP queries received by the DNS server in each second |
TCP Response Sent/sec |
The average number of TCP responses sent by the DNS server in each second |
Total Query Received/sec |
The average number of queries received by the DNS server in each second |
Total Response Sent/sec |
The average number of responses sent by the DNS server in each second |
UDP Query Received/sec |
The average number of UDP queries received by the DNS server in each second |
UDP Response Sent/sec |
The average number of UDP responses sent by the DNS server in each second |
Comparing results with other DNS servers in the environment can also help you to determine whether you should relinquish some of the name query responsibility to other DNS servers that are less busy.
Replication performance is another important aspect of DNS. Windows Server 2016 supports legacy DNS replication, also known as zone transfers, which populate information from the primary DNS to any secondary servers. There are two types of legacy DNS replication: incremental (propagating only changes to save bandwidth) and full (the entire zone file is replicated to secondary servers).
Asynchronous full zone transfers (AXFR) occur on the initial transfer, and then the incremental zone transfers (IXFR) are performed thereafter. The performance counters for both AXFR and IXFR (see Table 33.7) measure both the requests and successful transfers. It is important to note that if your network environment integrates DNS with non-Windows systems, it is recommended that those systems support IXFR.
NOTE
If your network environment is fully AD integrated, the counters listed in Table 33.7 will all be zero because AD-integrated DNS replicates with AD DS.
TABLE 33.7 DNS Zone Transfer Counters
Counter |
Description |
AXFR Request Received |
Total number of full zone transfer requests received by the DNS service when operating as a master server for a zone |
AXFR Request Sent |
Total number of full zone transfer requests sent by the DNS service when operating as a secondary server for a zone |
AXFR Response Received |
Total number of full zone transfer requests received by the DNS service when operating as a secondary server for a zone |
AXFR Success Received |
Total number of full zone transfers received by the DNS service when operating as a secondary server for a zone |
AXFR Success Sent |
Total number of full zone transfers successfully sent by the DNS service when operating as a master server for a zone |
IXFR Request Received |
Total number of incremental zone transfer requests received by the master DNS server |
IXFR Request Sent |
Total number of incremental zone transfer requests sent by the secondary DNS server |
IXFR Response Received |
Total number of incremental zone transfer responses received by the secondary DNS server |
IXFR Success Received |
Total number of successful incremental zone transfers received by the secondary DNS server |
IXFR Success Sent |
Total number of successful incremental zone transfers sent by the master DNS server |
Remote Desktop Services Server
Remote Desktop Services Server has its own performance objects for the Performance Monitor, still called the Terminal Services Session and Terminal Services objects. It provides resource statistics such as errors, cache activity, network traffic from Remote Desktop Server, and other session-specific activity. Many of these counters are similar to those found in the Process object. Some examples include % Privileged Time, % Processor Time, % User Time, Working Set, Working Set Peak, and so on.
You can find a comprehensive list of all performance counters and descriptions relative to Remote Desktop Services at http://support.microsoft.com/kb/186536. You can find more information about Remote Desktop Services in Chapter 23, “Remote Desktop Services.”
Three important areas to always monitor for Remote Desktop Session Host capacity analysis are the memory, processor, and application processes for each session. Application processes are by far the hardest to monitor and control because of the extreme variances in programmatic behavior. For example, all applications might be 32-bit, but some might not be certified to run on Windows Server 2016. You might also have in-house applications running on Remote Desktop Services that might be poorly designed or too resource intensive for the workloads they are performing.
Hyper-V Servers
Deployment of virtual servers and consolidation of hardware is becoming more and more prevalent in the business world. When multiple servers are running in a virtual environment on a single physical hardware platform using the Hyper-V role, performance monitoring and tuning become essential to maximize the density of the virtual systems. If three or four virtual servers are running on a system and the memory and processors are not allocated to the virtual guest session that could use the resources, virtual host resources are not being utilized efficiently. In addition to monitoring the common items of memory, disk, network, and CPU, dozens of counters provide information about the host and guest processes. Monitoring counters for guest sessions can be very valuable in determining whether specific guest sessions are monopolizing host resources. The categories that provide guest related counter are Hyper-V Dynamic Memory VM, Hyper-V Hypervisor Virtual Processor, Hyper-V Virtual IDE Controller and Hyper-V Virtual Network Adapter. Many of the counters in these categorize can be configured to measure a single guest session or the total of all guest sessions. For example, Figure 33.18 shows the available counters for the Hyper-V Virtual IDE Controller object. In addition to the counters, Hyper-V performance can also be monitored using Microsoft System Center Virtual Machine Manager and System Center Operations Manager, added when virtualization is running on the Windows Server 2016 host.

Summary
Capacity planning and performance analysis are critical tasks in ensuring that systems are running efficiently and effectively in the network environment. Too much capacity being allocated to systems indicates resources are being wasted and not used efficiently, which in the long run can cause an organization to overspend in their IT budgets and not get the value out of IT spending. Too little capacity in production systems, and performance suffers in serving users, and this condition also creates a hardship on servers that can ultimately cause system failure.
By properly analyzing the operational functions of a network, a network administrator can consolidate servers or virtualize servers to gain more density in system resources, which can result in additional physical servers that can ultimately be used for other purposes, such as disaster recovery failover servers or cluster servers providing high availability of IT resources.
Although it is easy to get caught up in daily administration and firefighting, it is important to step back and begin capacity-analysis and performance-optimization processes and procedures. These processes and procedures can minimize the environment’s complexity, help IT personnel gain control over the environment, assist in anticipating future resource requirements, and, ultimately, reduce costs, and keep users of the network happy.
![]() Spend time performing capacity analysis to save time troubleshooting and firefighting.
Spend time performing capacity analysis to save time troubleshooting and firefighting.
![]() Use capacity-analysis processes to help weed out the unknowns.
Use capacity-analysis processes to help weed out the unknowns.
![]() Establish systemwide policies and procedures to begin to proactively manage your system.
Establish systemwide policies and procedures to begin to proactively manage your system.
![]() After establishing systemwide policies and procedures, start characterizing system workloads.
After establishing systemwide policies and procedures, start characterizing system workloads.
![]() Use performance metrics and other variables such as workload characterization, vendor requirements or recommendations, industry-recognized benchmarks, and the data that you collect to establish a baseline.
Use performance metrics and other variables such as workload characterization, vendor requirements or recommendations, industry-recognized benchmarks, and the data that you collect to establish a baseline.
![]() Use the benchmark results only as a guideline or starting point.
Use the benchmark results only as a guideline or starting point.
![]() Use the Task Manager or the Resource Monitor in Performance Monitor to quickly view performance.
Use the Task Manager or the Resource Monitor in Performance Monitor to quickly view performance.
![]() Use the Performance Monitor to capture performance data on a regular basis.
Use the Performance Monitor to capture performance data on a regular basis.
![]() Consider using System Center Operations Manager or Microsoft products and third-party products to assist with performance monitoring, capacity and data analysis, and reporting.
Consider using System Center Operations Manager or Microsoft products and third-party products to assist with performance monitoring, capacity and data analysis, and reporting.
![]() Carefully choose what to monitor so that the information doesn’t become unwieldy.
Carefully choose what to monitor so that the information doesn’t become unwieldy.
![]() At a minimum, monitor the most common contributors to performance bottlenecks: memory and pagefile usage, processor, disk subsystem, and network subsystem.
At a minimum, monitor the most common contributors to performance bottlenecks: memory and pagefile usage, processor, disk subsystem, and network subsystem.
![]() Identify and monitor server functions and roles along with the common set of resources.
Identify and monitor server functions and roles along with the common set of resources.
![]() When monitoring specific roles like virtual servers or AD DS, include the common performance counters such as memory, CPU, disk, and network as well as counters specific to the role of the server.
When monitoring specific roles like virtual servers or AD DS, include the common performance counters such as memory, CPU, disk, and network as well as counters specific to the role of the server.
![]() Examine network-related error counters.
Examine network-related error counters.