
16. Measurement and Analysis
Passer Rating has quite a way to go before it’s useful for the general public, but you’ve run it several times, and begun a testing régime, and you’re pretty confident that to the naked eye, it works.
As usual, the qualifier (“to the naked eye”) outweighs “it works.” There are issues in Passer Rating of speed and memory performance. Before you can act, you have to know what’s going on—you have to profile the app. The Instruments application is the tool for profiling applications.
Note
If you follow along with me—I recommend starting from the sample code for the end of the previous chapter—your statistics won’t match mine. You and I have different computers, different devices, different operating systems, background loads, free RAM and storage. . . all of which can have big effects on how a measurement run will turn out. In this chapter, I’ll stick to two significant figures, which is the limit of what’s meaningful.
Speed
The sample code has been changed so that generate-games.rb produces a league history from 2014 to 2053—13,054 games, 1.1 MB in size. You’ll find the product, sample-data.csv, in the same directory. Substitute them into your project, and run the app in the simulator.
Passer Rating takes an appreciable amount of time to start up; with the enlarged data set, if you ran the app on a device, it wouldn’t start at all: When you launch, the screen shows the startup image for 21 seconds, and then you’re back to the home screen. It takes too long: If your app doesn’t respond to user actions for more than 20 seconds, the system watchdog timer kills it. It has to be faster.
Note
In crash dumps, you’ll know that the watchdog killed the app if the exception code is 0x8badf00d.
To analyze speed, I’ll be working with Passer Rating on an iPhone 6. The iOS Simulator provides a lot of insight into how an app will work, but it is only a simulator: It has multiples of the RAM available to a device, and if it should run out, it can page memory to disk. It exposes the OS X API, and the shared API is optimized for a different processor. And, especially, the simulator has a much faster CPU.
To install Passer Rating on a device for testing, you have to be a paid member of the iOS Developer Program, register the device, and obtain a signing certificate.
Note
You may have a different device to test on, or if you aren’t an iOS Developer Program member, you won’t be able to test on a device at all. If you can’t participate, just read along. You can find the details of getting permission to load an app into an iOS device, and how to do so, in Chapter 18, “Provisioning.”
The Code Signing Identity that authorizes Xcode to install your app on a device can be set on a per-configuration basis. Typically the “Debug” configuration would use your developer certificate and “Release,” the distribution certificate. But we’re not at the point of distribution, so set the identity to iOS Developer for both.
Plug in the device, and use the second segment of the scheme control (next to the Run and Stop buttons) to direct the next build to it. If you’ve already enabled the device for development, Xcode will have arranged for a development profile that includes Passer Rating and your device. (See the Provisioning chapter if this isn’t clear.)
Note
Xcode’s iPhone SDKs come with symbol tables for the current Mac and iOS operating systems, but these aren’t updated for bug-fix releases; instead, when Xcode runs into a device with an OS minor version it hasn’t seen before, it loads the new table from the device itself. The Devices window (Window →Devices, ![]() 2) will explain. It should take only a minute or two.
2) will explain. It should take only a minute or two.
The Debug Navigator
Click the Run button; Xcode will do a fresh build targeted at a device and install the product in your phone. When that’s done, it launches Passer Rating.
Note
If the phone is locked with a passcode, you’ll have to unlock it before Xcode will let you proceed.
The Debug navigator gives us the first clue: During initialization, the performance bar graphs show the app comes close to saturating one of the cores in the device—90 percent of CPU, sometimes less, sometimes 100 percent or more. See Figure 16.1. (Modern devices have two or three processor cores, so a process could take 200 or even 300 percent, but the major work in Passer Rating isn’t threaded yet, so it uses one core at a time.)
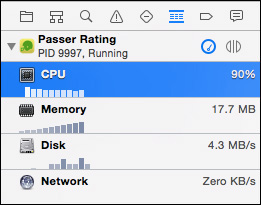
Figure 16.1 The first clue that something is wrong with Passer Rating’s performance at startup is the CPU bar graph in the Debug navigator, which shows it taking around 100 percent of the time on one of the device’s processor cores.
Click on the CPU bar graph in the Debug navigator, and you’ll see more of the story: a detailed running history of how much processor time Passer Rating is soaking up currently, over time, and as a proportion of the available resources (Figure 16.2).

Figure 16.2 Clicking one of the bar graphs at the top of the running Debug navigator presents the details of the Passer Rating’s resource usage currently, over time, and as a percentage of available resources.
My first guess was that SimpleCSVFile was so simple that it was inefficient. My temptation was to dive into the parser code, audit it, tinker with the works, introduce “speed optimizations” maybe duck into Objective-C or even asm blocks in the C code, and try again.
Don’t do this. Don’t guess. Instruments will tell you exactly where your app is spending its time. That’s the “low-hanging fruit”; make those parts of your code faster, and you’ve done more to solve the problem than if you’d nibbled around the periphery.
Use the Stop button to halt the app.
Instruments
Profiling an application is easy, or at least easy to start. Xcode provides an action for it. Select Product →Profile (![]() I), or the Profile option in the Action button in the toolbar. (You probably think of it as the Run button, but if you hold the mouse down on it, it offers all four of the routine actions.)
I), or the Profile option in the Action button in the toolbar. (You probably think of it as the Run button, but if you hold the mouse down on it, it offers all four of the routine actions.)
The profiling application, Instruments, will launch and offer you a choice of what kind of profiling you want to do. See Figure 16.3. This chapter will show you the basics of what Instruments can do; Chapter 26, “Instruments,” goes into much more depth.

Figure 16.3 When Instruments starts, it presents a template picker for the profiling suites it offers.
Note
On later runs, Instruments will use the same trace template. Or, you can use the Scheme editor to preselect the template you want.
Pick the Time Profiler template, and click Choose. A window for a new trace document appears, containing a track for Time Profiler. Instruments comes with 22 document templates, each containing a selection from a repertoire of profiling modules. Alas, these modules are called instruments. Be on the lookout, and I’ll try to be clear on which I mean.
Trace documents can be customized: Select Window →Library (![]() L) to reveal a library of the available instruments. Drag your choices into the track view at the top of the document window. (If an instrument won’t work with the platform you’re working on, a yellow caution flag will appear in the lower-right corner. You won’t need the flag; it seems that if an instrument is exactly what you need, it won’t work for your app.)
L) to reveal a library of the available instruments. Drag your choices into the track view at the top of the document window. (If an instrument won’t work with the platform you’re working on, a yellow caution flag will appear in the lower-right corner. You won’t need the flag; it seems that if an instrument is exactly what you need, it won’t work for your app.)
If you selected Profile in Xcode, Instruments stands ready to profile your app. If Passer Rating doesn’t launch immediately, click the Record button at the left end of the toolbar to launch it and start recording. In this case, Time Profiler examines Passer Rating every millisecond to see what code is executing, and the call chain that led to it.
As with many instruments, Time Profile reports statistical data: Over a long enough run, moment-to-moment samples will build up an overall picture of the “hotspots” where the app is spending its time. This is the low-hanging fruit: If a single method is responsible for most of the time spent in the app, any improvement will make the whole app noticeably faster.
iOS and Instruments give you some grace when you’re measuring performance: The watchdog timer does not fire, and Passer Rating is allowed to run as long as you need, even though it is unresponsive. In my setup, It took about 50 seconds to present the initial passer list—more than twice the limit. Embarrassing. See Figure 16.4.
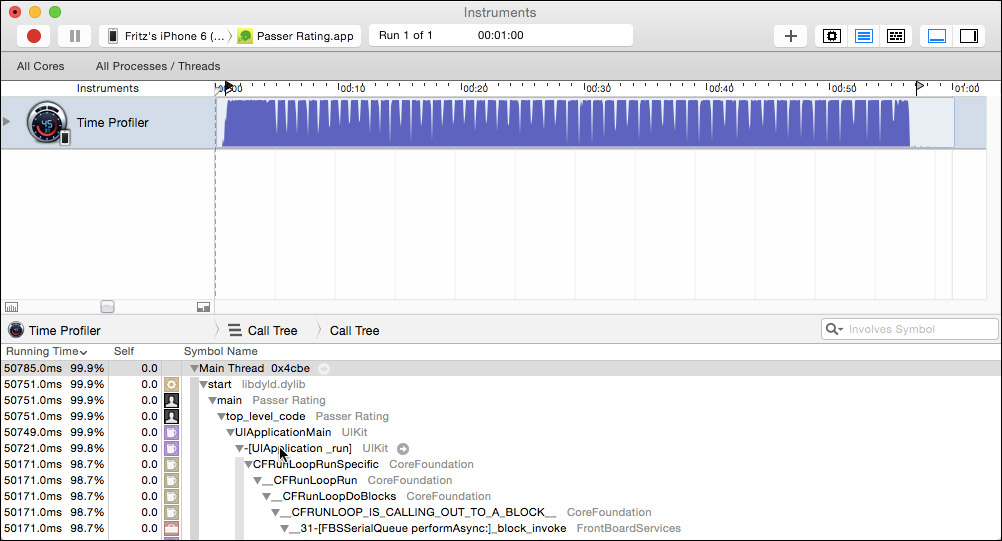
Figure 16.4 This trace of Passer Rating paints a discouraging portrait of the CPU being nearly saturated for more than a minute. The top part of the window is the Trace area, with a track showing CPU usage over time. Below it is the Detail area, for cumulative stack traces of the code that was executing.
var allPassers: [String: AnyObject] = [:]
enum PasserFetchStrategy {
case HorribleKludge;
case StraightCoreData;
}
let fetchStrategy:PasserFetchStrategy = .HorribleKludge
When Game .loadGames() reads a record from the sample file, it calls Passer.existingPasserByName (_, last:, context:) to check for an existing Passer object to link to the Game object. If there is no existing Passer, it creates one.
That lookup eats up a lot of time, which would have distracted from the other points I had to make. The horrible kludge is this: When it’s asked for a Passer, existing-PasserByName (_, last:, contect:) doesn’t do a Core Data fetch at all. It looks the object up in an in-memory dictionary, allPassers.
Let’s pretend we don’t know about that. Unmask the real Core Data code by changing fetchStrategy from .HorribleKludge to .StraightCoreData. Run the profile again.
This is not good. On my iPhone 6, the data set loads in 59 seconds. Three times the watchdog timeout. A fresh-faced programmer will blame the code optimizer: By default, the project templates set the build configuration for profiling to Debug, in which the Swift compiler is set to -Onone—no optimization at all. Open the Scheme editor (Product →Scheme →Edit Scheme. . ., ![]() <), select the Profile action, and change Build Configuration to Debug. That gets you
<), select the Profile action, and change Build Configuration to Debug. That gets you -Ofast. Does that help?
Profile again. 46 seconds. It’s better, only a bit more than twice the timeout limit.
More experienced developers learned this lesson long ago: Turning the knobs all the way up is rarely good enough. We have to think about what Passer Rating is actually doing. The Time Profiler instrument will tell us.
Note
There is another setting, -Ounchecked, which removes all the runtime safety checks on dereferencing nil, staying within the bounds of arrays, and the like. The better of opinion is that this is a bad idea, even if you’ve tested comprehensively and are sure the checks aren’t needed. No test is comprehensive. Better to crash at the spot of the error rather than let the app walk dead and crash far from the critical spot. I’d like to give you the run time with an unchecked build, but the Swift compiler in Xcode 6.1.0 crashed when I tried.
The Time Profile
The key is in the timeline at the top of the window. You see an area graph of how much of the device’s processing capacity the app used at each moment. From just after launch to the moment the passer list appears,the CPU (at least one core of the two) is saturated, 100 percent or close to it. There is a solid block for a short period, and then occasional notches, when the app waited for data to be written out to store. That part of the app takes up 90 percent or more of the startup time, and is where we start.
Note
If the high-load part of the track is crowded into the left end of the display, you can zoom in. First, make sure the app has stopped; the track will accumulate time even if the app is paused. You’re done collecting data, so click the Stop button (which had been the Record button). There are three ways to zoom in: View →Snap Track to Fit (^ ![]() Z) will expand the display so that the entire record will fill the timeline view. Control-dragging across a span that interests you expands the display to show just that span. Finally, below the label area at the left end of the timeline is a strip with a small knob in it. Dragging it right will zoom in, and dragging left will zoom out. It’s like a spring-loaded audio shuttle—the farther you drag, the faster you zoom, so be gentle.
Z) will expand the display so that the entire record will fill the timeline view. Control-dragging across a span that interests you expands the display to show just that span. Finally, below the label area at the left end of the timeline is a strip with a small knob in it. Dragging it right will zoom in, and dragging left will zoom out. It’s like a spring-loaded audio shuttle—the farther you drag, the faster you zoom, so be gentle.
Drag the mouse across that latter part of the track. When you select a part of a trace, the statistics in the detail area at the bottom of the window are filtered to just that time period. (If you don’t see a detail area, click the next-to-last button in the toolbar, the one that looks like a window with its bottom edge highlighted.)
Time Profiler displays the processing load as a tree of functions and the functions they call. The first line of the display is labeled “Main Thread.” The Running Time column shows Passer Rating spent all its time in that thread; not surprising. As you click the disclosure triangles next to the labels, you see the functions that were called from that level—the OS launch function start, then the runtime root main, and eventually something you care about, Game.loadGames(_, context:, error:). Below that, the trace splits into separate calls, among them the chain through the process of reading the CSV file and converting it into Passer and Game objects down through SimpleCSVFile.run(_). As the call tree branches, the percentages show what proportion of the total run time went into each.
The tree is intricate; it contains a lot of functions you can’t do anything about, because they’re in the operating system. You can cut it down: Open the Extended Detail view (to the right of the call-tree detail, click the last button in the toolbar if you don’t see it) and select the Display Settings inspector (middle tab). This inspector filters the display. Check Hide Missing Symbols and Hide System Libraries. Now you see just your application code (most of which you, and not the compiler, wrote) and how much time it took up. You can now chase down the tree, searching for the biggest time sinks.
This is informative, but not the best perspective. You can display the time sinks without having to chase them down. Click Invert Call Tree. What this shows is every function that was a time sink; the tree below each is every call chain that led to it. This can be crucial.
For example: objc_msgSend, which dispatches Objective-C method invocations, is called whenever you use an Objective-C object. That’s everywhere. With Invert Call Tree and Hide System Libraries off, use the search field to find objc_. Option-click on the disclosure triangle for the main-thread entry, expanding its call tree completely. objc_msgSend appears everywhere, a millisecond here, a millisecond there. Set Invert Call Tree, and you can see the function takes up more than 9 percent of the app’s time. How an expensive function was called does not matter as much as how expensive it is.
Note
As a system function—and an unavoidable one—you can’t do anything about objc_msgSend. That’s why you set Hide System Libraries to narrow the list down to your own code. You can do something about your code.
First Attempt—Batching Saves
The filtered tree fingers Game.loadGames(_, context:, error:) as the main culprit, at 41 percent of the loading process. Double-click the line for that function. Instruments reads Game.swift, and shows the loadGames function, with highlights on the most time-consuming lines (see Figure 16.5). In this case, the save of each new Game,

Figure 16.5 Double-clicking on a line in a Time Profiler call tree displays that function’s source code, highlighting the most time-consuming statements.
if !context.save(&savingError) {
consumes more than half the time spent in the function. save( ) is part of Core Data; so long as that’s our persistence method, there’s nothing we can do about it. However, we can call it less often, saving only every ten games rather than every one:
// in loadGames()
var batchingCount = 10
let batchSize = 1
// ...
parsingError = csvFile.run { (values) in
// Initialize a new Game, connect it to a Passer...
if ++batchingCount % batchSize == 0 {
var savingError: NSError? = nil
if !context.save(&savingError) {
println("Game.loadGames() CSV loop: save did not work. " +
"Line: (csvFile.lineCount)")
if let realError = savingError {
println("Error description = "+
"(realError.localizedDescription)")
}
else {
println("But the error came back nil!")
}
return savingError!
}
}
return nil
}
// ... respond to parsing errors...
// One more save in case the last objects
// didn't make it into the looped save:
var savingError: NSError? = nil
if !context.save(&savingError) {
println("Game.loadGames() CSV loop: save did not work. " +
"Line: (csvFile.lineCount)")
return false
}
// ... on to the rest of the function
The next profiling run shows many fewer pauses for saving the changes—a tenth as many, in fact. From launch to passer list, 33 seconds. Just over twice as fast as the First run. This is progress; make it another 50 percent faster, and the app will actually launch on a user’s phone.
Second Attempt—Batching Game Assignments
The top consumer of processor time is SimpleCSVFile.run(_). Double-click that line of the call tree to find that it spends 63 percent of its time here:
if let userErr = block(values) {
That doesn’t make a lot of sense. This is a call into the block passed to run by Game.loadGames(_, context:, error:); that block is our own code. It turns out that setting Hide Missing Symbols obscures block code. Uncheck it to reveal the tree as it descends into the block. The new champion is _Passer.addGamesObject(_) at 23 percent. This comes from the loadGames loop, as the new Game is linked to its Passer object.
Let’s repeat the batching strategy. This time it’s a little trickier: Instead of adding a new Game to the Passer’s games relationship right away, each Passer should accumulate the new games and add them as a group every so often. Here’s an excerpt from Passer:
let queueCapacity = 20
var gameQueue: NSMutableSet = NSMutableSet()
// Put a game into the gameQueue bag;
// put the accumulated games into this Passer
// once enough have come in.
func enqueueGame(aGame: Game) {
gameQueue.addObject(aGame)
if gameQueue.count >= queueCapacity {
flushGameQueue()
}
}
// Add the accumulated games all at once
func flushGameQueue() {
self.addGames(gameQueue)
gameQueue.removeAllObjects()
}
class func forAllPassersInContext(
context: NSManagedObjectContext,
body:(Passer) -> () ) {
// ... fetch all Passers from the context and
// pass each to the closure the caller provides...
}
// Flush the game caches of all Passer objects
class func flushGameQueues(#context: NSManagedObjectContext) {
forAllPassersInContext(context) { $0.flushGameQueue() }
}
In the loadGames loop, Game replaces
parsingError = csvFile.run { (values) in
// ...
newGame.passer = passer
// ...
}
with calls that accumulate new games into their Passers:
parsingError = csvFile.run { (values) in
// ...
passer.enqueueGame(newGame)
// ...
}
// ...
Passer.flushGameQueues(context: context)
26 seconds. Getting closer.
Third Attempt—The Horrible Kludge
Now the biggest consumer is Passer.existingPasserByName(_, last:, context:), at 24 percent of the total during the loadGames loop. This is where we started, with my guess that the .HorribleKludge option was the best thing I could do to make Passer Rating tolerable for testing. I’d guessed wrong, but now it’s our last, best option.
Change
let fetchStrategy:PasserFetchStrategy = .StraightCoreData
to
let fetchStrategy:PasserFetchStrategy = .HorribleKludge
One last time through the profiler: 20.1 seconds. On the latest-model iPhones (as I write this), Passer Rating, loading the 16,000-line sample file, has a sporting chance of surviving long enough to display data. There’s more work to be done, but trebling the performance of a critical stretch of code is a good day’s work.
Note
Now that we’ve sacrificed our principles, we can move on to rationalizing it. In the data set we have, there are fewer than 50 passers. Keeping 50 keys and object records—or even hundreds—is not a great demand on memory, and is a big win for speed. However: The keys I’ve used assume the full name of every quarterback is different, and the table indexes only one database, one NSManagedObjectContext. If we move on to a data model with more than one league (as we will when we get to the Mac application), we can’t have a global dictionary. Last: This doesn’t solve the problem, it just delays the problem until you reach 16,000 records. The right solution is to free up the main thread to serve user events immediately by putting the loading process on a background thread.
There’s always something more you can do, subject to how comfortable you’d be with the tradeoff between performance and code complexity. The division of CPU time is flat enough now that algorithmic tweaks are harder to find. What you’d do next, instead, is to experiment with the constants that determine how often games are flushed into passers, and the data flushed into the store. You’re no longer interested in analyzing the call tree, just the total clock time for loading the data.
Fortunately, there’s a tool that fits this task.
XCTest and Performance
Xcode 6 brings another way to gauge the performance of your app. The bar graphs in the Debug navigator give you approximate, whole-app hints that you might want to investigate further, and Instruments will give you particulars down to processor instructions, if you wish. There’s room for something in between.
The biggest problem is that you have to pay attention. The bar graphs have to be visible, and you have to look away from the device’s screen. Instruments works well if you focus on problem areas you might even know about. There’s no practical way to check whether your latest work has inadvertently harmed performance; it’s not realistic to expect you to be careful enough with more than one host device, or to keep long-term records to see trends; and anything that requires eyeballs can’t be automated, either as a part of your routine, or for integration builds.
You’ve read Chapter 15. You know this is a perfect case for unit testing. Xcode 6 introduces performance metrics to the XCTest framework.
The template for a unit-testing subclass includes a sample performance test, testPerformanceExample (), that contains only a call to measureBlock (). measureBlock is very simple: it puts a timer on the code in the closure you supply. It runs the block ten times, and records the average and standard deviation for the run.
When you look at the results of a performance test, you’ll appreciate those ten runs. Performance depends on factors you can’t control or reproduce, such as network bandwidth, or CPU time and memory claimed by other processes. Even jiggling the phone might trigger motion events that wake background apps registered with Core Motion. An average and margin are the best you can do.
There is a downside: If you’re investigating a very time-consuming operation, the ten iterations mean that the performance test will take ten-times-forever. In the case of Passer Rating, you might want to cut the sample-data file down to eight seasons or so. That shouldn’t matter if the issue is with the read-Game loop, and not with the accumulation.
Each time you run a performance test, Xcode shows the results in the margin of the test, and more informatively in the Results navigator. See Figure 16.6. Clicking on the test results, whether in the navigator or in the source code, produces a popover showing the timing for each of the ten runs.
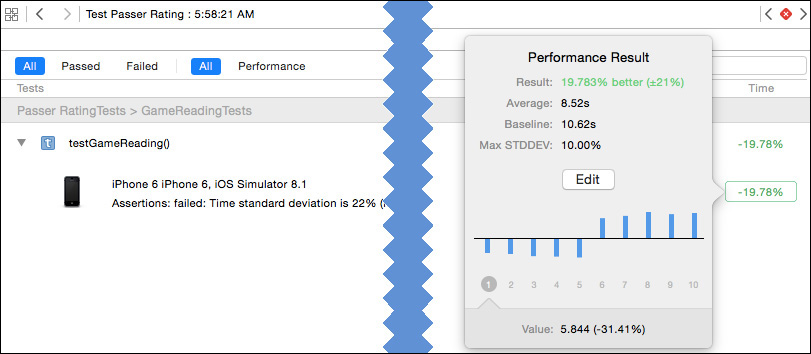
Figure 16.6 The Results navigator displays cumulative results for performance tests. Clicking the timing at the left end of the log entry opens a popover showing the ten runs from the last test, and a comparison to the earlier test you’ve designated as a baseline.
If you need to run code that shouldn’t contribute to the timing, you can exempt it by fencing it with stopMeasuring() and startMeasuring().
You’re usually interested in the effect your changes have on performance. The report on a performance run offers to make that run the baseline (Set Baseline) for comparison with later ones. Those reports will be based against the baseline performance.
Performance measurements can vary, but if the error margin in the average within a single test exceeds 10 percent, Xcode will suggest that the data is too scattered for a meaningful average. By default, it will report the test as failed, and won’t make a permanent record of it; you can click the Set Baseline button (or Edit in later runs) to force Xcode to accept the average.
The only thing XCTest measures for now is the real-world duration of the code in a measureBlock call. If you call up the interface for XCTest (see the “Documentation of Last Resort” section of Chapter 15, “Unit Testing”) to see hints of a future in which other metrics will be available for you to control through the measureMetrics method.
In the case of Passer Rating, your performance-test method should set up a Core Data stack of its own in the setUp() function, and tear it down in tearDown(). Look at AppDelegate.swift for the managedObjectContext property and the properties it calls upon.
Memory
In earlier editions of this book, I spent half of this chapter describing the memory instruments—Allocations and Leaks. Until the last couple of years, memory-management bugs were of far greater concern than time performance: One way or another, by losing memory to orphaned objects (leaks) or attempting to give back memory you don’t own (over-releasing), mismanaging memory crashes apps.
That’s still the case, but Cocoa has developed to the point where it proved too hard to demonstrate memory bugs in an app as simple as Passer Rating. Automatic Reference Counting, which automatically pairs claims on memory with releases, and Swift, which closes off most of the remaining openings to errors, have all but eliminated memory bugs. All but: These are conveniences, not total solutions. Cocoa developers still have to understand Cocoa’s reference-counted memory management.
In particular, you should understand retain cycles, in which object A claims to own object B, and vice versa. A can’t be returned to the memory pool because B claims it; B can’t be released because A claims it. There are a number of solutions: weak, unowned, and unsafe/undretained references. If B’s hold on A is weak, A can be released, because a weak reference can’t save it. A still has a strong reference to B, and with the dissolution of that link, B will be released as well.
Apple’s documentation, including a chapter in The Swift Programming Language, explains these issues in depth. I’m glad, but regretful, that there’s no good way to illustrate them in an overview chapter like this.
Summary
In this chapter, I showed you three tools for testing performance and memory bugs in Cocoa applications: the summary graphs and displays in the Xcode Debug navigator; the time-based profiling application, Instruments; and the measureBlock method in the XCTest unit-testing framework.
Instruments served well in tracking down a fatal performance bug in Passer Rating. It relieved you of trial-and-error fixes to code that wasn’t the problem, by pointing you to the exact parts that were the problem. It provided the tools to measure what you did, and the courage to take radical steps when they were needed.
There is a lot more to Instruments, both the details of the application itself, which I’ll cover in depth in Chapter 26, “Instruments,” and the techniques for applying each instrument.