5. Compilation
Before continuing, let’s review how computer programs get made. If you’re coming to Xcode from long experience with GNU Make or another development environment, this discussion will be very familiar to you. Bear with me: I’m going back to basics so every reader will be on a par for what they know about the build process.
Programmers use source code to specify what a program does; source code files contain a notation that, although technical and sometimes cryptic, is recognizably the product of a human, intended in part for humans to read. Even the most precise human communication leaves to allusion and implication things that a computer has to have spelled out. If a passer-rating tool were to refer to the local variable yardageComp, for example, you’d care only that the name yardageComp should consistently refer to the result of a particular calculation; the central processor of a computer running an application, however, cares about the amount of memory allocated to yardageComp, the format by which it is interpreted, how memory is reserved for the use of yardageComp and later released, that the memory should be aligned on the proper address boundary, that no conflicting use be made of that memory, and, finally, how the address of yardageComp is to be determined when data is to be stored or retrieved there. The same issues have to be resolved for each and every named thing in a program.
Compiling
Fortunately, you have a computer to keep track of such things. A compiler is a program that takes source files and generates the corresponding streams of machine-level instructions. Consider this function, which calculates two averages and sends them back to the caller through a results struct:
void calculate_stats(Results * results)
{
int n = 0, nScanned = 0;
double sum_X, sum_Y;
sum_X = sum_Y = 0.0;
do {
double x, y;
nScanned = scanf("%lg %lg", &x, &y);
if (nScanned == 2) {
n++;
sum_X += x;
sum_Y += y;
}
} while (nScanned == 2);
Results lclResults = { .avg_X = sum_X/n
#if CALCULATE_AVG_Y
, .avg_Y = sum_Y/n
#endif
};
*results = lclResults;
}
CALCULATE_AVG_Y is defined as 1 or 0, depending on whether the function is to calculate the average of the y values it reads. With average-y included, these 22 lines translate into 54 lines of assembly code (the human-readable equivalent of the bytes the processor would execute):
_calculate_stats_100000e40:
push rbp
mov rbp, rsp
push r15
push r14
push r13
push r12
push rbx
sub rsp, 0x28
mov r14, rdi
lea rdi, qword [ds:0x100000f82] ; "%lg %lg"
lea rsi, qword [ss:rbp-0x50+var_32]
lea rdx, qword [ss:rbp-0x50+var_24]
xor al, al
call imp___stubs__scanf
xorps xmm1, xmm1
cmp eax, 0x2
jne 0x100000ecb
xor ebx, ebx
lea r15, qword [ds:0x100000f82] ; "%lg %lg"
lea r12, qword [ss:rbp-0x50+var_32]
lea r13, qword [ss:rbp-0x50+var_24]
xorps xmm2, xmm2
nop word [cs:rax+rax+0x0]
addsd xmm1, qword [ss:rbp-0x50+var_24]
. . .
Note
For the record, this code was produced by the Xcode 5 version of the clang compiler with optimization set to -O3.
I’ve cut this off at the first 25 lines; you see the kind of output involved. It’s not very instructive unless you live with assembly every day. Fortunately, I have the useful Hopper Disassembler, which can reconstruct a C-like function from the byte stream:
function _calculate_stats_100000e40 {
r14 = rdi;
rax = scanf("%lg %lg");
xmm1 = 0x0;
if (rax == 0x2) {
rbx = 0x0;
r12 = &var_32;
r13 = &var_24;
xmm2 = 0x0;
do {
xmm1 = xmm1 + var_24;
var_16 = xmm1;
xmm2 = xmm2 + var_32;
var_8 = xmm2;
rax = scanf("%lg %lg");
xmm2 = var_8;
xmm1 = var_16;
rbx = rbx + 0x1;
} while (rax == 0x2);
}
else {
xmm2 = 0x0;
}
asm{ divsd xmm1, xmm0 };
asm{ divsd xmm2, xmm0 };
*r14 = xmm2;
*(r14 + 0x8) = xmm1;
return rax;
}
You lose the variable names, but you can see the outline. Even at this level, you notice a difference between the machine code and the source: The compiled function calls scanf() twice. The read-and-calculate loop in the original function is controlled by whether scanf(), in the loop, returned two values. That determination is made at the bottom of the loop, but that’s after the input is added to the sums, so the original code guards the calculations in the middle of the loop by testing whether there are two inputs. The compiler simplified the loop by making an extra call to scanf() before the loop starts, eliminating the need for the big if block in the middle.
By now you’ve seen an important point: Your source is your expression of what your code does, but if you let it, the compiler will substantially rearrange (optimize) it to meet some criterion—usually speed, but sometimes size or memory pressure. Its only obligation is to ensure that the emitted code has the same effect. But in the line-by-line details, if you were to step through optimized code, the program counter would jump apparently randomly around the lines of your code.
There’s more. Let’s set the CALCULATE_AVG_Y macro to 0, which does nothing more than remove the final use of sum_Y. The inner loop (while scanf() returns 2) becomes:
do {
var_16 = xmm1;
var_8 = var_32;
rax = scanf("%lg %lg");
xmm1 = var_16;
xmm1 = xmm1 + var_8;
rbx = rbx + 0x1;
} while (rax == 0x2);
If you puzzle this out, you’ll see that sum_Y isn’t there at all. The compiler saw that, even though the variable was used to accumulate a sum, nothing else used it. There’s no point in doing the sum, so it removed sum_Y completely. If you were to trace through this function in the debugger, you wouldn’t be able to see the value of sum_Y, because there is no value to see.
Fortunately, you can turn optimization off completely, and the reconstructed loop would look almost identical to what you wrote, including the summing of the sum_Y value that will never be used:
function _calculate_stats_100000e70 {
xmm0 = 0x0;
var_56 = rdi;
var_52 = 0x0;
var_48 = 0x0;
var_32 = xmm0;
var_40 = xmm0;
do {
rax = scanf("%lg %lg");
var_48 = rax;
if (var_48 == 0x2) {
var_52 = var_52 + 0x1;
var_40 = var_40 + var_24;
var_32 = var_32 + var_16;
}
} while (var_48 == 0x2);
asm{ divsd xmm1, xmm2 };
var_0 = var_40;
var_8 = 0x0;
rax = var_56;
*rax = var_0;
*(rax + 0x8) = var_8;
return rax;
}
This setting (-O0) is what Xcode uses for debugging builds.
When imagining the tasks a compiler must perform in producing executable machine instructions from human-readable source, the first thing that comes to mind is the choice of machine instructions: the translation of floating-point add operations into addsd instructions or expressing the do/while loop in terms of cmpl, je, and jmp. Even this simple example shows that this isn’t the whole story.
Another important task is the management of symbols. Each C function and every variable has to be expressed in machine code in terms of regions of memory, with addresses and extents. A compiler has to keep strict account of every symbol, assigning an address—or at least a way of getting an address—for it and making sure that no two symbols get overlapping sections of memory. Here’s how the assembly for the unoptimized version begins:
push rbp
mov rbp, rsp
sub rsp, 0x40
xorps xmm0, xmm0
mov qword [ss:rbp-0x40+var_56], rdi
mov dword [ss:rbp-0x40+var_52], 0x0
mov dword [ss:rbp-0x40+var_48], 0x0
movsd qword [ss:rbp-0x40+var_32], xmm0
movsd qword [ss:rbp-0x40+var_40], xmm0
In its analysis of calculate_stats, the compiler budgeted a certain amount of memory in RAM for local variables and assigned general-purpose register rbp to keep track of the end of that block. The 8-byte floating-point number x (var_40) was assigned to the memory beginning 40 bytes into that block; y was assigned to the eight bytes before that. The compiler made sure not to use that memory for any other purpose.
In the optimized version, the sums don’t even get stored in memory but are held in the processor’s floating-point registers and used from there. Register xmm1, for instance, holds the value of the sum_X variable. Once again, the compiler makes sure that each datum has something to hold it, and that no two claims on storage collide.
In an Xcode project, files that are to be compiled are found in the Target editor: Open the Navigator area on the left side of the window and select the first tab to display the Project navigator. The item at the top represents the project and all its targets. Select your product’s name from the TARGETS list.
The files to be compiled in the build of the target are listed in the “Compile Sources” build phase under the Build Phases tab. See Figure 5.1.

Figure 5.1 Selecting the project icon in the Project navigator displays an editor for the project and its targets. The Build Phases tab of the Target editor is a table showing the steps in building the target. Click the disclosure triangle in a phase’s header to display the files that go into that phase. Even a simple build has a “Compile Sources” phase (upper) containing every file to be transformed into object files; and a “Link Binary With Libraries” phase (lower) to designate precompiled system and private code to bind into a finished product.
call imp___stubs__scanf
This line is the translation of the call to the scanf() function. What sort of symbol is imp__stubs_scanf? Examining a full disassembly of an application using scanf() won’t tell you much: It traces to a location named imp__la_symbol_ptr_scanf, which is initialized with a 64-bit number. The compiled application does not contain any code, or any memory allocated, for scanf().
And a good thing, too, as scanf() is a component of the standard C library. You don’t want to define it yourself: You want to use the code that comes in the library. But the compiler, which works with only one .c or .m file at a time, doesn’t have any way of referring directly to the starting address of scanf(). The compiler has to leave that address as a blank to be filled in later; therefore, in building a program, there has to be an additional step for filling in such blanks.
The product of the compiler, an object file, contains the machine code generated from a source file, along with directories detailing what symbols are defined in that file and what symbols still need definitions filled in. Objective-C source files have the suffix .m; object files have the same name, with the .m removed and .o (for object) substituted. Libraries are single files that collect object files supplying useful definitions for commonly used symbols. In the simplest case, a library has a name beginning with lib and suffixed with .a.
The process of back-filling unresolved addresses in compiled code is called linkage editing, or simply linking. You present the linker with a set of object files and libraries, and, you hope, the linker finds among them a definition for every unresolved symbol your application uses. Every address that had been left blank for later will then be filled in. The result is an executable file containing all of the code that gets used in the application. See Figure 5.2.

Figure 5.2 The process of turning source code into an executable binary, ruthlessly simplified. You provide source code in Linrg.m (top left); compiling it produces an object file, Linrg.o, that contains your translated code, plus unresolved references to functions calculate.c doesn’t define. Other libraries (the notional libm.a and libc.a) contain machine code for those functions. It’s the job of the linker to merge your code and the other functions you requested into a complete executable program (bottom).
This process corresponds to the “Link Binary With Libraries” build phase in the application’s target listing. This phase lists all of the libraries and frameworks against which the application is to be linked.
Sharp-eyed readers will have seen that the linkage phase shown in Figure 5.1 contains no libraries at all. There are two reasons: First, most C compilers will link programs against the standard C library without being told to. Second, clang implements the modules extension to C-family languages, which can add libraries to the linkage task whenever one of their headers is used. See the “Precompilation” section later in this chapter for details.
Dynamic Loading
Actually, it’s one step more complicated than that. Standard routines, such as scanf(), will be used simultaneously by many—possibly hundreds—of processes on a system. Copying the machine code that implements scanf() into each application is a pointless waste of disk space. The solution is dynamic loading: The application leaves the addresses of common library functions unresolved even in the final executable file, providing the partial executable code along with a dictionary of symbols to be resolved and the system libraries to find them in. The operating system then fetches the missing code from a library that is shared system-wide, and links it into the executable when the application runs.
Dynamic loading saves not only disk space, but RAM and execution time. When a dynamic library—a collection of object files set up for dynamic linking and having the prefix lib and the suffix .dylib—is loaded into physical memory, the same copy is made visible to every application that needs it. The second and subsequent users of a dynamic library won’t incur memory or load-time costs.
Note
The iOS operating system relies on dynamic libraries for shared services just as any modern operating system does. iOS 8 brings dynamic libraries to apps, as well, in the form of frameworks (see Chapter 17, “An iOS Extension”). A framework is useful because it integrates the code and resources for a library into a discrete bundle that a developer can link into his applications. Application extensions, which allow iOS apps to provide services to other apps, are delivered as frameworks.
If dynamic libraries don’t get linked with the application’s executable code until run time, why do they figure in the linkage phase of the build process at all? There are two reasons. First, the linker can verify that all of the unresolved symbols in your application are defined somewhere and it can issue an error message if you specified a misspelled or absent function. Second, the linker-built tables in the dynamically linked code specify not only the symbols that need resolving but also what libraries the needed definitions are to be found in. With files specified, the dynamic loader does not have to search all of the system’s libraries for each symbol, and the application can specify private dynamic libraries that would not be in any general search path.
Xcode and Clang
A traditional compiler sticks to what I’ve just described: It’s a command-line tool that starts, reads your source code, writes some object code, and then stops. That’s what gcc, the Free Software Foundation’s widely used compiler, which Xcode provided or simulated through Xcode 4, does.
However, gcc had become hard to live with. gcc is. . .mature. Apple needed new features in C and Objective-C to make Cocoa programs more reliable and easier to write. It had been extending gcc for years, and publishing its contributions, but making significant changes to a code base with many stakeholders and dependencies is very slow business, and some of Apple’s needs were practically inexpressible in the gcc code base.
Also, gcc is published under the GNU General Public License, which requires all code linked with GPL code to be open source as well. There’s nothing wrong with this, but Apple’s goals were different: It hoped to integrate its compiler technology into much of its own software, for which it does not want to publish the source.
Apple’s solution was a new open-source compiler engine in the form of a linkable library, llvm, first introduced in Xcode 3.2. llvm’s first major product was the C-language-family compiler clang, but there was much more in store.
![]() The Xcode text editor links to
The Xcode text editor links to llvm to get continuous information on the state of your code from the same parser that will translate it into your product. Open the Preferences window (Xcode →Preferences. . . ![]() comma) and set Issues: Show live issues to display warnings and errors as you enter your code.
comma) and set Issues: Show live issues to display warnings and errors as you enter your code.
![]() The
The llvm library is linked into lldb, the debugging engine under the Xcode debugger. lldb lets you enter source-code statements on its command line; it will compile them—compatibly with the code being debugged, because it’s the same compiler—and inject them into the process you’re debugging.
![]() OpenCL, the OS X facility that harnesses graphics-chip computing power for massively parallel computation, relies on storing C-like source code in the client program. It has to; GPUs are all different. The OS uses
OpenCL, the OS X facility that harnesses graphics-chip computing power for massively parallel computation, relies on storing C-like source code in the client program. It has to; GPUs are all different. The OS uses llvm to convert the source text into the binary for the system’s GPU.
![]() Vendors providing bridges between Cocoa and “managed” or interpreted languages link the
Vendors providing bridges between Cocoa and “managed” or interpreted languages link the llvm library to their own compilers to translate relatively slow interpreted code to CPU-native code.
Adopting llvm allowed Apple to make tremendous leaps in its development systems. Before, the Objective-C language changed very little over the course of decades—a fine language, but new uses and new insights into code translation were making it less and less efficient and safe than it could have been. In the years since, llvm has allowed clang to develop deep insights into the developer’s code, with all that implies for the quality of diagnostics and generated code.
Local Analysis
The insight the previous generation of compilers have into source code is confined to a certain scope, no finer than a single line, no broader than a fairly large function. They can tell you what line an error occurred on; clang can specify the token. They can tell you that a symbol you used isn’t known; you can ask them to flag certain coding practices for you to double-check. clang can offer to correct the spelling, and recode expressions that it knows are problematic in the context, which can be very broad.
clang can be made to know about conventions and other constraints on your code. A common idiom in Cocoa programming is for a method to accept a pointer to the pointer for an NSError object. If an error occurs, the method can fill the reference with an error object, thus passing it back to the caller. However, such methods always offer to accept a NULL pointer, in case the caller wants to ignore the error detail.
Consider this Foundation command-line program, which implements a simple class with three methods:
#import <Foundation/Foundation.h>
static NSString * const MyErrDomain = @"MyErrDomain";
@interface MyClass : NSObject
- (void) doSomething;
- (BOOL) methodWithErrorRef: (NSError **) error;
@property(nonatomic, assign) BOOL somethingWrong;
@end
@implementation MyClass
- (instancetype) init
{
self = [super init];
if (self) {
_somethingWrong = NO;
}
return self;
}
- (void) doSomething { self.somethingWrong = YES; }
- (BOOL) methodWithErrorRef: (NSError **) error
{
NSError * justInCase =
[NSError errorWithDomain: MyErrDomain
code: -1 userInfo: nil];
*error = justInCase; // Line 29
[self doSomething];
if (self.somethingWrong)
return NO;
else
return YES;
}
@end
int main(int argc, const char * argv[])
{
@autoreleasepool {
MyClass * object = [[MyClass alloc] init];
NSError * error;
if ([object methodWithErrorRef: &error]) {
NSLog(@"Method on %@ succeeded", object);
}
else {
NSLog(@"Method on %@ failed", object);
}
}
return 0;
}
Note
Notice that methodWithErrorRef: fills the error output with a catchall error object before it knows whether an error occurred. Methods that accept NSError* references are allowed to do that. Callers must not try to determine whether something went wrong by examining the returned NSError. It may be present, but not valid. Only the method’s return value can tell you whether it failed.
MyClass is about as simple as it can be, just enough to have a method that appears to do something, and accepts a pointer to an NSError* pointer. Make clang take a really close look at it: Select Product →Analyze (![]() B). Soon the Issues navigator appears with one blue-flagged entry, which in the log appears as:
B). Soon the Issues navigator appears with one blue-flagged entry, which in the log appears as:
main.m:29:9: warning: Potential null dereference.
According to coding standards in 'Creating and
Returning NSError Objects' the parameter may be null
*error = justInCase;
~~~~~~~^~~~~~~~~~~~
So that’s a nice feature—Apple taught clang about one of its coding standards, and clang alerts you when you violate one. It will even identify the character position (the = assignment operator) where the error occurred. (The editor will show a red caret at that position.)
Cross-Function Analysis
It goes beyond nice. In main()’s call to methodWithErrorRef:, replace &error with NULL. Repeat the analysis.
The coding-convention error flag is joined by a “logic error.” Click the disclosure triangle in the Issues navigator, and step through the details it contains:
1. In main(), “Passing null pointer value via 1st parameter ‘error”’
2. “Calling ‘methodWithErrorRef:”’
3. In methodWithErrorRef:, “Entered call from ‘main”’
4. “Dereference of null pointer (loaded from variable ‘error’)”
The original flag was for an in-place violation of a coding convention. This is a warning of an actual programming error arising from an actual execution path that clang traced across two methods. See Figure 5.3.
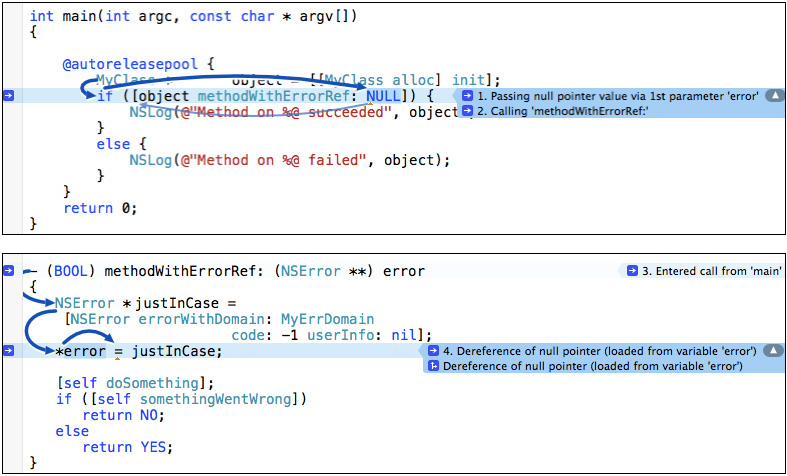
Figure 5.3 Even early on, clang could warn of programming errors that arise from program flows as they actually occur, even between functions. Expanding a logic error message will show arrows demonstrating exactly the path that will lead to the error.
Note
Between the banners and the Issues navigator, it can be hard to see the full text of error, warning, and analysis messages. The banners often run out of room, even with the tiny font they use, and the Issues items show only the first few words of the messages. You can do better: Open the General panel of the Preferences window, and set Issue Navigator Detail: to Up to Ten Lines. That should be plenty of room.
Indexing
Project indexing was a marquee feature of Xcode 1, and remains at its core. In the background, Xcode examines your code base, and all of the system files you use, to collect the type and place-of-definition of every symbol. That information is used so:
![]() The editor can give a unique color to each construct on the screen.
The editor can give a unique color to each construct on the screen.
![]() You can jump directly to the declaration of a symbol by command-clicking on it. The gesture works on the semantic unit—command-clicking the first part of
You can jump directly to the declaration of a symbol by command-clicking on it. The gesture works on the semantic unit—command-clicking the first part of fileExistsAtPath:isDirectory: will pick up the whole method name and won’t bounce you to fileExistsAtPath:.
![]() You can click in a symbol, and then on the indicator that appears next to it, to command Edit All in Scope; editing the one symbol will change all other instances, but only those that refer to the same object.
You can click in a symbol, and then on the indicator that appears next to it, to command Edit All in Scope; editing the one symbol will change all other instances, but only those that refer to the same object.
![]() The Symbol navigator (second tab in the Navigator area) can show you a directory of the symbols defined in your project, jumping you to the definition of each. This works even for
The Symbol navigator (second tab in the Navigator area) can show you a directory of the symbols defined in your project, jumping you to the definition of each. This works even for @property directives: They normally create hidden methods to set and examine the property. The Symbol navigator shows the implicit methods.
![]() The new facility for changing documentation comments into live help text can choose which documentation among identically spelled methods it should show.
The new facility for changing documentation comments into live help text can choose which documentation among identically spelled methods it should show.
![]() The refactoring feature can operate on all instances of a complex symbol (like a multipart method name), and only those, without the limitations of a search for text or patterns.
The refactoring feature can operate on all instances of a complex symbol (like a multipart method name), and only those, without the limitations of a search for text or patterns.
![]() The Assistant editor can be set to display all callers or callees of the method selected in the main editor. This makes possible the trick of moving callers of an obsolete method over to a new one by simply stepping through the callers and converting them until the caller list is empty.
The Assistant editor can be set to display all callers or callees of the method selected in the main editor. This makes possible the trick of moving callers of an obsolete method over to a new one by simply stepping through the callers and converting them until the caller list is empty.
Before the transition to llvm, Xcode had to fall back on its own parser, which could be made to match the behavior of the gcc compiler only with difficulty. With a slower indexing parser (and, yes, slower computers), it was common to have re-indexing interrupt your workflow. Creating an index for a large project still takes time (though you can continue work while it happens), but after that, you won’t notice it. llvm guarantees that the indexer and clang work from the same sophisticated code model.
Swift
All very nice for Objective-C and other C-family languages. But that was not all.
clang had made coding for Apple platforms about as efficient and reliable as possible—if you can tolerate some drawbacks:
![]() Objective-C is C. Any legal standard C program is a legal Objective-C program. (This is not true between C and C++.) C was intended to be a convenient, portable way to write assembly code for minicomputer operating systems. Assembly code owns the machine it runs on—if the developer wants to declare a ten-byte array and traverse all of memory from it, forward and back, the developer knows best. That’s not just an invitation to disaster for application programmers, it’s an all-comers street fair. But a language that restrains it is not C.
Objective-C is C. Any legal standard C program is a legal Objective-C program. (This is not true between C and C++.) C was intended to be a convenient, portable way to write assembly code for minicomputer operating systems. Assembly code owns the machine it runs on—if the developer wants to declare a ten-byte array and traverse all of memory from it, forward and back, the developer knows best. That’s not just an invitation to disaster for application programmers, it’s an all-comers street fair. But a language that restrains it is not C.
![]() A tool for coding the bare minimum of an operating system can’t assume, or prefer, any one method of managing system resources; in particular, C does not, and cannot, care about dynamic memory management. The standard C library provides routines like
A tool for coding the bare minimum of an operating system can’t assume, or prefer, any one method of managing system resources; in particular, C does not, and cannot, care about dynamic memory management. The standard C library provides routines like malloc() and free() for claiming blocks of memory, but they’re just functions; the language itself doesn’t know that they do anything special. A language that enforces memory-management practices is not C.
![]() In Objective-C, method dispatch—choosing the proper code to execute a message to an object—is always done on the assumption that any method might have an independent implementation, whether from subclass overrides or independent classes’ parallel adoption of a method. This degree of flexibility, called duck-typing, is powerful, but in practice it’s rarely needed. A smart compiler might convert lone-implementer methods into direct-address functions, but a C-family compiler rarely knows enough about the whole program to do it. Java and C++ let (or force) the programmer to provide that information, but a language that does that is not C.
In Objective-C, method dispatch—choosing the proper code to execute a message to an object—is always done on the assumption that any method might have an independent implementation, whether from subclass overrides or independent classes’ parallel adoption of a method. This degree of flexibility, called duck-typing, is powerful, but in practice it’s rarely needed. A smart compiler might convert lone-implementer methods into direct-address functions, but a C-family compiler rarely knows enough about the whole program to do it. Java and C++ let (or force) the programmer to provide that information, but a language that does that is not C.
![]() Code generation and programming techniques have advanced since the late 1970s. We know more, and we have the computing power to make them practical: Generic functions and data types; compilers that are free to choose among radically different implementations and resource strategies for the same code; passing executable code across functions—as parameters or function returns—as freely as any other data; control structures (such as
Code generation and programming techniques have advanced since the late 1970s. We know more, and we have the computing power to make them practical: Generic functions and data types; compilers that are free to choose among radically different implementations and resource strategies for the same code; passing executable code across functions—as parameters or function returns—as freely as any other data; control structures (such as switches) that can test for more than whether two byte patterns are identical. And more. There have been decades of progress since the fundamentals of C++ and Objective-C were set.
Especially with llvm at its disposal, Apple has managed to wedge some of these ideas into a language that remains compatible with C: Cross-function code analysis (in certain circumstances); blocks; properties and Automatic Reference Counting. But the language still has to be C, with its limitations on analysis, safety, and expression.
The obvious solution is to create a language that is transparent, safe, and expressive—but can express the old Objective-C data structures and design patterns. Not an easy task. At WWDC 2014, Apple announced its solution: the Swift programming language.
I can’t get deep into describing Swift; previous editions of this book avoided discussion of languages and techniques beyond their influence on the Xcode workflow. But Swift is “strange” enough that I want to give you a taste of what Swift can do that is at least difficult to express in Objective-C.
![]() Generic functions, which express pure algorithms without having to specify in advance what data types they handle.
Generic functions, which express pure algorithms without having to specify in advance what data types they handle.
![]() Type inference, by which Swift can enforce rigid data typing without requiring explicit type declarations in many cases.
Type inference, by which Swift can enforce rigid data typing without requiring explicit type declarations in many cases.
![]() Closures, raw blocks of executable code that can be passed around, called, or even created, while a program runs. (Functions are just a special case of closures.)
Closures, raw blocks of executable code that can be passed around, called, or even created, while a program runs. (Functions are just a special case of closures.)
![]() Currying, a technique for specializing a function by creating a new one that fixes some of its parameters. The resulting function accepts the other parameters (classically only one) and returns the result of the original function.
Currying, a technique for specializing a function by creating a new one that fixes some of its parameters. The resulting function accepts the other parameters (classically only one) and returns the result of the original function.
You noticed in Chapter 3, “Simple Workflow and Passive Debugging,” that the components of a passer rating are pinned to an interval no less than 0.0 and no greater than 2.375. This was done by adding a function pinPassingComponent() to enforce exactly that interval. This is how the same thing might be done in Swift:
/******************** Generic pinner: *******************/
/* Given a value, make it no less than a lower bound, nor more
than an upper. The three values need only be of the same type,
and that type must conform to the Comparable protocol.
Comparable promises a type responds to the < operator, plus
the == operator from Equatable; the other relations follow
from those.
*/
func pinComparables<T:Comparable> (value: T, lower: T, upper: T)
-> T
{
if value < lower { return lower }
else if value > upper { return upper }
else { return value }
}
pinComparables(-8.0, 0.0, 2.375) // => 0
pinComparables(1.5, 0.0, 2.375) // => 1.5
pinComparables(7.0, 0.0, 2.375) // => 2.375
/******************** Pinner factory ********************/
/* Given a lower and upper bound, return a closure
that takes a single argument of the same type, and
returns the pinned value.
*/
func limitPinner<T: Comparable> (lower: T, upper: T)
-> (T -> T)
{ return { value in pinComparables(value, lower, upper) } }
/* The new function has the bounds baked-in; the only
variable is the value to be pinned to those bounds.
*/
/*************** Floating-point pinner: *****************/
let pinPassingComponent = limitPinner(0.0, 2.375)
// => a new function, (Double -> Double)
println("below: (pinPassingComponent(-3.3)), " +
"above: (pinPassingComponent(3.3)), " +
"within: (pinPassingComponent(1.7))")
)
// => below: 0.0, above: 2.375, within: 1.7
That’s a lot of trouble just to confine a Double to an interval, though that didn’t stop me from including it in Utilities.swift in the sample code for the chapters to come. But it doesn’t stop there. String is also Comparable:
/******************* String pinner: *********************/
let stringPinner = limitPinner("Cornelia", "Josh")
// => (String -> String)
for name in ["Alan", "Fritz", "Oren"] {
println(name + ": " + stringPinner(name))
}
// Alan: Cornelia
// Fritz: Fritz
// Oren: Josh
/* All that was necessary was to pass the limits to limitPinner().
Swift inferred the type for limitPinner(), and therefore
pinComparables(), yielding a (String -> String) function
specialized for that range.
*/
Fine, if strange, but what about dates? In Swift, you represent them by the Foundation (Objective-C) class NSDate, but NSDate is not Comparable; if you applied pinComparables() to dates, the Swift compiler would reject it.
But you can make it Comparable:
/************* Define < and == for NSDate: **************/
/* Swift lets you define operators, even your own, like "<*>". */
public
func == (one: NSDate, another: NSDate) -> Bool
{ return one.compare(another) == .OrderedSame }
public
func < (one: NSDate, another: NSDate) -> Bool
{ return one.compare(another) == .OrderedAscending }
/************** Now NSDate is Comparable: ***************/
extension NSDate: Comparable, Equatable {}
/****************** Define some dates: ******************/
// Easy way to convert String to NSDate (en_US locale):
let shortFormatter = NSDateFormatter()
shortFormatter.dateStyle = .ShortStyle
/***************** A macabre date span: ****************/
let fBirth = shortFormatter.dateFromString("12/3/1955")
let fDeath = shortFormatter.dateFromString("7/15/2017")
/***** Create a pinning function for the life span: *****/
let inFritzsLifetime = pinnerFunction(fBirth!, fDeath!)
/******************** Some other dates: *****************/
let pearlHarbor = shortFormatter.dateFromString("12/7/1941")
let cBirthday = shortFormatter.dateFromString("12/23/1973")
let probeReachesNeptune = shortFormatter.dateFromString("8/9/2025")
inFritzsLifetime(pearlHarbor!) // => NSDate of 12/3/1955
inFritzsLifetime(cBirthday!) // => NSDate of 12/23/1973
inFritzsLifetime(probeReachesNeptune!) // => NSDate of 7/15/2017
Note
If you study Apple’s documentation of the Swift language, you can find every technique I used here, but not everything you will, sooner or later, need to know about the Swift standard library. In Appendix B, “Resources,” I’ll point you to sites where you can browse the full library, but there is a shortcut: Add import Swift to any playground, hold the Command key down, and click Swift. Xcode will present a complete listing of classes, structs, and protocols, with comments to document most of them. Module Darwin for the UNIX layer works, too, but isn’t as informative.
The first release of the Swift compiler is . . . a first release. Apple Developer Tools is nowhere close to the ideal implementation. However, some things can be inferred from the logical structure of the language and what it means for its potential:
Swift gives the compiler enough discretion that it can generalize or specialize code as needed. For instance, the same function might be dynamically dispatched, provisioned as a fixed-address routine, or copied into the caller inline, depending on how it is used in the whole program, not on the developer’s guess. That is only one example of many. The logical structure of the Swift language makes it possible to generate code that runs faster than C++, until now the gold standard for speed in an object-oriented language. That’s in principle; it isn’t there yet.
Compiler Products
Object files are the principal products of the compilation process: You’re most often interested only in building something you can run and test. But sometimes, the compiler will identify issues or produce results that, with all diligence, you can’t make sense of. In such cases, it’s useful to see what the compiler did on the way to translating your code.
Also, the build process will produce files that encapsulate repetitive tasks, like compiling common header files. These, too, are compiler products.
Intermediate Products
When you are tracing bugs—or are just curious—you may need to see what the compiler has done in the steps between your source and the executable product. Xcode provides a way to do this.
C-family compilers were originally run in three stages, each feeding the next. Modern compilers merge the steps to gain a better understanding of how to generate the best code, but notionally the steps are still there, and you can get the products of each:
1. The preprocessor takes your code and outputs the “real” source after making simple string substitutions. When it finds #include and #import directives, it inserts the contents of the included files into the output stream. Macros from #define directives are expanded and substituted into the stream. Conditional directives admit or block sections of code in the input file.
You can see the results of the preprocessor by clicking on the Related Items menu (at the left end of the jump bar above the editor) and selecting Preprocess. The editor shows the full interpreted stream of the current source file. This can be long, but you can track down bugs by making sure that the code you thought you were compiling, and the symbols you thought you were using, are really there. Choosing Preprocess from the root item in the jump bar of the Assistant editor will display a preprocessed version alongside the file you are editing. Also, you can issue Product →Perform Action →Preprocess.
2. The parser/generator takes the “simplified,” preprocessed code, reduces it to logical constructs (parsing), and produces the assembly source for a machine-language program that does what the original source directs (code generation). There are three ways to call for an assembly listing.
![]() Selecting Assembly from the Related Items menu, which drops down from the small array-of-rectangles button at the left end of the jump bar (Figure 5.4), replaces the editor’s contents with the translated code.
Selecting Assembly from the Related Items menu, which drops down from the small array-of-rectangles button at the left end of the jump bar (Figure 5.4), replaces the editor’s contents with the translated code.

Figure 5.4 The small item at the left end of the jump bar above any editor view is the anchor for the Related Items menu, offering many alternative views of the file displayed in the editor.
![]() The Product →Perform Action →Assemble command does the same thing.
The Product →Perform Action →Assemble command does the same thing.
![]() Selecting Assembly from the Assistant editor’s jump bar will show the assembly for whatever file is in the Standard editor.
Selecting Assembly from the Assistant editor’s jump bar will show the assembly for whatever file is in the Standard editor.
Note
This is not a disassembly like the one I began this chapter with. It is not derived from the final executable stream of the completed product. It is a representation of the compiler’s understanding of your code, and features annotations that relate back to clang’s knowledge of your source.
Note
Unfortunately, as of Xcode 6.3, neither the Assistant editor nor the Related Items menu will produce assembly or disassembly listings for Swift code. Full support for Swift is a work in progress; code refactoring is another example. You can expect these features to come back as time goes on.
3. An assembler reads the assembly source and reduces it to executable bytes in an object file, with references to be filled in by the linker. The otool command-line tool has a plethora of options for examining object files and libraries, with dis-assemblies and file layouts, and limited options for editing. The nm tool is useful for examining the symbol tables in a library. See man otool and man nm for details.
Note
The three-step translation process has no meaning in Swift: There is no preprocessor, and the compiler can’t determine exactly what code to generate until it has analyzed the whole program.
Precompilation
Mac and iOS applications draw on frameworks, packages of dynamic libraries, headers, and resources that define and link to the operating systems, human interface services, and other services. Frameworks entail huge numbers of large header files. In early days, it made sense for programmers to speed up builds by carefully choosing the system headers they included, but the Cocoa frameworks are so interdependent that that isn’t possible. (In fact, Apple emphatically warns against trying to pull pieces out of frameworks.)
Prefix Headers
Framework headers are usually the first things a C-family implementation file imports, either directly or through headers of its own. You can set a prefix file to be injected into the source stream of all your files; in fact, when you instantiate an iOS or OS X project, Xcode generates a .pch file and sets up the build settings to inject it. A typical prefix file looks like this:
#ifdef __OBJC__
#import <Cocoa/Cocoa.h>
#endif
That’s convenient, but doesn’t solve the problem of speed if the prefix is to be read and converted every time you compile a file. The .pch extension gives a clue to the solution: The file’s intended purpose is as source for a precompiled header; if you opt for precompilation, clang will read the .pch and save its parsing state. All subsequent uses of the prefix header will reload that saved state, saving you the time that repeating the compilation would have taken. There is another build setting for precompilation, and by default, it is on.
Note
Again, this is C-family; Swift depends on modules and API it pulls in automatically from other source files.
Modules
The clang supplied with Xcode 5 added modules to the C-family languages. The designers saw a problem: Notionally, the #include and #import directives that have been a part of C since its inception are nothing more than commands for pouring the uninterpreted text of one file into another. The included file defines symbols and macros that the compiler applies in the order it sees them. If you reorder the includes in your source files, the reordering of the definitions could change their meanings. Further, because you could insert defines among your includes, there is no way to be sure you can share precompiled inclusions among implementation files; even the same sequence of includes could yield completely different code.
The llvm engineers’ response is a system of modules, to be added to the C-family programming languages. Unlike header files brought in by the preprocessor, each module is a discrete unit and can come into the compilation state as completely parsed units. Swift is designed exclusively for modules, which are usable unchanged for Swift and Objective-C alike.
There is a price: For the full benefit, you can’t modify the effects of included headers by interleaving your own macro definitions. (It forces the compiler to generate a unique module file for just that case.) If you ever found it a good idea to do that, it’s because bad design in the headers forced you. If you deliberately exploited order dependencies among your header files, you were insane, and should have stopped.
For a concrete instance, the C standard libraries might be encapsulated into an umbrella module called std, and you could request only the parts you want by asking for sub-modules like std.io or std.strings. You can invoke the module feature directly by replacing your framework includes and imports with the @import Objective-C directory, so
#import <Foundation/Foundation.h>
becomes
@import Foundation;
Command-clicking the module name will take you to the framework’s umbrella header.
Unfortunately, none of the living authors of the many billions of C/C++/Objective-C source files are going to amend them to replace preprocessor directives with @import directives. For legacy code, when clang sees an #include or #import, it tries to build a module on the fly and use the module from then on.
Apple has modularized the system libraries, so the worst of the #include-and-recompile cycle has already been eliminated. If you examine the preprocessed version of your source, you’ll find that the contents of the system headers have been replaced with “implicit imports.” If you want to pre-build modules of your own, you can describe the structure by providing a module.map file.
The module.map file does something else: It associates libraries with each module. If you #include/#import a header from a modularized framework, you don’t have to add the framework to the “Link Binary With Libraries” build phase.
Swift adds another level: Objective-C code is subject to namespace collisions when objects from different libraries unwittingly adopt the same names. If you’re lucky, the linker will detect the duplicate definitions and refuse to emit an executable file. If not—as may be the case with the dynamic symbols used throughout Objective-C—you won’t know until your app makes very strange errors in very strange places.
For this reason, Swift code uses modules to confine symbols to the modules that define them (even the public ones). Your own application is a module, with a name based on the app name: The ASCII alphanumerics go through unchanged, and everything else is replaced by an underscore.
If you use a symbol from another module in a way that might give rise to a conflict, Swift will require you to prefix the symbol with the name of the defining module: If you have a class named Parser, and you use a library XMLParser that provides its own class Parser, you can safely refer to the library class as XMLParser.Parser.
Xcode 6’s new-project and -target templates for Objective-C are set to use modules by default. If you want the automatic linking feature as well, set “Link Frameworks Automatically” to Yes—that’s the default, as well.
I’ve left many of your questions unanswered; visit http://clang.llvm.org/docs/Modules.html to learn more.
Summary
This chapter was a short but essential review of what happens when you compile and link a program. You saw how compilation not only translates your code into machine-executable code, but also transforms it. The biggest task in building an executable is not translation, but the bookkeeping involved in allocating space to data and code and how it culminates in the linkage phase. Linkage can be done all at once, as in a static linker, but iOS and OS X rely heavily on dynamic linkage, where much of the heavy work is done as the program starts running.