27. Debugging
Debugging is intrinsic to the development process. The first parts of this book tell the story of a development process, and basic debugging techniques followed naturally. In this chapter, I want to call out a few subjects to provide you with a better grasp of how you can get the most out of the Xcode debugger and the lldb debugging system that underlies it.
We’ll take a look at the Run action in a build scheme and how it sets the conditions for your debugging session. Then, I’ll help you build the skills to make breakpoints more than mere stopping places. And we’ll have a look at the command line for the lldb debugger, as it’s used both in the Terminal and in the debugger console. Finally, a few short tips and techniques.
Scheme Options
Schemes have come up repeatedly in Xcode 6 Start to Finish, but I want to go through the scheme editor for the Run action, from which you’ll do most of your debugging. It includes many options to access the OS’s debugging features. The Run scheme editor has four tabs, and here they are, one by one.
Info
The options in the Info tab can be seen in Figure 27.1, top.
![]() You can choose whether to Debug the Executable at all.
You can choose whether to Debug the Executable at all.
![]() You have a choice of the privilege level at which the target will run.
You have a choice of the privilege level at which the target will run.
![]() You can run and debug with your user privileges (Me).
You can run and debug with your user privileges (Me).
![]() You can run with root privileges (so long as you can provide admin credentials).
You can run with root privileges (so long as you can provide admin credentials).
![]() Ordinarily, you want to run and debug your application Automatically, as soon as the build completes. But sometimes you have an app that needs specific inputs and conditions from some other process that launches it. The Wait for executable to be launched radio button makes
Ordinarily, you want to run and debug your application Automatically, as soon as the build completes. But sometimes you have an app that needs specific inputs and conditions from some other process that launches it. The Wait for executable to be launched radio button makes lldb wait until your app starts, and attach once it’s running.

Arguments
The Arguments panel (Figure 27.1, bottom) has two tables: one for command-line arguments, and one for environment variables. Use the + and – buttons to add and remove them. A checkbox will appear next to each item so you can choose which settings should be passed to your application on a particular run.
Argument entries can contain spaces, which will be treated as delimiters when the application is launched; that is, they will result in separate items in the traditional argv array. If you mean to pass an argument that contains a space, escape it with a backslash as you would on a command line.
The Expand Variables Based On popup menu lets you use the value of a build variable in your arguments and environment values; just include the variable’s name like this: ${SETTING NAME}. Each target has its own set of build variables, and this menu lets you choose which set is used.
Options
The Options tab for the Run action is different depending on whether the target is for Mac or iOS. These controls affect runtime conditions that don’t directly match up to system-defined environment variables—like location, working directories, graphics state, and whether you have to deal with potentially frustrating features like launch-time state restoration.
Mac
If you check Allow Location Simulation, you’ll be given a choice of locations for the debug environment to report to Location Services. You can select from a menu of locations, or add a GPX file for a custom location.
In OS X, Cocoa applications are subject to automatic state restoration, wherein the OS will attempt to reopen previously open documents and configure them as they were. By checking Persistent State: Launch application without state restoration, you can save yourself the headaches that may come when you simply want your app to start from zero.
The Versions browser works by loading the previous versions of a document into separate document objects and having them draw themselves. Debugging a plethora of transient, near-identical documents would be. . . a challenge, but if you need to do it, check Document Versions: Allow debugging when using document Versions Browser.
The POSIX working directory is a sore point in Mac development, because when Xcode debugs an application, the working directory is set to the one that contains the app; whereas applications launched from Finder get /, the root of the filesystem (though this is not guaranteed). Checking Working Directory: Use custom working directory: sets the working directory for debugging runs. There’s a field for entering the path and a button to open a get-directory sheet.
We saw Localization Debugging: Show non-localized strings in Chapter 21, “Localization.” Any text that isn’t drawn from the .lproj localization directory is rendered as all-caps or uninterpreted format strings. We also explored the use of the Application Language and Application Region popups.
XPC services are small executables that isolate parts of an OS X application that might threaten security or make the app less stable. You’re probably aware that modern web browsers do much the same thing to prevent plugins from gaining access to the browser proper.
If you check Debug XPC services used by this application, Xcode will attach the debugger to XPCs as they launch, as separate process objects in the lldb session.
View Debugging is a new feature in Xcode 6. If you enable it, you can see an explosion of your application’s view hierarchy in the debugger. More on that soon.
iOS
The iOS options deal with configuring the simulator and setting up debugging on devices. Here are the options that are unique to iOS.
![]() When you plug a development-enabled device into your Mac, you can use the Devices organizer to navigate to an application and extract its data into a data package. This is vital if you need to reproduce a bug that’s dependent on the state of your application. Once you’ve added the data package to your project, the Application Data popup can select it for loading into the simulator at application startup.
When you plug a development-enabled device into your Mac, you can use the Devices organizer to navigate to an application and extract its data into a data package. This is vital if you need to reproduce a bug that’s dependent on the state of your application. Once you’ve added the data package to your project, the Application Data popup can select it for loading into the simulator at application startup.
![]() Apple expects that routing (turn-by-turn directions) applications can provide data only for parts of the globe; you’ll upload a coverage (GeoJSON) file to iTunes Connect so the App Store knows what parts of the world your app should be sold in. Routing App Coverage File configures the simulator to restrict your app to those regions.
Apple expects that routing (turn-by-turn directions) applications can provide data only for parts of the globe; you’ll upload a coverage (GeoJSON) file to iTunes Connect so the App Store knows what parts of the world your app should be sold in. Routing App Coverage File configures the simulator to restrict your app to those regions.
![]() The Xcode debugger provides comprehensive tools for debugging OpenGL ES and Metal on iOS devices. GPU Frame Capture enables or disables the frame-capture button on the debugger’s control bar, allowing you to examine your builds step by step.
The Xcode debugger provides comprehensive tools for debugging OpenGL ES and Metal on iOS devices. GPU Frame Capture enables or disables the frame-capture button on the debugger’s control bar, allowing you to examine your builds step by step.
![]() iOS can launch apps in the background if they need to poll net resources for data they can download behind the scenes. Checking Launch due to a background fetch event simulates this kind of launch, instead of forcing the app onto the screen.
iOS can launch apps in the background if they need to poll net resources for data they can download behind the scenes. Checking Launch due to a background fetch event simulates this kind of launch, instead of forcing the app onto the screen.
![]() XPC Services are worth mentioning, because Xcode 6 adds support for iOS extensions with this option.
XPC Services are worth mentioning, because Xcode 6 adds support for iOS extensions with this option.
Diagnostics
The Diagnostics tab controls a number of diagnostic and logging options for both OS X and iOS that historically were controlled by environment variables. The most famous is detecting overreleased objects by setting NSZombieEnabled to YES. Diagnostics presents the most frequently used options as checkboxes. Search the Documentation browser for Technical Note TN2124, “Mac OS X Debugging Magic,” for a description of them and their use. The “Debugging Magic” notes (the iOS version, TN2239, isn’t available as I write this, but tech notes with changeable content often drop out of sight from time to time) are worth reading all the way through.
Note
The “zombie” technique is a useful way to track down attempts to use an object that had been deallocated by Cocoa’s memory-management system. Ordinarily, accessing a disposed-of object would crash, usually in objc_msgSend as your app tries to send the dead object a message. Sometimes the access would go to a completely different object that had been allocated into the same address as the dead object. Either way, it’s difficult to determine what the overreleased object had been. When you enable zombies, objects’ memory is never freed; they are simply replaced by “zombie” objects that remember what the class of the old object was, and halt execution whenever you try to send them a message. The result is that your app crashes at the first attempted access—there’s no chance of a succession of accesses that turned out to be harmless—and you have at least a class name to narrow your search for the cause. Zombies are available through this panel, through environment variables, and as an option for the Allocations instrument.
Doing More with Breakpoints
Many developers, even if they regularly use breakpoints, believe logging is the only way to pull control flow and state out of their programs when it’s not practical to stop dead at every pass through a segment of code. Not so. If you take nothing else away from this chapter, remember this: Almost never do you have to compile println(), NSLog(), or other printing functions into your application for debugging.
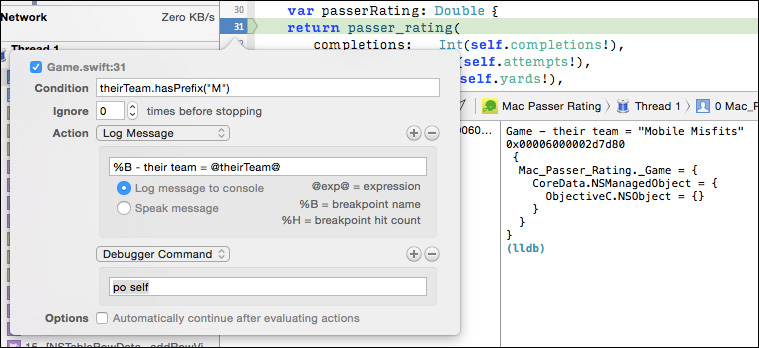
Use breakpoint options instead of NSLog()s. The options popover (Figure 27.2) is a little intimidating, but everything in it has a purpose, and once you understand what you can do, it all falls into place.
Let’s start with some code from Game.swift based on println():
var passerRating: Double {
let rating = passer_rating(
completions: Int(self.completions!),
attempts: Int(self.attempts!),
yards: Int(self.yards!),
touchdowns: Int(self.touchdowns!),
interceptions: Int(self.interceptions!))
if theirTeam.hasPrefix("M") {
println("(__FUNCTION__) - their team = (theirTeam)")
println("(self.description)")
}
return rating
}
Imagine that the problem we’re tracking somehow involves passer ratings coming in Games in which the opponent’s team name begins with “M.” It could happen.
1. Delete the if statement, including its body. The whole point is that you don’t need it.
2. Click the margin at return... to make a breakpoint appear.
3. Right-click the breakpoint arrow and select Edit Breakpoint. . ., or simply option-command-click it, to expose the breakpoint options popover.
4. You’re only interested in “M” teams, so in the Condition field, reproduce the condition in the if statement: enter theirTeam.hasPrefix("M"). Breakpoint conditions can execute expressions in any language being debugged. For Objective-C expressions, you must cast method return types—lldb can’t infer the return type of every possible method implementation. Swift is tight enough about typing that you don’t need to specify.
5. In the Action popup, select Log Message, and type %B - rating = @rating @. Anything you bracket with @ signs is interpreted as an expression, which is substituted into the message. You have the option of speaking the message instead of printing it.
Note
You also have the option of playing a sound or executing a debugger command, a shell script, or an AppleScript.
6. However, the @ ... @ notation isn’t as useful as you’d think. If you want to print an object value, this syntax doesn’t help because the interpreter sees only a pointer, and prints the hexadecimal address. Your alternative is to use the expression debugger command, such as expr -O -- self, where the -O option tells lldb to print the object’s description; for the comfort of gdb veterans, lldb provides the old po as an alias.
So click the (+) button and add a Debugger Command. Type po self in the text field.
7. In the Options section, check Automatically continue after evaluating. The NSLog()s didn’t stop execution, so neither will this breakpoint.
8. Click away from the popover to close it.
Note
The replacement of NSLog() calls is complete when you check Automatically continue after evaluating actions in the options popover for a breakpoint. When the breakpoint hits, it will perform all its actions, but it won’t halt the program.
Now run your app, and find that your debugger console fills with the breakpoint location, rating, opponent’s name, and the contents of the Game object.
To be sure, in this simple case, it’s trivial to construct logging code that does what you need—that’s what we started with. But if you first notice the error only after the app had built up state for a long time, and you decide to instrument the problem, it is not practical to kill the app, insert the logging code, rebuild it, and work it to the point where it triggers the bug. Breakpoints don’t need a rebuild, their presence doesn’t change the state of the program itself (unless you want it to), and they can be modified on the fly.
In earlier versions of Xcode, when you set exception or symbolic breakpoints in the Breakpoint navigator, you got a popover with breakpoint options immediately. This was useful for exceptions because the exception breakpoint can limit itself to Objective-C or C++ exceptions. Some of the Cocoa internals are implemented in C++ that makes liberal use of exceptions, which opens you up to a lot of false positives. Right-click on the new breakpoint and select Edit Breakpoint. . . from the contextual menu.
View Hierarchy
I mentioned the Enable user interface debugging checkbox in the Options panel of the Run action in the Scheme editor. When UI debugging is on, a ![]() button appears in the Debug area’s control bar. When you click it, the target app pauses, and the editor area of the project window fills with an exploded view of the active window. The usual scrolling gestures pan over the model, dragging rotates it, and the –, =, and + buttons zoom in and out. See Figure 27.3, top.
button appears in the Debug area’s control bar. When you click it, the target app pauses, and the editor area of the project window fills with an exploded view of the active window. The usual scrolling gestures pan over the model, dragging rotates it, and the –, =, and + buttons zoom in and out. See Figure 27.3, top.
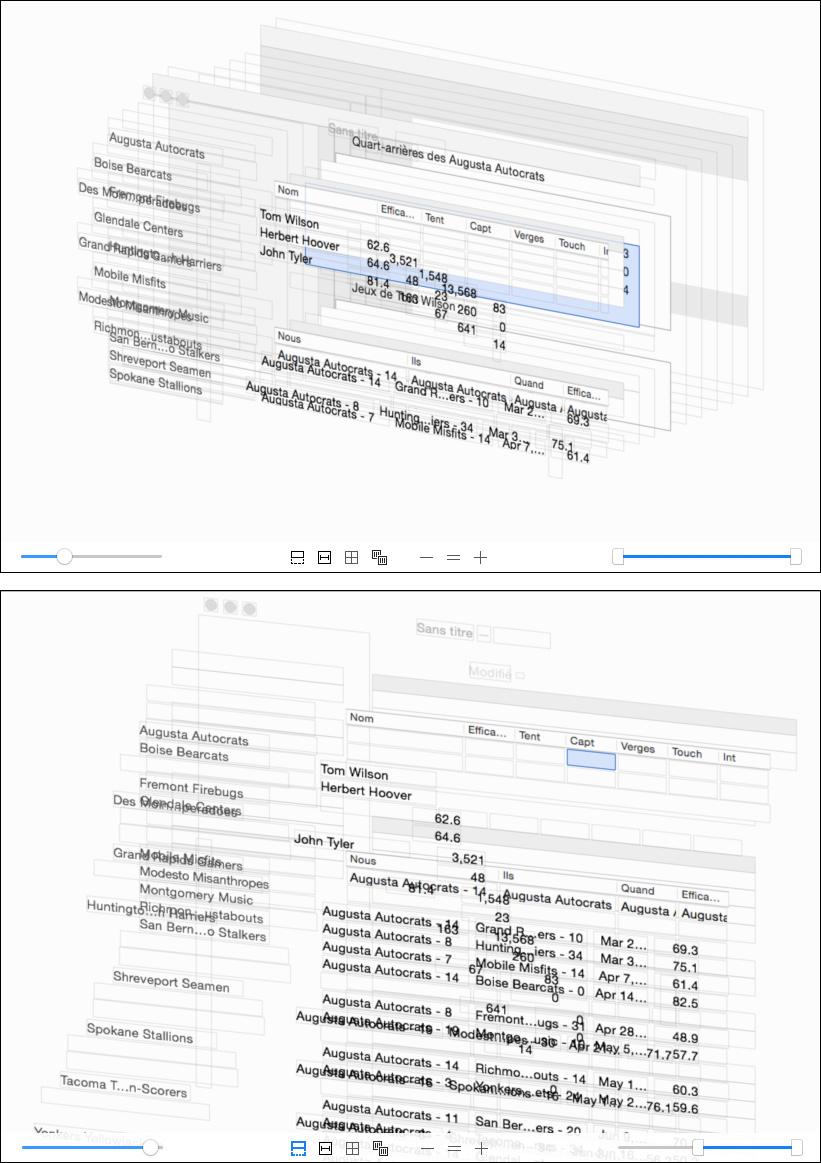
Figure 27.3 (top) Clicking the ![]() button in the debugger control bar presents an exploded view of the front window of the target application. (bottom) The controls at the bottom of the view adjust the contents: The lower-left slider has spread the views apart; the first of the toggle buttons reveals the views that had been clipped from view by their containers; and the range slider at lower-right hid the layers farther to the rear.
button in the debugger control bar presents an exploded view of the front window of the target application. (bottom) The controls at the bottom of the view adjust the contents: The lower-left slider has spread the views apart; the first of the toggle buttons reveals the views that had been clipped from view by their containers; and the range slider at lower-right hid the layers farther to the rear.
The Debug navigator picks up a popup menu at its top-right corner. When you click the ![]() button, the menu sets to View UI Hierarchy, the other choices being View Processes by Thread and View Processes by Queue, which show the more traditional stack traces. In the UI hierarchy view, the Debug navigator shows a complete outline of the window’s views, similar to the document outline in Interface Builder, but much more thorough.
button, the menu sets to View UI Hierarchy, the other choices being View Processes by Thread and View Processes by Queue, which show the more traditional stack traces. In the UI hierarchy view, the Debug navigator shows a complete outline of the window’s views, similar to the document outline in Interface Builder, but much more thorough.
With the UI panel visible, two new inspector tabs appear in the Utility area.
![]() The Object inspector (third tab) provides comprehensive information about any view you select.
The Object inspector (third tab) provides comprehensive information about any view you select.
![]() The Size inspector (fourth tab) shows the location and size of the view’s frame, and a list of the Auto Layout constraints.
The Size inspector (fourth tab) shows the location and size of the view’s frame, and a list of the Auto Layout constraints.
The controls at the bottom of the view adjust the presentation.
![]() The slider at the left sets the spacing between the view layers.
The slider at the left sets the spacing between the view layers.
![]() There is a toggle for showing and hiding views that exist, but are not visible because they are beyond the bounds of their containers. Figure 27.3, bottom, shows that Cocoa has prerendered the rows of the game table below the visible bottom of the table.
There is a toggle for showing and hiding views that exist, but are not visible because they are beyond the bounds of their containers. Figure 27.3, bottom, shows that Cocoa has prerendered the rows of the game table below the visible bottom of the table.
![]() The box with the I-beam across it, when highlighted, shows the constraints on any view you select in the panel. All views are replaced with wireframe outlines, and its constraints are drawn in blue around it. Selecting a constraint ought to give you full details in the Object inspector, but as of Xcode 6.1, it’s not all there yet.
The box with the I-beam across it, when highlighted, shows the constraints on any view you select in the panel. All views are replaced with wireframe outlines, and its constraints are drawn in blue around it. Selecting a constraint ought to give you full details in the Object inspector, but as of Xcode 6.1, it’s not all there yet.
![]() The third button restores the scale of the view layout, centers it, and turns it face-on.
The third button restores the scale of the view layout, centers it, and turns it face-on.
![]() The fourth control is a popup menu to display just the contents, or the wireframe boundaries, or both.
The fourth control is a popup menu to display just the contents, or the wireframe boundaries, or both.
![]() Next, three buttons to zoom the view in or out, or to restore the scale to normal.
Next, three buttons to zoom the view in or out, or to restore the scale to normal.
![]() The double slider on the right controls how much of the hierarchy will be visible. Moving the left slider to the right filters the back views from the display; moving it to the right side removes the forward views.
The double slider on the right controls how much of the hierarchy will be visible. Moving the left slider to the right filters the back views from the display; moving it to the right side removes the forward views.
The lldb Command Line
The conditions and commands that you can put into a breakpoint-options popover are just a taste of what you can do with the lldb command line. The lldb command language is large but much more compact and consistent than gdb’s. Nobody can say for sure that it’s more powerful, but one of the reasons Apple replaced gdb is that the complex of gdb settings and command options is so intricate that few users can get the maximum value out of it.
The general pattern of lldb commands is
noun verb options... arguments...
The noun portion classifies the available commands. The subsequent verbs and options refine your input to specific actions. The following is a list of built-in, permanent debugger command categories. A few of them are useful only on the command line, but most are wrapped in Xcode’s debugging UI. Almost all can be used from the Xcode debugger’s own console.
![]() quit—If you’re using
quit—If you’re using lldb on the command line, the first thing you’ll want to know is how to get out.
![]() apropos and help—These are the commands you’ll be using the most, at least for a while. The
apropos and help—These are the commands you’ll be using the most, at least for a while. The lldb web site has a good tutorial, but it can’t cover every subcommand and option you’ll want to use. The command-line help system is your best resource. Enter help breakpoint, and you’ll get a list of all the verbs for the breakpoint noun; help breakpoint set will show you the available options for setting a breakpoint.
![]() platform—
platform—lldb’s central concept is a hierarchy of containers to organize and control a debugging session. platform is the outermost. This noun lets you examine and select the various devices and architectures that lldb can target—a single instance of the debugger can target more than one at a time—and discover the processes lldb can access.
![]() target—With
target—With target, you designate an executable as the focus of a session. You can designate more than one target, so you don’t need to run a second instance of lldb to debug both a server and a client. Xcode provides this service when you run a target while another is running: It drops a sheet asking whether you want to quit the existing target, but if you choose to leave it running, the debugger will work on both simultaneously.
![]() process—This is the third layer of
process—This is the third layer of lldb containers. You can launch a target (thus creating a process) or attach to an existing process. The process level is where you’d interrupt execution, send POSIX signals, or kill the process.
![]() thread—Most of what you think of when you think about debugging is in this container. The thread level is where you get stack traces and control execution by stepping through the program.
thread—Most of what you think of when you think about debugging is in this container. The thread level is where you get stack traces and control execution by stepping through the program.
![]() frame—This is the innermost layer. It allows you to focus on the chain of frames—levels of the stack trace—at the point where execution is currently stopped. You can get a dump of variables at each level. The
frame—This is the innermost layer. It allows you to focus on the chain of frames—levels of the stack trace—at the point where execution is currently stopped. You can get a dump of variables at each level. The frame variables command alone gives you just the local variables (Objective-C and @objc objects will be expanded if you add the -O option). But it’s much more flexible than that; type help frame variable for the extensive list of options.
![]() breakpoint—This category creates, deletes, lists, and attaches conditions and scripts to breakpoints. Because you can attach
breakpoint—This category creates, deletes, lists, and attaches conditions and scripts to breakpoints. Because you can attach expression commands to a breakpoint, you can get away with executing anything you like in an application when the breakpoint triggers. watchpoint manages special breakpoints that trigger whenever a variable or memory region is changed—on the Mac or an iOS device.
![]() expression—The
expression—The expression command is incredibly powerful. It will evaluate and print the result of any expression in the language of the file you’re stopped in; lldb embeds the llvm compiler library, so it uses exactly the compiler that was used to build your application. The expression interpreter will even compile your expression into machine code before evaluating it.
It can be any kind of expression: You can do assignments and increments. You can declare local or global variables. You can execute conditionals and loops. Remember the -O option if you want to print the description of an Objective-C object.
![]() command—You’ll start out with the
command—You’ll start out with the alias verb to create shortcuts for commonly used commands; lldb comes with a set of aliases that map many gdb commands. command verbs also let you load Python modules for more sophisticated commands using the lldb module, which gives Python complete access to lldb’s internal state; lldb will even give Python plugins access to the target program’s memory space, so you can format the internal data of an object without having to run any of the object’s methods.
There are many more command categories than I can list here, useful as they are: commands for manipulating memory and registers, listing source code and disassembly, and building a custom configuration. Look for LLDB Quick Start Guide in the Documentation browser. In the console, the help command is your friend.
For daily use, however, most people find debugging a program through printing its state from a command line to be like sucking the app through a straw. Xcode’s debugging UI wraps most of these commands in a much more usable presentation that puts the whole state of the program on-screen at a glance. You can even use features like summary for-matters and Python-defined functions by putting them in user-, target-, or directory-specific .lldbinit configuration files.
Tips
Here are a few quick tips to help you in debugging your apps.
![]() By default, breakpoints are private to you—it’s not likely that others on your team are interested in how you’re working on your part of an app. But you can make a breakpoint public. Right-click on it in the Breakpoint navigator (sixth tab), and select Share Breakpoint. The breakpoint will move to a section marked “(Shared),” and it will be visible to users with different user names.
By default, breakpoints are private to you—it’s not likely that others on your team are interested in how you’re working on your part of an app. But you can make a breakpoint public. Right-click on it in the Breakpoint navigator (sixth tab), and select Share Breakpoint. The breakpoint will move to a section marked “(Shared),” and it will be visible to users with different user names.
![]() Breakpoints are also private to the projects in which they were set. By default, a breakpoint applies only to the project that was active when it was set. If you share a source file among projects in a workspace, the breakpoint will trigger only during the run of its project’s target. If you want it to trigger regardless of the project, right-click on it in the Breakpoint navigator, and select Move Breakpoint To → User.
Breakpoints are also private to the projects in which they were set. By default, a breakpoint applies only to the project that was active when it was set. If you share a source file among projects in a workspace, the breakpoint will trigger only during the run of its project’s target. If you want it to trigger regardless of the project, right-click on it in the Breakpoint navigator, and select Move Breakpoint To → User.
![]() The variables view takes up the left side of the Debug area (so long as you select the left-side button from the two at the bottom-right corner of the Debug area. One big improvement is the “Return Value” pseudo-variable. Often you will have a (not very) complex statement like
The variables view takes up the left side of the Debug area (so long as you select the left-side button from the two at the bottom-right corner of the Debug area. One big improvement is the “Return Value” pseudo-variable. Often you will have a (not very) complex statement like
labelString = masterObject.descriptionDictionary.objectForKey("name")
where -descriptionDictionary is a method you had defined. Step into descriptionDictionary. Step out; the program counter is now just before the call to objectForKey:. What dictionary will objectForKey: be sent to? Previously, there was no way to know without digging around through the stack pointer. Now, the “Return Value” line of the variables view will show you.
Note
As I write this, “Return Value” didn’t always show up or was easy to miss—at the machine-code level, a returned value has a very short lifetime; the bits get assigned or passed elsewhere, and the fact that they came from a function call is quickly forgotten.
![]() Perhaps you want a console window, just a command-line interface to see your printed output and type application input and debugger commands. Xcode 6’s default appearance is discouraging, but it’s more adaptable than it looks.
Perhaps you want a console window, just a command-line interface to see your printed output and type application input and debugger commands. Xcode 6’s default appearance is discouraging, but it’s more adaptable than it looks.
Double-click any file in a navigator, or tear a tab away from the top of a project window. Either way, you’ll have a separate window. Use the toolbar in that window to show the Debug area and hide the Navigator area. Drag the bar at the top of the Debug area to the top of the window,so the editor views disappear. Select View → Hide Toolbar to make the toolbar go away. Use the visibility control at the bottom-right corner of the window to make the variables and console view visible, according to your taste.
You now have a console window. It’s not perfect: The title of the window will show the name of whatever was in the window’s editor when you started. And, as always, it’s fragile. If one of your behaviors changes the format of the front window, you’ve lost your layout. If you close what you’re going to think of as your “project” window, the “console” window will be the last surviving window, and when you reopen the project, you’ll have only your console, and you’ll have to get busy with the View menu to dig yourself out.
![]() You may find you have to authenticate yourself—possibly repeatedly—to enable the debugger and Instruments to breach security to the extent of permitting you to examine and change the state of another application (the one you’re trying to debug). To silence the security dialogs, enter sudo DevToolsSecurity -enable on the command line.
You may find you have to authenticate yourself—possibly repeatedly—to enable the debugger and Instruments to breach security to the extent of permitting you to examine and change the state of another application (the one you’re trying to debug). To silence the security dialogs, enter sudo DevToolsSecurity -enable on the command line.
![]() The
The po (print-object) command in the lldb console will print the results of the object’s description method (or debugDescription, which is usually the same thing). The default implementation, from NSObject, just prints out the object’s class and address, which is of little help. If, instead, you enter p *objectVariableName, lldb will treat the object as a C struct and display all of its instance variables.
Note
The print-object/po command is just an alias for lldb’s expression -O -- objectVariable.
Another strategy worth trying for objects responding to the Swift Printable protocol is to enter expr println("object.description").
![]() I mentioned the
I mentioned the watchpoint command family in the lldb command line, which allows you to set a kind of breakpoint that triggers when a variable changes value, not necessarily at any one line of your source. Watchpoints allow you to catch bugs where a value changes, and you can’t determine how.
Xcode provides a graphical interface for watchpoints, but it’s not obvious. To set a watchpoint, first set an unconditional breakpoint at the first moment the variable comes into scope—you can’t work on the variable until lldb can identify it, and the variable has to be in the current scope for lldb to do that. Look for the variable you’re interested in in the variables pane. You may have to use the disclosure triangle on an object to expose an instance variable, if that’s what you’re interested in. Right-click on the variable’s row and select Watch “variableName”. The next time something changes the value of the variable, Xcode will break in.
Watchpoints having no fixed location in the source code, there’s no marker in any editor view that represents one. You can find watchpoints in a special category in the Breakpoint navigator, where you can edit, deactivate, or delete it. Watchpoints work on iOS devices as well as on Macs.
![]() When you’re debugging, the top bar of the Debug area, containing all the stepping and other flow-control buttons, is visible at the bottom of the project window, even if you’ve hidden the Debug area. At the left end of the bar is a control that expands and retracts the Debug area. If anything has been printed in the console since you last looked at the full Debug area, this control will highlight in blue.
When you’re debugging, the top bar of the Debug area, containing all the stepping and other flow-control buttons, is visible at the bottom of the project window, even if you’ve hidden the Debug area. At the left end of the bar is a control that expands and retracts the Debug area. If anything has been printed in the console since you last looked at the full Debug area, this control will highlight in blue.
![]() The Debug menu provides menu and key equivalents to all the flow-control buttons in the debugger. Add/Remove Breakpoint at Current Line (
The Debug menu provides menu and key equivalents to all the flow-control buttons in the debugger. Add/Remove Breakpoint at Current Line (![]() ) and Create Symbolic Breakpoint. . . (
) and Create Symbolic Breakpoint. . . ( ![]() ) will be useful if you prefer to avoid mousing as you type.
) will be useful if you prefer to avoid mousing as you type.
![]() The Step Over and Step Into commands (both in the Debug menu and in the debugger bar) have two additional variants:
The Step Over and Step Into commands (both in the Debug menu and in the debugger bar) have two additional variants:
![]() Instruction advances the program counter to the next machine instruction in the current function (Over) or the next instruction in the course of execution, even if that means descending through a function call (Into). The variants appear in the menu; clicking the buttons with the Control key pressed does the same thing.
Instruction advances the program counter to the next machine instruction in the current function (Over) or the next instruction in the course of execution, even if that means descending through a function call (Into). The variants appear in the menu; clicking the buttons with the Control key pressed does the same thing.
![]() Thread is a little more subtle. Cocoa applications are threaded; there’s no way around it. When you do a step-over or a step-into, not only does the thread you see in the debugger advance, so does any other thread that was executing at the same time. You have no control over what thread that would be, still less what code it is executing or what effect it might have on the state you are debugging. Step Over Thread and Step Into Thread freeze all other threads while you advance the thread you’re debugging. Hold down Shift and Control while clicking the buttons, or select the commands in the Debug menu, to get the effect.
Thread is a little more subtle. Cocoa applications are threaded; there’s no way around it. When you do a step-over or a step-into, not only does the thread you see in the debugger advance, so does any other thread that was executing at the same time. You have no control over what thread that would be, still less what code it is executing or what effect it might have on the state you are debugging. Step Over Thread and Step Into Thread freeze all other threads while you advance the thread you’re debugging. Hold down Shift and Control while clicking the buttons, or select the commands in the Debug menu, to get the effect.
![]() If you’re comfortable with using
If you’re comfortable with using lldb from the command line, you can set symbolic breakpoints that match a regular-expression pattern. Say you want to stop at entry to any method whose selector begins with passer. You can do that by using the -r option of the breakpoint set command:
(lldb) breakpoint set -r passer.*
Breakpoint created: 8: regex = 'passer.*', locations = 8,
resolved = 8
lldb says you just created breakpoint 8; breakpoint list lets you examine it:
(lldb) breakpoint list 8
8: regex = 'passer.*', locations = 8, resolved = 8
8.1: where = Mac Passer Rating`
-[LeagueDocument passerTable] + 16 ...
8.2: where = Mac Passer Rating`
-[LeagueDocument passerArrayController] + 21 ...
8.3: where = Mac Passer Rating`
-[PRGame passerRating] + 19 at PRGame.m:117 ...
...
It turns out the command set the breakpoint at eight locations (I’m showing only three of them). lldb separates locations from the breakpoints that have effect at them. You can clear the breakpoint from all eight locations by deleting it: breakpoint delete 8.
Multi-location breakpoints don’t show up in Xcode’s Breakpoint navigator, nor in editor margins.
![]() Sometimes breakpoints get set in your code with no indication in the Xcode UI. It’s not supposed to happen, but it will happen to you. You can repair this by typing breakpoint list at the
Sometimes breakpoints get set in your code with no indication in the Xcode UI. It’s not supposed to happen, but it will happen to you. You can repair this by typing breakpoint list at the lldb command line, finding the number of the phantom breakpoint, and listing the numbers of the breakpoints you want to clear at the end of a typed breakpoint delete command.
![]() Here’s something that isn’t in the menus, and I really wish it were: If you use Step Into enough times in a debugging session, inevitably you will find you’ve stepped into a function for which there is no debugging information, or no source code. If you’re good enough to reliably navigate through such code on your own, you don’t need this book.
Here’s something that isn’t in the menus, and I really wish it were: If you use Step Into enough times in a debugging session, inevitably you will find you’ve stepped into a function for which there is no debugging information, or no source code. If you’re good enough to reliably navigate through such code on your own, you don’t need this book.
lldb has a way out: Entering thread step-in -a true (-a is short for --avoid-no-debug) at the lldb command line gets you past frames for which there is no debugging information, so the debugger doesn’t come back to you until it hits your code again.
![]() If you don’t remember to break on exceptions, you will inevitably find that you’ll hit one, and you won’t get control of the debugger until the exception stack has wound down to the run loop, or even your
If you don’t remember to break on exceptions, you will inevitably find that you’ll hit one, and you won’t get control of the debugger until the exception stack has wound down to the run loop, or even your main function.
You can forestall this for OS X applications by setting the user default (preference) NSApplicationShowExceptions to YES in the Terminal command line:
$ # Set it for an app whose ID is com.yourdomain.application.id
$ defaults write com.yourdomain.application.id
> NSApplicationShowExceptions YES
$ # Set it for every app you run:
$ defaults write -g NSApplicationShowExceptions YES
Summary
Most of Xcode 6 Start to Finish is an examination of how to integrate Xcode’s debugger into your daily workflow. That made this chapter into an opportunity to examine some details that can guide you on the way from effectiveness to mastery.
First, we’d been leaving the debugging environment to the defaults Xcode’s project templates provide. The defaults are useful, but there are details—environment variables, location sensing, background processing, and cooperation with subtasks—that have to be addressed as your application becomes more sophisticated. That’s the job of the Run action in the Scheme editor.
Next, we explored the power of Xcode’s breakpoints. They aren’t just for halting the application for you to poke around. You can set up your breakpoints so they automate the way you gather information about how your app works. With conditions and counts and prints, they can all but eliminate the need to change your code just to get a log of how the app executes, or to flick the Continue button time after time while you wait for a critical piece of data to arrive.
The power of breakpoints comes from the power of the lldb debugger. Xcode’s debugger is a wrapper on lldb, and it’s a good one. But some day, you’ll need even more control and insight. lldb’s command language is direct and elegant, and I showed you the outlines and the philosophy that makes sense of its design.
The UI Debugging view is pretty—and useful. I showed you how to get a live perspective on the visual presentation of your apps. Bugs in visualization are almost by definition difficult to visualize; this will take you a long way to bringing more bugs under control.
Finally, I passed along some small—but I hope, helpful—tricks that have helped me in my long hours of debugging.