26. Instruments
Instruments is a framework for software-measurement tools called. . . instruments. (Capital-I Instruments is the application, small-i instruments are components of the Instruments application.) The analogy is to a multi-track recording deck. Instruments records activity into tracks (one per instrument), building the data on a timeline like audio on a tape.
You’ve seen Instruments before, in Chapter 16, “Measurement and Analysis,” where it helped you track down some memory and performance bugs in the Passer Rating iPhone app. It deserves a closer look. You’ll learn how to navigate the Instruments trace window, and how to choose instruments to fit your needs.
What Instruments Is
The focus on a timeline makes Instruments unique. Historically, profiling and debugging tools did one thing at a time. You had Shark (available with Xcode 2 and 3), which sampled a running application to collect aggregate statistics of where it spent its time. Shark had several modes for taking different statistics; if you wanted another mode, you ran Shark again. Shark’s profile data was aggregated over the whole session; if you wanted to profile a particular piece of your application, there was a hot key for you to turn profiling on and off.
Separately, there was a profiling application called MallocDebug, which collected cumulative, statistical call trees for calls to malloc and free. The results were cumulative across a profiling session, so you’d know how the biggest, or most, allocations happened, but not when.
If you needed the distribution and history of object allocations, by class, there was an Object Alloc application.
And if you wanted to know how the application was spending its time while it was making those allocations, you quit MallocDebug or Object Alloc and ran the target app again under Shark, because the other apps did only one thing.
Instruments is different. It is comprehensive. There are instruments for most ways you’d want to analyze your code, and Instruments runs them all at the same time. The results are laid out by time, in parallel. Did pressing a Compute button result in Core Data fetches? Or had the fetches already been done earlier? Did other disk activity eat up bandwidth? In the application? Elsewhere in the system? Is the application leaking file descriptors, and if so, when, and why? If you’re handing data off to another process, how does the recipient’s memory usage change in response to the handoff, and how does it relate to the use of file descriptors in both the recipient and master applications?
Instruments can answer these questions. You can relate file descriptors to disk activity, and disk activity to Core Data events, with stack traces for every single one of these, because Instruments captures the data on a timeline, all in parallel, event by event. And, you can target different instruments on different applications (or even the system as a whole) at the same time.
For events—like individual allocations or system calls—Instruments keeps a complete record each and every time. For time profiling, Instruments does statistical sampling, but it keeps each sample. That means that even if you want an aggregate, you get to pick the aggregate.
Say the list of passers in Passer Rating stutters when you scroll it. With Shark, you’d have to start Passer Rating, get to where you’d be scrolling as quickly as you could, do the scrolling, and then kill it at once so your statistical sample wouldn’t be polluted by whatever followed the part you were interested in. And you’d be too late, because the CPU time soaked up by initialization would swamp the little spikes incurred by reloading the passer table cells.
Note
Shark mitigated the problem by allowing you to set a delay before it started sampling, and a duration for the sample.
In Instruments, by contrast, you don’t have to worry about one part of the program polluting your statistics. You can select just the part of the timeline that has to do with scrolling, and you can see what your app was doing just then.
Note
Most of the power of Instruments lies in the analysis tools it provides after a recording is made, but don’t ignore the advantage it provides in showing program state dynamically: If you can’t see when a memory total or file I/O begins and settles down (for instance), you won’t know when to stop the recording for analysis in the first place.
Running Instruments
In the “Measurement and Analysis” chapter (16), you started Instruments from Xcode by issuing Product →Profile (![]() I), or selecting the Profile variant of the large Action button at the left end of the Xcode toolbar. You could set the trace template you wanted in the Profile panel of the Scheme editor; there’s even a shortcut: Hold down the Option key while making any other gesture that starts profiling, and you’ll be offered the Profile panel of the Scheme editor before you go on. With profiling integrated into the Xcode workflow, this will be the most common way you’ll use Instruments.
I), or selecting the Profile variant of the large Action button at the left end of the Xcode toolbar. You could set the trace template you wanted in the Profile panel of the Scheme editor; there’s even a shortcut: Hold down the Option key while making any other gesture that starts profiling, and you’ll be offered the Profile panel of the Scheme editor before you go on. With profiling integrated into the Xcode workflow, this will be the most common way you’ll use Instruments.
For specialized uses, you’ll want to go beyond the few templates the Profile action gives you. Instruments can run and attach to applications independently, and you can set up any instruments you like for the trace.
As delivered, Instruments does not appear as an application anywhere in the Finder. As with other developer tools, it is kept inside the Xcode.app bundle. The Profile build action launches Instruments and points it at your target application. If you want to use Instruments with a different target (another app, or a running process), select Xcode → Open Developer Tool →Instruments. Instruments will launch like any other application. Its icon will appear in the Dock, and I advise you to keep it there by right-clicking its icon and selecting Options →Keep in Dock.
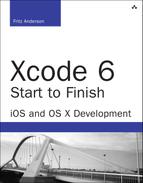
When you start Instruments, it creates a document (called a trace document) and displays a sheet offering you a choice of templates populated with instruments for common tasks (see Figure 26.1). A list of templates Apple provides can be found in “The Templates” later in this chapter.
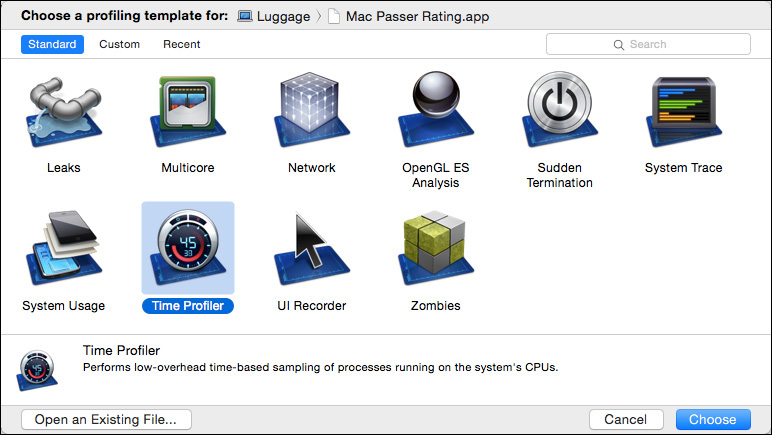
Figure 26.1 When you create a new trace document in Instruments, it shows you an empty document and a sheet for choosing among templates prepopulated with instruments for common tasks.
At the top of the New Trace assistant is a hierarchical menu, Choose a profiling template for:. The first segment lets you select a device—your computer; an attached iOS device; an iOS Simulator type; or, if you saved targeting information in a custom template, the option simply to go along with the saved target. You’ll be able to change the target once the trace document is open.
The Trace Document Window
The initial form of a trace document window is simple: A toolbar at the top, and a stack of instruments in the view that dominates the window. Once you’ve recorded data into the document, the window becomes much richer. Let’s go through Figure 26.2 and identify the components.
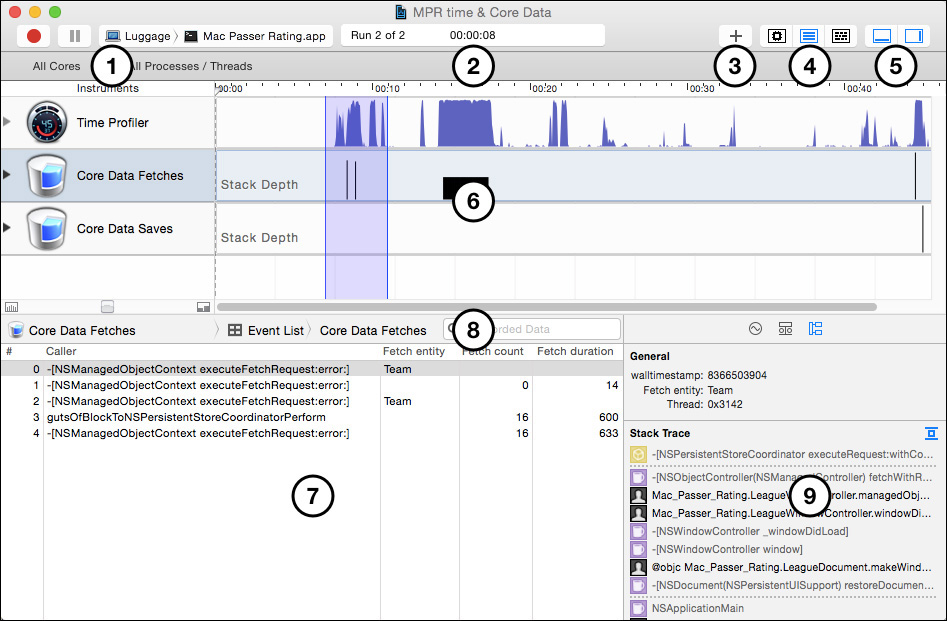
Figure 26.2 A typical Instruments window, once data has been recorded. The Extended Detail area (at right) has also been exposed. I discuss the numbered parts in the text.
Toolbar
The toolbar falls into three parts for five major functions. The controls at left ![]() control recording and the execution of the target applications. There is a Record/Drive & Record/Stop button to start and stop data collection, and a Pause button for suspending and resuming data collection.
control recording and the execution of the target applications. There is a Record/Drive & Record/Stop button to start and stop data collection, and a Pause button for suspending and resuming data collection.
Note
When you start recording, you will often be asked for an administrator’s password. The kind of deep monitoring many instruments do is a security breach, and the system makes you show you are authorized to do it.
The Target chooser designates the device and the process all instruments in the document will target, unless you specify a different target for individual instruments. The choices are
![]() The first segment of the menu allows you to choose a device, either your computer or a mobile device attached to it. The second segment will fill with the eligible targets on that device.
The first segment of the menu allows you to choose a device, either your computer or a mobile device attached to it. The second segment will fill with the eligible targets on that device.
![]() All Processes—Data will be collected from all of the processes, user and system, on the target device. For instance, the Core Data instruments (Mac only) can measure the Core Data activity of all processes. Not every instrument can span processes; if your document contains no instruments that can sample system-wide, this option will be disabled.
All Processes—Data will be collected from all of the processes, user and system, on the target device. For instance, the Core Data instruments (Mac only) can measure the Core Data activity of all processes. Not every instrument can span processes; if your document contains no instruments that can sample system-wide, this option will be disabled.
![]() Choose Target. . .—A sheet will drop, presenting a browser for selecting a target binary. This includes applications, dynamic libraries, extensions, and processes that may be started by
Choose Target. . .—A sheet will drop, presenting a browser for selecting a target binary. This includes applications, dynamic libraries, extensions, and processes that may be started by launchd daemons.
![]() Edit target name. . .—Drops the
Edit target name. . .—Drops the Choose Target... sheet, focused on the executable you’ve already set for the trace document. From here, you can set the arguments and environment variables to pass to the chosen target when it is launched.
![]() Recent Executables—A section for the applications and other processes you’ve most recently examined.
Recent Executables—A section for the applications and other processes you’ve most recently examined.
![]() App Extensions—A section for extension plugins that have registered themselves with the system.
App Extensions—A section for extension plugins that have registered themselves with the system.
![]() Running Applications—This section is what it sounds like. Data will be collected from an application that is already running; select it from the submenu. Some instruments require that their targets be launched from Instruments and cannot attach to running processes. If you use only non-attaching instruments, this section will be disabled.
Running Applications—This section is what it sounds like. Data will be collected from an application that is already running; select it from the submenu. Some instruments require that their targets be launched from Instruments and cannot attach to running processes. If you use only non-attaching instruments, this section will be disabled.
![]() System Processes—The same, for system daemons currently running in the background. What you see at first is a selection of the currently most-active processes. If you select the More. . . item, the menu will extend to all running system processes.
System Processes—The same, for system daemons currently running in the background. What you see at first is a selection of the currently most-active processes. If you select the More. . . item, the menu will extend to all running system processes.
The Target popup is not selectable while Instruments is recording.
While recording is in progress, the clock ![]() displays the total time period recorded in the document. Otherwise, it shows the position of the triangular “playback head” slider in the time scale at the top of the Track area (Figure 26.3). Trace documents can store more than one run of a trace; click the disclosure button at the left end of a track to see all previous runs for comparison. The clock shows the currently selected run.
displays the total time period recorded in the document. Otherwise, it shows the position of the triangular “playback head” slider in the time scale at the top of the Track area (Figure 26.3). Trace documents can store more than one run of a trace; click the disclosure button at the left end of a track to see all previous runs for comparison. The clock shows the currently selected run.

Figure 26.3 The left half of a trace document’s toolbar displays a clock and controls for selecting and running the main target to be traced. The clock view shows the duration while recording is in process, and the time marked by the triangular “playback head” when it is not. It also shows the run being displayed if there is more than one.
You can move between runs without expanding a track through the Previous Run ( ![]() Quote) and Next Run (
Quote) and Next Run ( ![]() Apostrophe) commands in the View menu.
Apostrophe) commands in the View menu.
The right section of the toolbar provides convenient controls for display.
Library ![]() , with a + icon, shows and hides a palette of available instruments, which you can drag into the Track area.
, with a + icon, shows and hides a palette of available instruments, which you can drag into the Track area.
The Strategy control ![]() selects among perspectives on the Trace area.
selects among perspectives on the Trace area.
![]() It’s easiest to start with the middle segment, Instruments, because the Time display is the most intuitive: Each instrument has its own track, showing the instant-by-instant statistics it has collected for the whole process.
It’s easiest to start with the middle segment, Instruments, because the Time display is the most intuitive: Each instrument has its own track, showing the instant-by-instant statistics it has collected for the whole process.
![]() CPU, the first segment, splits the instrument tracks to show the collected data identified with the processor core responsible for the event.
CPU, the first segment, splits the instrument tracks to show the collected data identified with the processor core responsible for the event.
![]() Threads also splits instrument data, but by the thread subprocess responsible for the event; threads are not necessarily confined to a single core over its lifetime, and often threads are created for single purposes, allowing you to analyze the events roughly by purpose.
Threads also splits instrument data, but by the thread subprocess responsible for the event; threads are not necessarily confined to a single core over its lifetime, and often threads are created for single purposes, allowing you to analyze the events roughly by purpose.
Note
The CPU and Threads perspectives aren’t available for every instrument.
The Detail selector ![]() is like the control in the Xcode toolbar that discloses the specialized areas in a project window. The first segment shows and hides the Detail area
is like the control in the Xcode toolbar that discloses the specialized areas in a project window. The first segment shows and hides the Detail area ![]() , which presents the data behind a trace raw, or analyzed by various criteria. The second segment exposes the Extended Detail area, which is used for configuring an instrument, filtering its data, and displaying a stack trace for events and statistical aggregates.
, which presents the data behind a trace raw, or analyzed by various criteria. The second segment exposes the Extended Detail area, which is used for configuring an instrument, filtering its data, and displaying a stack trace for events and statistical aggregates.
Track Area
The Track area ![]() is the focus of the document window and the only component you see when a document is first opened. This is the area you drag new instruments into. Apple describes the Track area as being divided between the Instruments Pane on the left, and the Track pane on the right. For clarity, I’m going to avoid yet another sense of the word “instruments,” and treat track rows as single units, with a name block on the left and a trace on the right.
is the focus of the document window and the only component you see when a document is first opened. This is the area you drag new instruments into. Apple describes the Track area as being divided between the Instruments Pane on the left, and the Track pane on the right. For clarity, I’m going to avoid yet another sense of the word “instruments,” and treat track rows as single units, with a name block on the left and a trace on the right.
Most instruments will display subsets of the data they collect if you select a time span within the recording. To do so, drag the playback head across the span you’re interested in. The span will be highlighted, and the Detail area ![]() will be restricted to data collected in the span. Click anywhere in the Track area to clear the selection.
will be restricted to data collected in the span. Click anywhere in the Track area to clear the selection.
Sometimes, you’re interested in the shape of your app’s performance throughout its run; sometimes you need to see the sequence of events during a single interaction with the app; and you may even be interested in processor events recorded over the course of a millisecond. Different tasks need different scales.
The scale of the Track area can be controlled by what looks like a slider below the configuration blocks. In fact, it behaves like a joystick: The track compresses while you hold it to the left, and expands while you hold it to the right.
You can also change scale by dragging in the Track area while holding a modifier key down: Shift-dragging will zoom in, spreading the interval you select to the breadth of the window. Control-dragging zooms out. The location or direction of the drag doesn’t matter; the time interval you sweep out will be the size of the currently displayed interval within the new, expanded interval. The shorter your drag, the further the track will zoom out.
Selecting View →Snap Track to Fit (∧![]() Z) will scale the Track area so the entire recording is given the full breadth of the window.
Z) will scale the Track area so the entire recording is given the full breadth of the window.
You can also scale a track vertically, by selecting it and using Decrease Deck Size ( ![]() –) or Increase Deck Size (
–) or Increase Deck Size ( ![]() +) in the View menu.
+) in the View menu.
The name block shows the instrument’s name and icon. To the left is a disclosure triangle so you can see the instrument’s tracks for previous runs in the document. To change the vertical order of instrument tracks, drag them by the name block. You can’t drag an instrument out of the document; if you want to delete a track, click the name block to select the track, and press Delete.
The trace to the right of the name block displays a timeline of the data the instrument collected. Most instruments have many options that determine what data they collect, and how. Before you run your first trace (if you’re given the chance—Instruments launches and traces immediately if it’s started from Xcode), examine each instrument’s configuration in the Settings inspector (first tab in the Extended Detail area) to see that you’ll get what you need. You can change a configuration at any time between runs.
Detail Area
The Detail area ![]() appears when you’ve run a trace. Click the first segment of the toolbar’s Detail selector to display it.
appears when you’ve run a trace. Click the first segment of the toolbar’s Detail selector to display it.
When you select an instrument in the Track view, the Detail area shows the collected data in tabular form. What’s in the table varies among instruments, and most instruments have more than one kind of table. The first segment of the Detail jump bar ![]() controls which table is displayed. As you drill down into the data for a detail row, elements are added to the jump bar; click higher-level elements to return to the corresponding views. The Display Settings inspector (second tab in the Extended Detail area) provides filters to further refine the currently displayed table.
controls which table is displayed. As you drill down into the data for a detail row, elements are added to the jump bar; click higher-level elements to return to the corresponding views. The Display Settings inspector (second tab in the Extended Detail area) provides filters to further refine the currently displayed table.
Extended Detail Area
The Extended Detail area ![]() consists of three tabs that roughly correspond to your progress in analyzing your application.
consists of three tabs that roughly correspond to your progress in analyzing your application.
![]() Record Settings configures an instrument in preparation for a recording run.
Record Settings configures an instrument in preparation for a recording run.
![]() Display Settings offers filters that refine the data displayed in the Detail area.
Display Settings offers filters that refine the data displayed in the Detail area.
![]() Extended Detail shows some kind of expansion on a datum in the Detail table.
Extended Detail shows some kind of expansion on a datum in the Detail table.
Record Settings
The Record Settings tab configures the instrument you have selected in the Trace area. Each instrument has its own configuration options, but some are common to most of them.
In the Track Display section, there are two popups, for Style and Type.
The usual Style menu selects among graphing styles for the numeric data the instrument records. These may include
![]() Line Graph. The track is displayed as a colored line connecting each datum in the series of collected data. You can choose the color in the list of the available series.
Line Graph. The track is displayed as a colored line connecting each datum in the series of collected data. You can choose the color in the list of the available series.
![]() Filled Line Graph is the same as Line, but the area under the line is colored.
Filled Line Graph is the same as Line, but the area under the line is colored.
![]() Point Graph. Each datum is displayed as a discrete symbol in the track. You can choose the symbols in the list of available series in the inspector.
Point Graph. Each datum is displayed as a discrete symbol in the track. You can choose the symbols in the list of available series in the inspector.
![]() Block Graph is a bar graph, showing each datum as a colored rectangle. In instruments that record events, the block will be as wide as the time to the next event.
Block Graph is a bar graph, showing each datum as a colored rectangle. In instruments that record events, the block will be as wide as the time to the next event.
![]() Peak Graph shows the data collected by an instrument that records events (like the Core Data instruments) as a vertical line at each event. Every time something happens, the graph shows a blip.
Peak Graph shows the data collected by an instrument that records events (like the Core Data instruments) as a vertical line at each event. Every time something happens, the graph shows a blip.
![]() Stack Libraries draws a bar for each event the instrument measures. The height of the bar depends on the depth of the call stack at the event; the bars are divided into colored segments, with a different color for each library that owns the caller at that level.
Stack Libraries draws a bar for each event the instrument measures. The height of the bar depends on the depth of the call stack at the event; the bars are divided into colored segments, with a different color for each library that owns the caller at that level.
![]() Some instruments have graph styles of their own. The Time Profiler instrument has three custom styles:
Some instruments have graph styles of their own. The Time Profiler instrument has three custom styles:
![]() CPU Usage is the classic format: An area graph shows the moment-to-moment time demands the application makes on all processor cores.
CPU Usage is the classic format: An area graph shows the moment-to-moment time demands the application makes on all processor cores.
![]() Deepest Stack Libraries shows a bar chart in which the height of the bars represents the depth of the call stack at each moment. The bars are color-coded to identify the libraries responsible for each call in the stack. The color code is the same as the one used in the icons in the Extended Detail area.
Deepest Stack Libraries shows a bar chart in which the height of the bars represents the depth of the call stack at each moment. The bars are color-coded to identify the libraries responsible for each call in the stack. The color code is the same as the one used in the icons in the Extended Detail area.
![]() User and System Libraries is the same bar chart, but there are only two colors showing how much of the stack passed through system libraries.
User and System Libraries is the same bar chart, but there are only two colors showing how much of the stack passed through system libraries.
![]() The Allocations instrument also has three custom styles:
The Allocations instrument also has three custom styles:
![]() Current Bytes is an area graph showing how much memory is in use.
Current Bytes is an area graph showing how much memory is in use.
![]() Allocation Density shows how many allocations were made in each increment in time. When your app makes a flurry of allocations, it shows up as a peak in the graph.
Allocation Density shows how many allocations were made in each increment in time. When your app makes a flurry of allocations, it shows up as a peak in the graph.
![]() Active Allocation Distribution filters the allocation-density graph to show where the allocations were made that were still alive at the end of the trace.
Active Allocation Distribution filters the allocation-density graph to show where the allocations were made that were still alive at the end of the trace.
Most instruments record events, not quantities that vary over time. In fact, the data displayed may not even be a continuous variable, but may be a mere tag, like the ID of a thread or a file descriptor. The Peak Graph style is the most suitable style for event recordings. Such displays are still useful, as they give you a landmark for examining the matching data in the other tracks. Stack Libraries would also be good, but it takes a very sharp eye to discern patterns in the call stacks of infrequent events.
The Type menu offers two choices for instruments that can record more than one data series. Overlay displays all series on a single graph. The displayed data will probably overlap, but in point and line displays this probably doesn’t matter, and filled displays are translucent, so the two series don’t obscure each other. Stacked displays each series in separate strips, one above the other.
You can change the Track Display settings even after the instrument has collected its data.
For instruments that can collect more than one series, a Select statistics to list section shows a checkbox for each available series, with a popup to select the shape of points for a Point Graph, plus a color well.
Display Settings
The Display Settings tab filters the table’s contents after you’ve collected data. The options vary by instrument and table type, but most instruments collect call trees, and will have a “Call Tree” section among the options. The call-tree display options are
![]() Separate by Category—In the Allocations instrument, the normal call tree displays all allocations of any kind. This is useful if you need to know how much memory was allocated in any one function, regardless of what the allocations were for. If you select Separate by Category, the call tree list is sorted by the type of the allocation. You can expand the row for the symbol name
Separate by Category—In the Allocations instrument, the normal call tree displays all allocations of any kind. This is useful if you need to know how much memory was allocated in any one function, regardless of what the allocations were for. If you select Separate by Category, the call tree list is sorted by the type of the allocation. You can expand the row for the symbol name NSImage and see code paths that led to the creation of OS X image objects.
![]() Separate by Thread—Call trees are normally merged with no regard for which thread the calls occurred in. Separating the trees by thread will help you weed out calls in threads you aren’t interested in.
Separate by Thread—Call trees are normally merged with no regard for which thread the calls occurred in. Separating the trees by thread will help you weed out calls in threads you aren’t interested in.
![]() Invert Call Tree—The default (top-down) presentation of call trees starts at the runtime
Invert Call Tree—The default (top-down) presentation of call trees starts at the runtime start or main function, branching out through the successive calls down to the leaf functions that are the events the instrument records. Checking this box inverts the trees, so they are bottom-up: You start at the function (usually objc_msgSend in Objective-C applications) where the event occurred, and branch out to all the successive callers.
![]() Hide Missing Symbols—Checking this box hides functions that don’t have debugging symbols associated with them. Most of the libraries in the system frameworks include symbols for their functions, and those can at least suggest what’s going on. (And, of course, your code has symbols, because you’ve made sure your “Debug Information Format” build setting is set to “DWARF with dSYM File”—it won’t inflate the size of your code.)
Hide Missing Symbols—Checking this box hides functions that don’t have debugging symbols associated with them. Most of the libraries in the system frameworks include symbols for their functions, and those can at least suggest what’s going on. (And, of course, your code has symbols, because you’ve made sure your “Debug Information Format” build setting is set to “DWARF with dSYM File”—it won’t inflate the size of your code.)
![]() Hide System Libraries—This skips over functions in system libraries. Reading the names of the library calls may help you get an idea of what is going on, but if you are looking for code you can do something about, you don’t want to see them. Using this option along with Invert Call Tree will often tell a very explicit story about what your code is doing.
Hide System Libraries—This skips over functions in system libraries. Reading the names of the library calls may help you get an idea of what is going on, but if you are looking for code you can do something about, you don’t want to see them. Using this option along with Invert Call Tree will often tell a very explicit story about what your code is doing. objc_msgSend is so ubiquitous in Cocoa code that finding it in a stack trace doesn’t tell you much; paring the trees down to where all those calls came from tells you everything.
![]() Flatten Recursion—This lumps every call a function makes to itself into a single item. Recursive calls can run up the length of a call stack without being very informative.
Flatten Recursion—This lumps every call a function makes to itself into a single item. Recursive calls can run up the length of a call stack without being very informative.
![]() Top Functions—This is a very useful filter, but hard to describe. You remember in Chapter 16, “Measurement and Analysis” that we wanted to know specifically what Passer Rating function was taking up the most time as the
Top Functions—This is a very useful filter, but hard to describe. You remember in Chapter 16, “Measurement and Analysis” that we wanted to know specifically what Passer Rating function was taking up the most time as the Game database was being built.
The initial display of the call tree told us that main took up 100 percent of the app’s time; we could then disclose the functions main called and see how much time they took; and so on down the stack, eventually passing, at one level or another, through our code.
Then we inverted the call tree; that told us what the most expensive functions were, no matter how they got to be called. We could work through the disclosures until, again, we could see our functions on this or that call chain.
Finally, we checked Hide System Libraries, which cut off the tree at our own functions. At that point, we could see our most expensive functions, listed by the total time spent running them—the time spent in the system calls they made was added up and attributed to our code. That aggregated time was the most valuable information we got from this technique.
Top Functions does the same thing, without having to prune any functions out of the tree. The Call Tree list in the Detail area shows every function in the app, with the total time spent in them. The first line would be main, which was running or calling the rest of the app code 100 percent of the time. (The Self column will still show the amount of time spent executing the function’s own code.)
Suppose main called functionA and functionB; the next line in the table might be functionA with 80 percent—nevermind that it was already counted in main. The next line might be functionC, called by functionA, taking 50 percent; and next functionB at 20 percent.
With a comprehensive list like this, you have a guide to one of the most fruitful strategies in optimizing an application—not the speed of a run of instructions, but the algorithm that runs them. Top-function analysis gives you the total call pattern, including a loop in Cocoa that calls into your code.
You can also add call-tree constraints, such as minimum and maximum call counts. The idea is to prune (or focus on) calls that are not frequently made. Another constraint that may be available (for instance, in the Time Profiler instrument) can filter call trees by the amount of time (minimum, maximum, or both) they took up in the course of the run.
There’s one feature that will do you a lot of good, but it’s easy to miss: At the far left end of the Detail jump bar is what looks like a label that identifies the selected instrument. That’s what it usually happens to show, but it’s a popup menu. You can use it as another way to select an instrument track for the Detail view, but at the top is another item, Trace Highlights. Many instruments—especially Activity Monitor—can render their data as bar or pie charts, broken down by process, thread, or event type, or share of resources. When you select the highlights view, the Detail area will fill with the available charts.
Extended Detail
The third tab in the Extended Detail area is itself named Extended Detail. It typically includes a stack trace when you select an item in the Detail area that carries stack information. When the selected item is part of a call tree, the Extended Detail area shows the “heaviest” stack, the one that accounts for most of whatever the instrument keeps track of. There’s a Hide system calls in the stack trace button at top-right to truncate the list to your own code and its immediate callers and callees.
Selecting a frame in the call stack highlights the corresponding call in the call-tree outline. Double-clicking on a frame shows the corresponding source code in the Detail area, with banners showing where the instrument “hit” in the function, and what proportion of those function hits fell on which lines.
Note
When you double-click a stack frame to see the source code in the Detail area, the Extended Detail area fills with annotations on the function call that generated that frame. The Detail area’s jump bar adds a segment for the listing (Call Trees →Call Tree →-[SimpleCSVFile run:error:]. You can return to the call tree in the Detail area and the stack trace in the Extended Detail area by clicking the previous segment (Call Tree).
Library
Instruments are made part of an Instruments trace document either by being instantiated from a template or by being dragged in from the Library window.
The Library palette (Window →Library, ![]() L, or the + toggle button in the toolbar) lists all of the known instruments. Initially this is a repertoire of Apple-supplied tracks, but it is possible to add your own. The palette lists all known instruments. Selecting one fills the pane below the list with a description. See Figure 26.4. Some descriptions include a (?) button, which only takes you to the root page of the Instruments manual in Xcode’s Documentation browser.
L, or the + toggle button in the toolbar) lists all of the known instruments. Initially this is a repertoire of Apple-supplied tracks, but it is possible to add your own. The palette lists all known instruments. Selecting one fills the pane below the list with a description. See Figure 26.4. Some descriptions include a (?) button, which only takes you to the root page of the Instruments manual in Xcode’s Documentation browser.
Figure 26.4 A scrolling list of available instruments dominates the Library palette. The selected instrument is described in the panel below. Selecting a category from the popup menu narrows the list down by task, and the search field at the bottom allows you to find an instrument from its name or description.
The Library gathers instruments into groups; these are initially hidden, but they can be seen if you select Show Group Banners from the Action (gear) popup at the lower-left corner of the palette. The Action menu will also allow you to create groups of your own—drag an instrument into your group to add it; or smart groups, which filter the library according to criteria you choose. The popup at the top of the palette narrows the list down by group, and the search field at the bottom allows you to filter the list by searching for text in the names and descriptions.
Note
Note the split-view dimple under the group popup; drag it down, and the popup is replaced by a table of sections.
Tracing
Now we can turn to the trace document as a document—how to get data into it, how to save that data.
Recording
There is more than one way to start recording in Instruments.
The most obvious is to create a trace document and press the Record (red-dot) button in the toolbar. Recording starts, the target application comes to the front, you perform your test, switch back to Instruments, and press the same button, now displaying the black-square “stop” symbol.
The first time you record into a document that contains a Mac User Interface instrument (Mac targets only), the instrument captures your interaction with the target app into a list of events like key presses, mouse moves, and clicks. The Record Settings inspector’s Action popup allows you to have the next run Record UI events as before, or Drive them, replaying the recorded actions, on the next run.
Note
The iOS side of Instruments gives you the same facility through the Automation instrument. Drop the instrument into the Track area, and attach a JavaScript script that will drive your application. When the Track runs, Automation will perform the UI actions you prescribed, and the other instruments will accumulate traces that you can compare directly between runs. Search the Documentation browser for “UI Automation JavaScript Reference” for details.
A second way to record is through a global hot key combination. To set the combination, Open the Keyboard panel in System Preferences, select the Shortcuts tab, and seek out the Development group under Services. The group includes a number of profiling actions, such as collecting a time profile of the application under the mouse cursor. One of the options is Toggle Instruments Recording. Set the combination by clicking the add shortcut button in that row of the table.
Note
I never remember these global hot keys. Do yourself a favor and check the box next to the service, so it will show up in the Services submenu of the application menu. The Instruments-related command will appear with its hot key combination. If there’s no combination, you’ll know that the app you’re running has probably taken the combination for itself.
Instruments gives you a shortcut to the System Preferences window in the General tab in its own Preferences window: an Open Keyboard Shortcut Preferences button.
With the Toggle Instruments Recording hot key set, set up a trace document for the app you want to record—but don’t run it. Run the app, then press the key combination you chose. Instruments will start recording. Press it again, and recording stops.
If you assign a key combination for other Instruments services, such as Allocations & Leaks, then Instruments will create a new trace document targeting the front application and record its memory activity. The same with File Activity, System Trace, and the other services that share the names of Instruments templates.
Take special note of the three Time Profile commands, which target the active application, the background application that has a window under the mouse pointer, or the whole system. The option of pointing the mouse at one of the target’s windows allows you to start simultaneous traces on more than one application without having to disturb their place in the window ordering.
Displaying an ongoing trace, especially for more than one application, puts a significant performance burden on the system; I’ll get into the details shortly. This can be a particular problem if you use hot keys to record more than one application. If you check Always use deferred mode in the General tab of the Preferences window, you can ensure that your hot-key traces will be as lightweight as possible.
The third way to record is through the Mini Instruments window. Selecting View → Mini Instruments hides all of Instruments’ windows and substitutes a floating heads-up window (see Figure 26.5) listing all of the open trace documents.

Figure 26.5 The Mini Instruments floating window. It lists each open trace document next to a clock and a recording button. Scroll through the list using the arrowheads at top and bottom.
The window lists all of the trace documents that were open when you switched to Mini mode; scroll through by pressing the up or down arrowheads above and below the list. At the left of each item is a button for starting (round icon) or stopping (square icon) recording, and a clock to show how long recording has been going on. Stopping and restarting a recording adds a new run to the document.
Closing the Mini Instruments window activates Instruments and restores the trace windows.
As with the hot keys, Mini Instruments has the advantage that it’s convenient to start recording in the middle of an application’s run (handy if you are recording a User Interface track that you want to loop). It eliminates the overhead of updating the trace displays.
I mentioned the burden a tracing session can put on the performance of your computer. While a trace runs, Instruments analyzes the data it collects, building up profiles and tables. Often it has to refer back to earlier data (like matching memory events to blocks and updating living-versus-transient counts) to keep the analysis current.
Computers are fast, but the process takes resources away from the target application (thus making it difficult to measure your app against real-world conditions) and can force Instruments to skip data points. You can prevent this by deferring analysis until the trace stops. File →Record Options. . . ( ![]() R) sets parameters for tracing, like delaying data collection until a fixed time after launching the application, or limiting collection to a fixed period. The option you’re interested in is the Deferred Mode checkbox. While it’s checked, Instruments will black out the trace window until the run ends. Once the run does end, the blackout will continue as Instruments conducts the postmortem analysis, and then you’ll see your trace. See Figure 26.6.
R) sets parameters for tracing, like delaying data collection until a fixed time after launching the application, or limiting collection to a fixed period. The option you’re interested in is the Deferred Mode checkbox. While it’s checked, Instruments will black out the trace window until the run ends. Once the run does end, the blackout will continue as Instruments conducts the postmortem analysis, and then you’ll see your trace. See Figure 26.6.
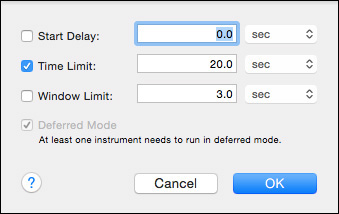
Figure 26.6 File →Record Options. . . ( ![]() R) produces a sheet in which you can restrict the scope of an Instruments tracing session and improve the efficiency of the trace by deferring analysis until after the trace is done. In this case, an instrument in the trace document requires deferred analysis.
R) produces a sheet in which you can restrict the scope of an Instruments tracing session and improve the efficiency of the trace by deferring analysis until after the trace is done. In this case, an instrument in the trace document requires deferred analysis.
Saving and Reopening
Like any other Macintosh document, a trace document can be saved. The document will contain its instruments and all the data they’ve collected. There can be a lot of data—potentially, full stack traces for events only microseconds apart—so expect a trace document to be large. Gigabytes are not uncommon. Trace documents generally respond well to ZIP archiving.
Another option is to save your document as a template. It’s likely that you will come to need a uniform layout of instruments that isn’t included in the default templates provided by Apple. You can easily create templates of your own, which will appear in the template sheet presented when you create a new trace document. Configure a document as you want it, and select File →Save as Template. . . .
The ensuing save-file sheet is the standard one, focused on the directory in which Instruments looks for your templates, ~/Library/Application Support/Instruments/Templates. The name you give your file will be the label shown in the template-choice sheet. At the lower-left of the sheet is a well into which you can drag an icon to be displayed in lists that include your custom templates. For instance, if your template is for testing your application, you’d want to drop your application’s icon file here. Holding the mouse button over the well will display a popup menu so you can choose Apple-provided icons. The panel provides a text area for the description to be shown in the template-choice sheet.
![]() The document’s suite of instruments, and their configurations, will be saved in the template.
The document’s suite of instruments, and their configurations, will be saved in the template.
![]() The template will include the target you set.
The template will include the target you set.
![]() If you include a prerecorded User Interface track, the contents will be saved. This way you can produce uniform test documents simply by creating a new trace document and selecting the template.
If you include a prerecorded User Interface track, the contents will be saved. This way you can produce uniform test documents simply by creating a new trace document and selecting the template.
As you’d expect, you can reopen a trace document by double-clicking it in the Finder, or by using the File →Open. . . command. All of the data is as it was when the document was saved. Pressing Record adds a new run to the document.
Tracing without Instruments
There are three ways to run traces without having to launch Instruments. With the instruments command-line tool, you can select the target application and either a template or an existing trace document to capture the trace data. The DTPerformanceSession framework allows you to initiate traces from your source code without having to bother with the Instruments app’s template and document infrastructure. And iprofiler provides the same lightweight profiling service from the command line. See man instruments, man iprofiler, and the DTPerformanceSession documentation for details.
The Instruments
There are 44 instruments that come with the Instruments application, plus any custom instruments you might create yourself. The Library palette, Window →Library ( ![]() L), lists them all. The list in this section follows the Library’s organization, adding details as I’ve gleaned them.
L), lists them all. The list in this section follows the Library’s organization, adding details as I’ve gleaned them.
Some instruments aren’t documented beyond the sentence or two they get in the Library, plus what is implied by the data they display. The listing rarely identifies which platform the instrument can target. In some cases, I can make up the gap; in others, my guess is as good as yours, often because they crash before you can see the results.
Behavior
![]() Sudden Termination (Mac only)—Audits the OS X feature of directly killing apps that volunteer that they’d be safe to kill. This instrument flags all of your filesystem activity that happens while you’ve signaled the system that a sudden kill would be okay. If you’re actively reading and writing files, it may not be a good idea to subject yourself to termination without notice.
Sudden Termination (Mac only)—Audits the OS X feature of directly killing apps that volunteer that they’d be safe to kill. This instrument flags all of your filesystem activity that happens while you’ve signaled the system that a sudden kill would be okay. If you’re actively reading and writing files, it may not be a good idea to subject yourself to termination without notice.
Core Data
![]() Core Data Saves—At each save operation in Core Data, records the thread ID, stack trace, and how long the save took.
Core Data Saves—At each save operation in Core Data, records the thread ID, stack trace, and how long the save took.
![]() Core Data Fetches—Captures the thread ID and stack trace of every fetch operation under Core Data, along with the number of objects fetched and how long it took to complete the fetch.
Core Data Fetches—Captures the thread ID and stack trace of every fetch operation under Core Data, along with the number of objects fetched and how long it took to complete the fetch.
![]() Core Data Faults—Core Data objects can be expensive both in terms of memory and in terms of the time it takes to load them into memory. Often, an
Core Data Faults—Core Data objects can be expensive both in terms of memory and in terms of the time it takes to load them into memory. Often, an NSManagedObject or a to-many relationship is given to you as a fault, a kind of IOU that will be paid off in actual data when you reference data in the object. This instrument captures every firing (payoff) of an object or relationship fault. It can display the thread ID and stack depth of the fault, as well as how long it took to satisfy object and relationship faults.
![]() Core Data Cache Misses—A faulted Core Data object may already be in memory; it may be held in its
Core Data Cache Misses—A faulted Core Data object may already be in memory; it may be held in its NSPersistentStoreCoordinator’s cache. If, however, you fire a fault on an object that isn’t in the cache (a “cache miss”), you’ve come into an expensive operation, as the object has to be freshly read from the database. You want to minimize the effect of cache faults by preloading the objects when it doesn’t impair user experience.
This instrument shows where cache misses happen. It records the thread ID and stack trace of each miss, and how much time was taken up satisfying the miss, for objects and relationships.
Dispatch
![]() Dispatch (Mac only)—Records Grand Central Dispatch events, the status of queues, and the duration of dispatched tasks.
Dispatch (Mac only)—Records Grand Central Dispatch events, the status of queues, and the duration of dispatched tasks.
Filesystem
![]() Directory I/O (Mac only)—Records every event of system calls affecting directories, such as creation, moving, mounting, unmounting, renaming, and linking. The data include thread ID, stack trace, call, path to the file directory affected, and the destination path.
Directory I/O (Mac only)—Records every event of system calls affecting directories, such as creation, moving, mounting, unmounting, renaming, and linking. The data include thread ID, stack trace, call, path to the file directory affected, and the destination path.
![]() File Activity (Mac only)—Records every call to
File Activity (Mac only)—Records every call to open, close, fstat, open$UNIX2003, and close$UNIX2003. The instrument captures thread ID, call stack, the call, the file descriptor, and path.
![]() File Attributes (Mac only)—For every event of changing the owner, group, or access mode of a file (
File Attributes (Mac only)—For every event of changing the owner, group, or access mode of a file (chown, chgrp, chmod), this instrument records thread ID, a stack trace, the called function, the file descriptor number, the group and user IDs, the mode flags, and the path to the file affected.
![]() File Locks (Mac only)—Records the thread ID, stack trace, function, option flags, and path for every call to the
File Locks (Mac only)—Records the thread ID, stack trace, function, option flags, and path for every call to the flock system function.
![]() I/O Activity (iOS only)—Combines the functionality of all the Mac-only instruments in this category into one comprehensive instrument for iOS. By default, it only collects how long each call lasted, but click the Configure button to see what else is available.
I/O Activity (iOS only)—Combines the functionality of all the Mac-only instruments in this category into one comprehensive instrument for iOS. By default, it only collects how long each call lasted, but click the Configure button to see what else is available.
Graphics
![]() Core Animation (iOS)—Collects statistics for the current state of OpenGL, including wait times for callers, counts of surfaces and textures, and how full video RAM is, as it relates to your app’s use of the high-level Core Animation framework.
Core Animation (iOS)—Collects statistics for the current state of OpenGL, including wait times for callers, counts of surfaces and textures, and how full video RAM is, as it relates to your app’s use of the high-level Core Animation framework.
![]() GPU Driver (Mac or iOS)—collects the same statistics as the Core Animation instrument, at the lower level of OpenGL/OpenGL ES. There are two instruments of the same name. Drag one of them into your trace document; if you guess wrong, a yellow warning triangle will appear in the lower-right corner of the track, and you should try the other.
GPU Driver (Mac or iOS)—collects the same statistics as the Core Animation instrument, at the lower level of OpenGL/OpenGL ES. There are two instruments of the same name. Drag one of them into your trace document; if you guess wrong, a yellow warning triangle will appear in the lower-right corner of the track, and you should try the other.
![]() OpenGL ES Analyzer (iOS)—Analyzes your app’s usage of OpenGL ES, flagging stalls and other errors, yielding a ranked table of problems and suggestions on how to avoid them.
OpenGL ES Analyzer (iOS)—Analyzes your app’s usage of OpenGL ES, flagging stalls and other errors, yielding a ranked table of problems and suggestions on how to avoid them.
Input/Output
![]() Reads/Writes—
Reads/Writes—reads and writes to file descriptors. Each event includes the thread ID, the name of the function being called, a stack trace, the descriptor and path of the file, and the number of bytes read or written.
Master Tracks
![]() User Interface (Mac only), on first run, records mouse and keyboard events as you use your OS X application. You’ll be asked to authorize Instruments to control your application, through the System Preferences application →Security & Privacy → Privacy →Accessibility. After that, running the trace plays your UI events back so you can have a uniform baseline for your program as you make adjustments.
User Interface (Mac only), on first run, records mouse and keyboard events as you use your OS X application. You’ll be asked to authorize Instruments to control your application, through the System Preferences application →Security & Privacy → Privacy →Accessibility. After that, running the trace plays your UI events back so you can have a uniform baseline for your program as you make adjustments.
![]() Cocoa Layout (Mac only) records any changes to
Cocoa Layout (Mac only) records any changes to NSLayoutConstraint objects, either in the target application or anywhere in the system. It’s not very easy to pick what you need out of the collected data; the best approach is to track down the view you’re interested in, and enter its address in the search field.
My copy of Instruments puts Cocoa Layout in the “Custom Instruments” category, not Master Track, but it makes more sense for me to put it next to User Interface.
Memory
![]() Allocations (iOS and Mac)—Collects a comprehensive history of every block of memory allocated during the run of the trace. Every event is tagged with the block address and the current stack trace. Configuration options let you track Cocoa reference-counting events and create “zombie” objects. You learned how to use it in Chapter 16, “Measurement and Analysis.”
Allocations (iOS and Mac)—Collects a comprehensive history of every block of memory allocated during the run of the trace. Every event is tagged with the block address and the current stack trace. Configuration options let you track Cocoa reference-counting events and create “zombie” objects. You learned how to use it in Chapter 16, “Measurement and Analysis.”
![]() Leaks (iOS and Mac)—Tracks the allocation and deallocation of objects in an application in order to detect the objects’ being allocated and then lost—in other words, memory leaks. Leaks does not rely simply on balancing allocations and deallocations; it periodically sweeps your program’s heap to detect blocks that are not referenced by active memory. If the Allocations instrument is set to monitor zombies, Leaks won’t record because zombie objects, which are never deallocated, are all leaked. For an extensive example, see Chapter 16, “Measurement and Analysis.”
Leaks (iOS and Mac)—Tracks the allocation and deallocation of objects in an application in order to detect the objects’ being allocated and then lost—in other words, memory leaks. Leaks does not rely simply on balancing allocations and deallocations; it periodically sweeps your program’s heap to detect blocks that are not referenced by active memory. If the Allocations instrument is set to monitor zombies, Leaks won’t record because zombie objects, which are never deallocated, are all leaked. For an extensive example, see Chapter 16, “Measurement and Analysis.”
![]() Shared Memory (Mac only)—Records an event when shared memory is opened or unlinked. The event includes calling thread ID and executable, stack trace, function (
Shared Memory (Mac only)—Records an event when shared memory is opened or unlinked. The event includes calling thread ID and executable, stack trace, function (shm_open / shm_unlink), and parameters (name of the shared memory object, flags, and mode_t). Selecting an event in the Detail table puts a stack trace into the Extended Detail pane.
![]() VM Tracker (iOS and Mac)—Takes a “snapshot” of the virtual-memory zones associated with your application, recording the size of each zone, and whether it is shared or private. The trace shows total usage, but the real story is in the “dirty” trace: The VM system can share things like system libraries across applications from a single chunk of physical RAM, and memory that the app hasn’t written to is “clean”—the system can simulate that memory as zeroes without taking up any actual RAM. As soon as your app writes to memory, those addresses become dirty, and they must consume precious physical memory.
VM Tracker (iOS and Mac)—Takes a “snapshot” of the virtual-memory zones associated with your application, recording the size of each zone, and whether it is shared or private. The trace shows total usage, but the real story is in the “dirty” trace: The VM system can share things like system libraries across applications from a single chunk of physical RAM, and memory that the app hasn’t written to is “clean”—the system can simulate that memory as zeroes without taking up any actual RAM. As soon as your app writes to memory, those addresses become dirty, and they must consume precious physical memory.
Don’t bother with VM Tracker on the iOS Simulator; at the virtual-memory level, it’s a Mac application with no relation to how memory would be used on an iOS device.
By default, you have to click a Snapshot Now button in the Options view to collect heap data. You can check Automatic Snapshotting if you want to collect data periodically.
System
Two kinds of instruments fall into the System category: instruments that actively record the state of the target machine, and those that read logs an iOS device had recorded as it had been used untethered to a Mac. I’ll treat them as if they were separate.
![]() Activity Monitor (iOS and Mac)—An analogue to the Unix
Activity Monitor (iOS and Mac)—An analogue to the Unix top command, with the option to focus on only one process. This instrument is too varied to explain fully here, but its features should be easy to understand if you explore its configuration inspector. It collects 31 summary statistics on a running process, including thread counts, physical memory usage, virtual memory activity, network usage, disk operations, and percentages of CPU load. Remember that you can have more than one Activity Monitor instrument running, targeting different applications or the system as a whole.
![]() Connections (iOS only)—Measures all IP networking activity for an iOS device or any of its processes, in real time.
Connections (iOS only)—Measures all IP networking activity for an iOS device or any of its processes, in real time.
![]() Counters and Event Profiler (Mac only)—Track CPU and low-level system events using hardware diagnostic counters built into each core of the CPU. The data are eye-wateringly primitive, but if you’ve come to optimizing your code instruction by instruction, such as locating possibly inefficient branches, these instruments are the way to go.
Counters and Event Profiler (Mac only)—Track CPU and low-level system events using hardware diagnostic counters built into each core of the CPU. The data are eye-wateringly primitive, but if you’ve come to optimizing your code instruction by instruction, such as locating possibly inefficient branches, these instruments are the way to go.
Window →Manage Flags. . . (![]() T) controls which flags are to trigger a count in Counters. Expect a noticeable performance hit when Counters is running. For Event Profiler, Window →Manage PM Events. . . (
T) controls which flags are to trigger a count in Counters. Expect a noticeable performance hit when Counters is running. For Event Profiler, Window →Manage PM Events. . . ( ![]() P) sets the flags to audit.
P) sets the flags to audit.
![]() Process (Mac)—Records thread ID, stack trace, process ID, exit status, and executable path for each start (
Process (Mac)—Records thread ID, stack trace, process ID, exit status, and executable path for each start (execve) and end (exit) event in a process.
![]() Sampler (iOS and Mac)—Periodically samples the target application at fixed intervals (1 ms by default, but you can set it in the inspector), and records a stack trace each time. This instrument has been superseded by Time Profiler, except in cases, like measuring graphics performance, when it is essential to minimize the effect of CPU sampling on other measurements.
Sampler (iOS and Mac)—Periodically samples the target application at fixed intervals (1 ms by default, but you can set it in the inspector), and records a stack trace each time. This instrument has been superseded by Time Profiler, except in cases, like measuring graphics performance, when it is essential to minimize the effect of CPU sampling on other measurements.
![]() Spin Monitor (Mac only)—Focuses on one OS X application, or all, and logs stack traces when they become unresponsive. An application is “unresponsive” when it has spent more than a few seconds without attempting to collect a human-interface event. This is when the multicolored spinning “beachball” cursor occurs. This is a serious fault in an application, but you can’t often reproduce spins. Spin Monitor sleeps most of the time, taking up very few resources until a spin activates it.
Spin Monitor (Mac only)—Focuses on one OS X application, or all, and logs stack traces when they become unresponsive. An application is “unresponsive” when it has spent more than a few seconds without attempting to collect a human-interface event. This is when the multicolored spinning “beachball” cursor occurs. This is a serious fault in an application, but you can’t often reproduce spins. Spin Monitor sleeps most of the time, taking up very few resources until a spin activates it.
![]() Time Profiler (iOS and Mac)—Periodically samples the target application at fixed intervals (1 ms by default, but you can set it in the inspector), and records a stack trace each time. You can then get a statistical picture of what parts of your application are taking up the most time. This is an essential tool, doing what most people mean when they speak of profiling an application. Chapter 16, “Measurement and Analysis,” demonstrated the use of Time Profiler.
Time Profiler (iOS and Mac)—Periodically samples the target application at fixed intervals (1 ms by default, but you can set it in the inspector), and records a stack trace each time. You can then get a statistical picture of what parts of your application are taking up the most time. This is an essential tool, doing what most people mean when they speak of profiling an application. Chapter 16, “Measurement and Analysis,” demonstrated the use of Time Profiler.
When Time Profiler is in a trace document, a bar is added above the Track area that lets you refine the profile: The segment control at the left provides an overview trace (middle), or it can divide the trace among CPU cores (left) or by thread (right). A series of popup menus let you restrict the trace by processor core, process, and thread; and they let you color-code by user and kernel load. A popup at the right end of the bar shows the colors used in the chart.
Note
A number of instruments from Xcode 5 have been removed—almost all the ones with “Monitor” in their names. These weren’t really unique instruments, just Activity Monitor with a couple of statistics enabled. If you miss them, use Activity Monitor and check off the statistics that interest you. If you use the Stacked graph type and Increase Deck Size to make the track taller, you’ll have the same effect.
System—iOS Energy Instruments
The Instruments Library puts iOS energy instruments in the “System” category, but they are different. They don’t rely on Instruments to run the trace, because running them only when the device is tethered to a Mac would be counterproductive. When you designate a device for development, Xcode (or Instruments) installs a daemon on the device that can log activity that influences power drain.
You can analyze the logs when the device is plugged into Instruments again. Open Instruments and select File →Import Energy Diagnostics from Device.
By default, logging is off and must be turned on with the Settings app. The daemon itself can be turned off with the Developer panel in Settings or by an untethered reboot. If the battery runs out entirely, the daemon won’t restart.
These are the instruments that analyze the usage logs:
![]() Bluetooth, GPS, and WiFi—Log when the respective radios are on.
Bluetooth, GPS, and WiFi—Log when the respective radios are on.
![]() CPU Activity—This instrument is a compact version of Activity Monitor showing the total load on the CPU, with breakouts for the foreground app, audio, and graphics.
CPU Activity—This instrument is a compact version of Activity Monitor showing the total load on the CPU, with breakouts for the foreground app, audio, and graphics.
![]() Display Brightness—This instrument records the on/off state and brightness setting of the device’s backlight. Ambient-light adjustments don’t get logged.
Display Brightness—This instrument records the on/off state and brightness setting of the device’s backlight. Ambient-light adjustments don’t get logged.
![]() Energy Usage—Overall power drain on a scale of 20. When the device is plugged or unplugged to a power source, the event is flagged.
Energy Usage—Overall power drain on a scale of 20. When the device is plugged or unplugged to a power source, the event is flagged.
![]() Network Activity—Logs overall network usage in terms of bit and packet rates.
Network Activity—Logs overall network usage in terms of bit and packet rates.
![]() Sleep/Wake—Logs whether the device is asleep, along with sleep-transition states.
Sleep/Wake—Logs whether the device is asleep, along with sleep-transition states.
Threads/Locks
Thread States (Mac only)—Represents each thread in the target application by a block, colored to indicate the state of the thread—running, waiting, suspended, etc.—at each moment. The Record Settings inspector has the color code (see Figure 26.7).

Figure 26.7 The Thread States instrument shows the state of every thread in a process as a stack of color-coded bars.
Trace
Scheduling, System Calls, and VM Operations (iOS, Mac)—These keep a complete record of the transitions between threads; between your user code and the underlying kernel; and of the layout of your working memory as managed by the virtual-memory system. You can read the duration of the time your code had to wait for kernel-level processing to complete. The track has two “strategies” for display, selectable through a segmented control at the left end of the bar that these instruments will insert above the time track.
These instruments force the use of deferred mode, and they insert a bar above the time scale to select display “strategies”: bar graphs of “event density,” or timelines that show state and flag transitions—click a flag and get a description of the transition type, timing, and a stack trace.
The bar includes a popup to narrow the display to specific processes and threads.
UI Automation
Automation (iOS only)—Executes a JavaScript script that exercises the UI of an iOS application on a device or the iOS Simulator. Add other instruments to the trace document to produce a package that can reproduce a test and record the performance of your app as you develop it. You configure the instrument in the Options view of the Detail area. The most important part is the Scripts section, where the Add drop-down menu allows you to Import. . . a .js file to the track or Create. . . one in an editor within the Detail area.
UI Automation comes with an extensive class tree; consult the “Instruments User Guide” and the “UIAutomation Reference Collection” for details.
User Interface
Carbon Events (Mac only)—Monitors events returned from WaitNextEvent. Carbon Events records an event at every return from WaitNextEvent and its cousins. It captures the thread ID, the stack trace, the event code, and a string (like “Key Down”) that characterizes the event.
Cocoa Events (Mac only)—Records the event objects dispatched through every call to -[NSApplication sendEvent:]. It captures the thread ID, the stack trace, the event code, and a string (like “Left Mouse Down”) that characterizes the event.
Custom Instruments
Many of the instruments included in Instruments consist of code specially written for the task, but most involve no native code at all. They are made from editable templates: You can examine these instruments yourself—this may be the only way to get authoritative details on what an instrument does—and you can create instruments of your own.
Let’s see what a scripted instrument looks like. Create a trace document from the File Activity template, select the Reads/Writes instrument and then Instrument →Edit ‘Reads/Writes’ Instrument (or simply double-click on the instrument’s label). An editing sheet (see Figure 26.8) will appear with fields for the instrument’s name, category, and description, and a long scrolling list of probes, handlers for events the instrument is meant to capture.

Figure 26.8 The Edit Instrument sheet for the Reads/Writes instrument. The sheet is dominated by an editable list of events the instrument is to capture. The portion that specifies how to record entries to the system pwrite function is shown here.
Figure 26.8 shows the event list scrolled to the condition called PWrite, in the domain System Call, for the symbol pwrite. It is to trigger when pwrite is entered. Next comes the text of a script to be executed when the probe is triggered. Instruments uses the DTrace kernel facility, which has its own scripting language; for instance, this event might put the time at which the event occurred into a thread variable of the probe, so that a pwrite-exit probe could calculate the duration of the call and record it. In this case, the scripting text is blank.
Then comes a series of items specifying what information is to be kept, for the trace graph or for the Detail view. In the case of Reads/Writes, this is
![]() The name of the function.
The name of the function.
![]() The name of the executable.
The name of the executable.
![]() The first argument (the file descriptor), which is an integer to be labeled “FD.”
The first argument (the file descriptor), which is an integer to be labeled “FD.”
![]() A string, to be labeled “Path,” calculated from an expression in the DTrace language: a file path, derived from the file descriptor within the executable.
A string, to be labeled “Path,” calculated from an expression in the DTrace language: a file path, derived from the file descriptor within the executable.
![]() The third argument (the size of the write), which is an integer to be labeled “Bytes.”
The third argument (the size of the write), which is an integer to be labeled “Bytes.”
At the bottom of the edit sheet is a drop-down menu that controls whether the instrument records a stack trace for its events, and whether the stack should be taken from user, kernel, or no space.
Integer-valued records are included in the configuration inspector’s list of Statistics to Graph and are eligible to display in the instrument’s trace. This accounts for the odd presence of “tid” (the thread ID) in the list of available plots you’ll see if you click the Configure button in the instrument-configuration popover.
The customization sheet is a front end for the scripting language for the kernel-provided DTrace tool; only kernel-level code is capable of detecting call events in every process. The section “Creating Custom Instruments,” in the Instruments User Guide, offers enough of an introduction to the language to get you started on your own instruments.
To make your own instrument, start with Instrument →Build New Instrument. . . ( ![]() B). An instrument editing sheet will drop from the front trace document, and you can proceed from there.
B). An instrument editing sheet will drop from the front trace document, and you can proceed from there.
If visiting https://wikis.oracle.com/display/DTrace/Documentation has made you a DTrace expert, you may find it more convenient, or more flexible, to write your scripts directly, without going through the customization sheet. Select File →DTrace Script Export. . . to save a script covering every instrument in the current document, and File →DTrace Data Import. . . to load a custom script. You can export DTrace scripts only from documents that contain DTrace instruments exclusively.
The Templates
Between iOS, OS X, and the iOS Simulator, there are 22 trace-document templates built into Instruments, and as you’ve seen, you can add your own. The Templates assistant presents these in four sections: one for each platform, plus yours.
This section lists all of the available templates, with the instruments they contain, sorted by platform. iOS Simulator shares some instruments with both iOS and OS X; I’ll call them out in the platform lists.
All Platforms
Six templates are platform independent: They appear in all three parts of the source list.
![]() Blank: a document with no instruments in it
Blank: a document with no instruments in it
![]() Activity Monitor: Activity Monitor
Activity Monitor: Activity Monitor
![]() Allocations: Allocations, VM Tracker
Allocations: Allocations, VM Tracker
![]() Leaks: Allocations, Leaks
Leaks: Allocations, Leaks
![]() System Trace: Scheduling, System Calls, VM Operations
System Trace: Scheduling, System Calls, VM Operations
![]() Time Profiler: Time Profiler
Time Profiler: Time Profiler
iOS Only
These seven templates are for iOS targets only, though one of them, Automation, is also available in the iOS Simulator.
![]() Automation: Automation (also on iOS Simulator)
Automation: Automation (also on iOS Simulator)
![]() Core Animation: Core Animation, Time Profiler
Core Animation: Core Animation, Time Profiler
![]() Energy Diagnostics: These are the analyzers for logs a device accumulates while it’s untethered from Instruments—Bluetooth, CPU Activity, Display Brightness, Energy Usage, GPS, Network Activity, Sleep/Wake, WiFi
Energy Diagnostics: These are the analyzers for logs a device accumulates while it’s untethered from Instruments—Bluetooth, CPU Activity, Display Brightness, Energy Usage, GPS, Network Activity, Sleep/Wake, WiFi
![]() GPU Driver: GPU Driver, Time Profiler
GPU Driver: GPU Driver, Time Profiler
![]() Network: Connections
Network: Connections
![]() OpenGL ES Analysis: GPU Driver, OpenGL ES Driver
OpenGL ES Analysis: GPU Driver, OpenGL ES Driver
![]() System Usage: I/O Activity
System Usage: I/O Activity
Mac Only
Nine templates are for OS X applications, which in a few cases includes the simulator.
![]() Cocoa Layout: Cocoa Layout
Cocoa Layout: Cocoa Layout
![]() Core Data: Core Data Cache Misses, Core Data Fetches, Core Data Saves (also on iOS Simulator)
Core Data: Core Data Cache Misses, Core Data Fetches, Core Data Saves (also on iOS Simulator)
![]() Counters: Counters
Counters: Counters
![]() Dispatch: Dispatch
Dispatch: Dispatch
![]() File Activity: File Activity, File Attributes, Directory I/O, Reads/Writes (also on iOS Simulator)
File Activity: File Activity, File Attributes, Directory I/O, Reads/Writes (also on iOS Simulator)
![]() Multicore: Dispatch, Thread States
Multicore: Dispatch, Thread States
![]() Sudden Termination: Activity Monitor, Sudden Termination
Sudden Termination: Activity Monitor, Sudden Termination
![]() Zombies: Allocations, preconfigured to track zombie objects (also on iOS Simulator)
Zombies: Allocations, preconfigured to track zombie objects (also on iOS Simulator)
Summary
Instruments is a big topic, and I’ve put you through most of it. You started with a tour of the trace document window and moved on to populating it from the Library window. You learned general principles of how to configure an instrument track.
You saw the various ways to start and stop recordings, including human-interface recordings that can be played back to generate repeatable tests for your applications.
You walked through a partial inventory of the instruments and document templates Apple supplies and how to create your own.
As your needs and expertise progress, you’ll want to consult the Instruments User Guide, to be found in Xcode’s Documentation browser.