
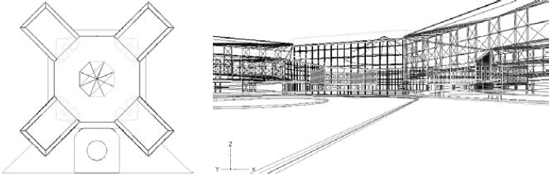
The topics in the previous chapters have worked with two axes, X and Y. In this chapter, I add the Z axis. When you have a drawing with 3D objects, you can view it from any angle. The view that you've been using in 2D drawings is like looking at a house from the top, which you could call a plan view or a floor plan. From this view, even a 3D drawing looks two dimensional. But when you look at a 3D drawing from an angle, you can see that there's more to it than meets the eye. Figure 21.1 shows the plan view of an office building on the left. On the right, you see the same drawing viewed in a perspective view from the front.
Although this drawing is quite complex, you can easily get started by working on simpler models. Three-dimensional drawing is not as difficult as it seems at first. In this chapter, I start by explaining how to work with 3D coordinates. I also cover wireframe models and 3D surfaces created with thickness and elevation. These are essentially 2D objects placed in 3D space and are therefore a good place to start when learning about drawing in 3D. Most of the features that I cover in this chapter apply to AutoCAD LT as well as to AutoCAD.
AutoCAD comes with a 3D workspace and template that set you up to work easily in 3D. These are not available in AutoCAD LT. To use the workspace, choose 3D Modeling from the Workspace Switching pop-up menu on the status bar.
To use the 3D template, choose Application Button
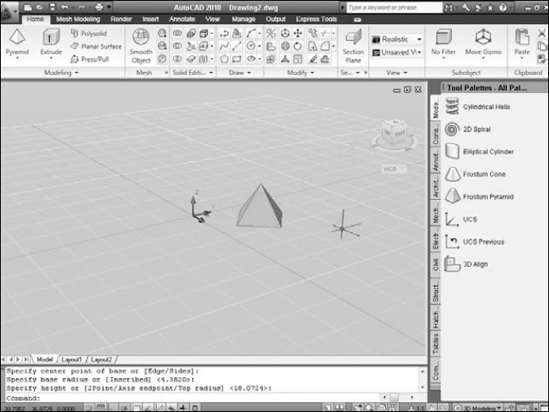
Figure 21.2. The acad3D.dwt template and the 3D Modeling workspace provide a suitable environment for working in 3D.
The grid is on, by default, to give you a sense of perspective and depth. The default viewpoint helps you see your 3D objects more clearly. You can change every aspect of what you see, including the colors, which palettes appear, and the viewpoint. Chapter 22 covers the ways to change the viewpoint and the visual style. Appendix A explains how to configure AutoCAD to look the way you want, including the colors of the grid and background.
All the 2D methods of specifying coordinates have their 3D counterparts. Just as you can draw a line by specifying a start point of 3,4 and an endpoint of 5,7, you can draw a 3D line by specifying a start point of 3,4,2 and an endpoint of 5,7,6. Absolute coordinates are the same in 3D — you just add a Z coordinate. In the same way, you can specify relative coordinates. In 3D drawings, you can use two new types of coordinates that are 3D counterparts of polar coordinates, cylindrical and spherical.
Note
Working with the User Coordinate System (UCS) is essential in 3D work. If you aren't familiar with the User Coordinate System, review the discussion in Chapter 8.
Most 2D commands accept 3D coordinates (a coordinate that includes a Z value) only on the first point. After that, you omit the Z coordinate because the Z value will be the same as that of the first point. For example, if you draw a rectangle, you can specify its first corner as 2,3,8 but the second corner must be specified without the Z value, as in 6,7. The Z value for the opposite corner is automatically 8.
The LINE command is an exception. It is a true 3D command, so you can specify X, Y, and Z values at all points.
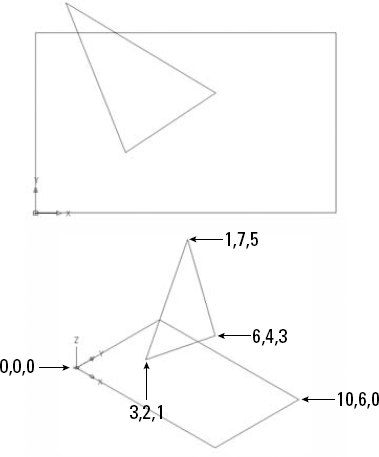
You don't use absolute coordinates more in 3D than you do in 2D — in fact, you may even use them less. But understanding absolute coordinates is important to understanding the Cartesian coordinate system that defines every point in your drawing. Figure 21.3 shows a wireframe model of a square and a triangle drawn with absolute coordinates, viewed from above (plan view) and from the southeast view (above, to the right, and in front). The square is drawn in 2D — which means that the Z coordinates are all zero — as a reference point for visualizing the 3D points of the triangle.
You can use relative coordinates in the same way by including the change in coordinates. For example, to draw the line from (3,2,1) to (6,4,3), shown in Figure 21.3, you can start with the absolute coordinate (3,2,1) and then specify 3,2,2 because that's the difference between (3,2,1) and (6,4,3).
Note
If you are using Dynamic Input with the default settings, specifying 3,2,2 as a second point is the same as specifying @3,2,2 with Dynamic Input off. For more information on Dynamic Input, see Chapter 4.
Just as polar coordinates are often more useful than Cartesian coordinates in 2D, cylindrical and spherical coordinates can be more useful in 3D. Here's how they work.
Cylindrical coordinates have the format (@)distance<angle,distance:
The first distance is the number of units in the XY plane from the origin (for absolute coordinates) or from your last point (for relative coordinates).
The angle is the number of degrees from the X axis in the XY plane.
The second distance is the number of units along the Z axis.
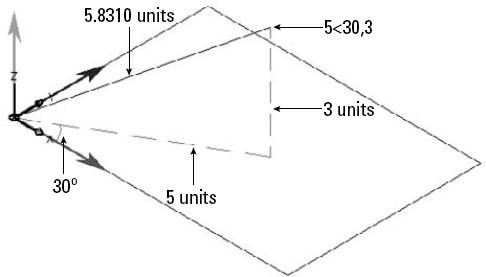
Cylindrical coordinates can be absolute or relative. You don't need to use the @ symbol for relative coordinates if Dynamic Input is on and set to the default option of relative coordinates. When you draw a line using cylindrical coordinates, neither distance that you specify is the length of the line. In essence, you're defining the lengths of two sides of a triangle to draw the hypotenuse. Figure 21.4 shows an example of a line drawn with cylindrical coordinates. The line was drawn from 0,0,0 to 5<30,3, which results in a line 5.8310 units long.
Note
You may find that cylindrical coordinates do not work very well with dynamic input turned on. In that case, click the Dynamic Input button on the status bar to turn off dynamic input.
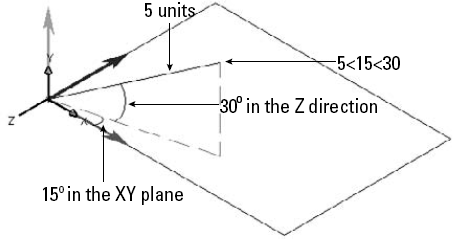
Spherical coordinates have the format distance<angle<angle:
The distance is the total number of units from the origin (for absolute coordinates) or from your last point (for relative coordinates).
The first angle is the number of degrees from the X axis in the XY plane.
The second angle is the number of degrees from the XY plane in the Z direction.
Spherical coordinates can be absolute or relative. You don't need to use the @ symbol for relative coordinates if Dynamic Input is on and set to the default option of relative coordinates. When you draw a line using spherical coordinates, the distance is the actual length of the line. Figure 21.5 shows an example of a line drawn with spherical coordinates. The line was drawn from 0,0,0 to 5<15<30.
Certain 2D editing commands work well in 3D. Others have special 3D versions. Because wireframes are simply 2D objects placed in 3D space, you can generally use the familiar editing commands. For example, to move an object 3 units in the positive Z axis direction, start the MOVE command and type 0,0,3 at the Specify base point or [Displacement] <Displacement>: prompt and press Enter twice. You can also use the 3DMOVE command, which I cover in Chapter 24.
You need to be careful when selecting objects for editing. For example, if you draw two identically sized rectangles at different Z coordinates, when you look at them from plan view, you see only one rectangle. How do you know which rectangle you're selecting? By changing the angle from which you view your drawing (as I explain in the next chapter), you can see all the parts of the drawing and can select objects easily.
Note
Multiple tiled viewports in which you view your drawing from different viewpoints can be very helpful in 3D drawing. For example, you can have a plan view in one viewport and a southeast view in another. Tiled viewports are covered in Chapter 8.
You can convert solids and certain surfaces to wireframes by extracting their edges with the XEDGES command (AutoCAD only). I cover this command in Chapter 23.
In the following exercise, you draw a simple wireframe piano bench and practice using 3D coordinates for both drawing and editing commands. You also view the drawing from two different angles.
Note
The drawing used in the following exercise on using 3D coordinates, ab21-a.dwg, is in the Drawings folder on the DVD.
STEPS: Using 3D Coordinates
Open
ab21-a.dwgfrom the DVD. This exercise assumes that you have dynamic input turned on, set to the default of relative coordinates. The drawing uses a 2D environment.Save it as
ab21-01.dwgin yourAutoCAD Biblefolder.Choose Home tab

Start the COPY command. To copy the rectangle 2 units above the original rectangle, follow the prompts:
Select objects:
Pick the rectangle. Select objects:Specify base point or [Displacement/mOde] <Displacement>:
0,0,2Specify second point or <use first point as displacement>:You now have two rectangles, but because you're looking from the top, you see only one.
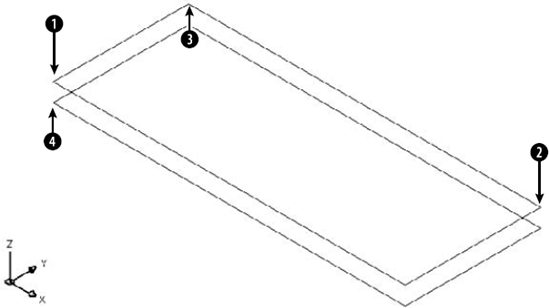
Choose View tab
If Object Snap is not turned on, click the Object Snap button on the status bar. Set a running object snap for Endpoint.
Start the LINE command. Follow the prompts:
Specify first point:
Pick the endpoint at
in Figure 21.6. Specify next point or [Undo]: #0,0,0(The # symbol forces an absolute coordinate.)Specify next point or [Undo]:1,0,0Specify next point or [Close/Undo]:0,0,21Specify next point or [Close/Undo]:Choose Home tab
Double-click your mouse wheel or choose View tab
Repeat the COPY command. Use two separate crossing windows to select the first leg; then the second leg. Each window should select three objects. End object selection. At the
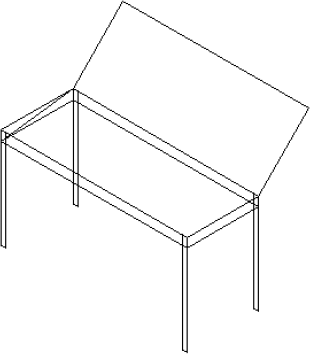
Specify base point or [Displacement/mOde] <Displacement>:prompt, type 0,15,0To draw an open cover for the piano bench, start the LINE command. Start it at the endpoint at

Turn dynamic input off by clicking the Dynamic Input button on the status bar. (Dynamic input doesn't support cylindrical coordinates very well.) To draw some bracing inside the bench, start the LINE command again. At the
Specify first point:prompt, choose the endpoint at
Save your drawing. It should look like Figure 21.7.
As mentioned earlier, it's often hard to tell which point you're picking in 3D. On a flat screen, you can be sure of only two dimensions. The other dimension is, so to speak, going in or out of the screen — it could be X, Y, or Z, depending on the angle that you're using to look at the drawing. That dimension is the one that's hard to pick on the screen. You use point filters, object snaps, object tracking, and grips to be sure that you have the right point in 3D drawings.
In Chapter 4, I discuss point filters for 2D objects. They work the same way in 3D. You usually use point filters together with object snaps. For example, for the X coordinate, you might pick the endpoint of a line. Often point filters are the only way to define a 3D point that isn't on an existing object. The point filters for 3D drawings are .xy, .xz, and .yz. For example, if you want to pick a point 3 units in the Z direction from the endpoint of an existing line, you can use the .xy point filter to choose the endpoint of the line. The prompt then asks you for the Z coordinate, which you can specify as a number or by using an object snap. You can also use point filters to specify each coordinate (X, Y, and Z) separately.
Object snaps are essential for 3D work. Turn on Object Snap and set running object snaps. Object snaps ensure that you're specifying the point that you want. However, don't forget that in 3D drawings, you can have two lines, one on top of the other. Use a view that enables you to see the two lines separately so that you can pick the object snap that you want.
Note
When you use an object snap in 3D, the Z value of the point comes from the Z value of the object. If you want to force a constant Z value, based on the current UCS or elevation, for a specific operation, temporarily change the OSNAPZ system variable to 1. (This system variable is not available in AutoCAD LT.) I discuss UCSs in 3D and elevation later in this chapter.
Tip
You can use point objects to help you draw in 3D. Set a visible point style (Home tab
You can use object tracking in 3D as well. For example, if you want to draw a line starting from the middle of a box, you can acquire the midpoints of two sides and start the line there. (I cover object tracking in Chapter 4.) Object tracking in 3D improves the ease with which you can find the exact 3D point that you need.
You can use grips to edit 3D objects. Again, it's important to choose a view that makes the editing easy. Grip-editing wireframes is somewhat different from grip-editing solids. Chapter 24 discusses 3D editing in AutoCAD in more detail.
Note
Grips are shown parallel to the plane of the current User Coordinate System. When you change your viewpoint, the grips change their shape slightly to look as if they are lying on the XY plane.
Note
The drawing used in the following exercise on using point filters and object snaps with 3D wireframe objects, ab21-b.dwg, is in the Drawings folder on the DVD.
STEPS: Using Point Filters, Object Tracking, and Object Snaps with 3D Wireframe Objects
Open
ab21-b.dwgfrom the DVD.Save it as
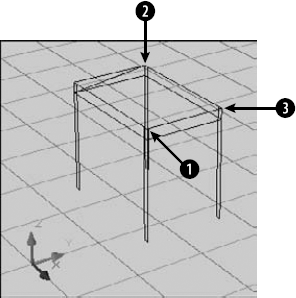
ab21-02.dwgin yourAutoCAD Biblefolder. Object Snap should be on. Set a running object snap for Endpoint and Midpoint. Make sure that Object Snap Tracking is on. This drawing uses a 3D environment, based onacad3D.dwt. This is the same piano bench drawn in the previous exercise, but without the cover. In this exercise, you use the bench to create a chair.Choose Home tab
Pan the chair to the bottom of your screen and zoom out a little to leave room for the back of the chair, which you will draw next.
Start the LINE command. Follow the prompts:
Specify first point:
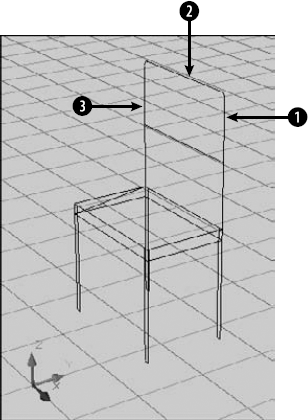
Choosein Figure 21.8. Specify next point or [Undo]:.xyof Pick. (need Z):45Specify next point or [Undo]:Pass the cursor overthe top endpoint of the line that you just drew, to acquire thepoint. Then pass the cursor over
to acquire that point. Movethe cursor to the approximate intersection of the two lines, untilyou see the Endpoint: -Z, Endpoint: Z tooltip, and click. Specify next point or [Close/Undo]:Pick. Specify next point or [Close/Undo]:Repeat the LINE command. Draw a line from the midpoint of the left side of the back of the chair to the midpoint of the right side.
Choose Home tab
At the
Select first object or [Undo/Polyline/Radius/Trim/Multiple]:prompt, pickRepeat the FILLET command and pick
Save the drawing. It should look like Figure 21.9.
You cannot draw arcs.
You cannot give the polyline a width.
You cannot use a noncontinuous linetype.
The 3DPOLY command can accept all 3D coordinates. You can also edit it with the PEDIT command, although there are fewer options.
Tip
If you want to create curved shapes in 3D space, you can create 2D polylines with a width and then add a thickness and an elevation. Elevation and thickness are both explained in the next section. Other options are available if you want to create surfaces (Chapter 23) or solids (Chapter 24).
Follow the prompts:
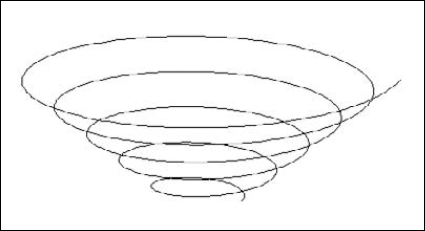
Specify center point of base:Specify the center point for the baseat the bottom of the helix. Specify base radius or [Diameter] <default>:Enter a radius (ordiameter) using the option. The default is the last radius you used. Specify top radius or [Diameter] <default>:Enter a radius for thetop of the helix. Specify helix height or [Axis endpoint/Turns/turn Height/tWist] <default>:Enter a height to use the default number of turns. Youcan also use the options to change the number of turns and thedirection of the twist. You can specify the height by specifyingan axis endpoint (the center of the top of the helix) or the turnheight.
Figure 21.10 shows a helix with five turns. You can grip-edit the helix to increase its height.
Wireframes have a number of limitations. In Figure 21.11, you can see the back leg through the seat of the chair. Also, creating the detail of a real chair would be tedious if you were to use individual lines or 3D polylines. Finally, wireframes don't have any surface or solid properties. You can't display them in any realistic fashion or calculate properties, such as area, mass, and so on.
You can create simple surfaces by adding thickness to 2D objects. When you add thickness to a 2D object, the object is pushed out into the third dimension. For example, a circle becomes a cylinder and a rectangle becomes a box. Remember that you won't see the thickness if you're looking at the object from the top. Figure 21.11 shows some objects created using thickness.
Surfaces created by adding thickness are sometimes called 2½D objects. Although they have three dimensions, the third dimension can only be a straight side perpendicular to the 2D object at the base.
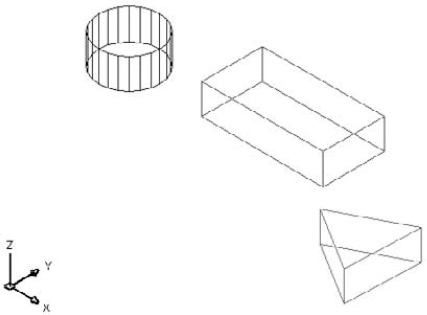
The parallel lines on the cylinder are called tessellation lines. These lines help you to visualize curved surfaces. They aren't actually part of the cylinder; for example, you can't use object snaps on them.
To add thickness to an existing 2D object, display the Properties palette (Ctrl+1) and select the object. (You can also select the object first.) In the palette, click the Thickness property and change the number in the Thickness text box. Press Enter.
Note
You can use the CONVTOSURFACE command to convert open polyline figures with no width, lines, and arcs to surfaces — as long as they have a thickness. You can use the CONVTOSOLID command to convert three types of closed wireframe objects with thickness to solids — polylines with a uniform width, closed polyline figures with no width, and circles. I discuss surfaces in Chapter 23 and solids in Chapter 24. These commands are not available in AutoCAD LT.
You can also change the current thickness. The current thickness affects new objects as you draw them, but does not affect existing objects. There are two ways to change the current thickness:
With no object selected, display the Properties palette (Ctrl+1). Click the Thickness property and type a value in the text box. Press Enter.
Use the ELEV command (which can also change the current elevation, discussed in the "Adding elevation to objects" section) by typing it on the command line. The ELEV command prompts you for the current elevation and the current thickness. At the prompt for a thickness, type a number and press Enter.
In most cases, you use a positive number, which extrudes objects in the positive direction of the Z axis. However, you can use a negative number to extrude objects in the negative direction of the Z axis. As soon as you change the current thickness, all objects that you draw have that thickness.
Warning
Because it's easy to forget the current thickness, unless you're drawing a number of objects with the same thickness, it's usually safer to draw objects with no thickness and then change the thickness. If you do change the current thickness, don't forget to change it back to zero when you're finished creating the 3D objects.
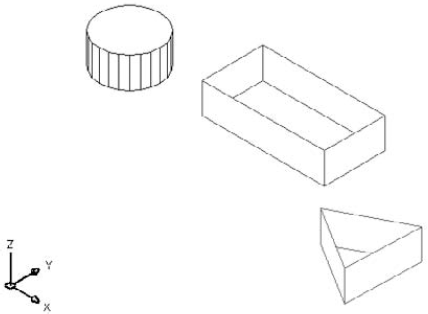
Because objects with thickness are surfaces, not wireframes, you can use the HIDE command to hide lines that would be hidden from view in real life. AutoCAD and AutoCAD LT calculate which lines are behind surfaces from the current viewpoint, and hide them. Figure 21.12 shows the same objects as Figure 21.11 after using the HIDE command. You may notice that the cylinder has a top, but the triangular prism and the box don't. For a further explanation, see the sidebar "Do objects with thickness have tops and bottoms?".
To return to the wireframe display, use the REGEN command. You use the HIDE command in AutoCAD LT or in a 2D environment in AutoCAD; in a 3D environment in AutoCAD, you use visual styles instead. I cover visual styles in Chapter 22.
Controlling the display of hidden lines and objects
You can control the display of polylines at the face intersections of solid and surface objects, including surfaces that you create using thickness. In a 2D environment in AutoCAD, and in AutoCAD LT, you use the HLSETTINGS command to specify settings that affect the display of hidden lines. For example, instead of hiding back lines completely, you could display them as dashed lines or in a different color. In AutoCAD, this opens the Visual Styles Manager palette; in AutoCAD LT, this opens the Hidden Line Settings dialog box.
Several system variables affect the 3D display only when you use the HIDE command or the 3D Hidden visual style. These system variables work on both solids and surfaces. Type hlsettings at the command prompt to open the Hidden Line Settings dialog box (AutoCAD LT) or Visual Styles Manager palette (AutoCAD), as shown in Figure 21.13. Note that I cover the Visual Styles Manager for other settings in Chapter 22.
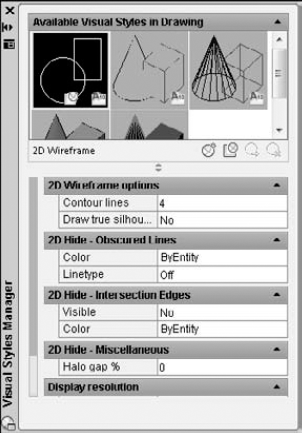
Figure 21.13. The Hidden Line Settings dialog box and the Visual Styles Manager (shown here) allow you to control the display of back lines in AutoCAD LT and AutoCAD, respectively.
Here's how to use the Hidden Line Settings dialog box and the Visual Styles Manager palette to specify the display of hidden lines.
Use the 2D Hide - Obscured Lines section (Obscured Lines in AutoCAD LT) to choose a linetype and color for displaying hidden lines. When you choose a linetype, hidden lines are shown in the linetype that you choose. These linetypes are not affected as you zoom in or out. Choose from these linetypes:
Off (fully hides back lines)
Solid
Dashed
Dotted
Short Dash
Medium Dash
Long Dash
Double Short Dash
Double Medium Dash
Double Long Dash
Medium Long Dash
Sparse Dot
If you choose a linetype, then choose a color from the Color drop-down list. You can choose from one of the standard color index numbers (from 1 to 255). Use the 2D Hide - Intersection Edges section (Face Intersections in AutoCAD LT) to turn on the display of polylines at the intersections of 3D model faces. Then use the Color drop-down list to choose a color for the polylines.
Use the 2D Hide - Miscellaneous section (Halo Gap Percentage in AutoCAD LT) to create a gap that shortens lines at the point that they would be hidden by the HIDE command, in order to set off the lines from the unhidden portion of the model. By default, this percentage is set to 0, which creates no gap. Set the gap as a percentage of an inch. The gap doesn't change as you zoom in or out.
You can set the HIDEPRECISION system variable to 1 if you want a more exact calculation of the HIDE command results. The process takes longer but yields better results in a complex drawing with many surfaces and solids. In AutoCAD, enter hideprecision
Use the HIDETEXT system variable to hide text behind other objects (a value of On, the default). When this system variable is set to Off, text will not hide other objects, or be hidden, unless it has a thickness. In AutoCAD LT, you can choose this option from the Hidden Line Settings dialog box.
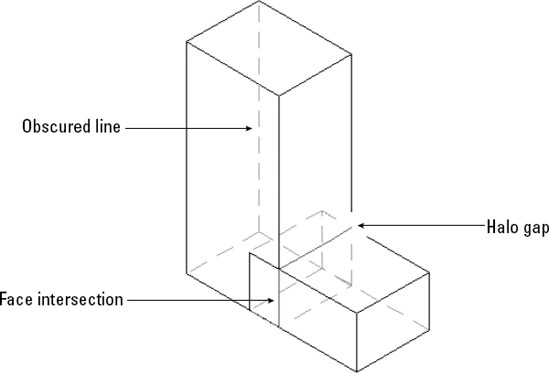
Figure 21.14 shows a model using a halo gap value of 15; a green, dashed line to display hidden lines; and face intersections displayed in red.
Note
The word wireframe is used in two ways. First, it means 3D objects that are created using only lines and 3D polylines. These objects have no surfaces or solidity. Second, it means surfaces and solids that are displayed as if they are created with lines and 3D polylines, such as the models in Figure 21.11. In this book, I usually distinguish between wireframes and wireframe display, or visual style. If the subject is surfaces and solids, the term wireframe generally means wireframe display.
Until now, I've discussed 3D objects based on 2D objects that were on the XY plane. In other words, their Z coordinate was zero. Although you generally don't want objects to float in the air, you certainly may want to place one object on top of another. To do this, you need to start the object above the XY plane (you can also place objects below the XY plane) and give an object elevation, which is its Z coordinate.
To give elevation to an existing object, you can use several methods:
Select the object and display the Properties palette (Ctrl+1). Click the Elevation property, type a new elevation in the text box, and press Enter.
Move the object(s) with the MOVE command in the Z direction.
Use the 3DMOVE command to move the object in the Z direction. I cover this command in Chapter 24, where I discuss editing in 3D.
For new objects, change the current elevation with the ELEV command as described earlier in this chapter in the discussion on thickness.
Note
For some objects, you can use the Properties palette (press Ctrl+1) to change the Z coordinate. This works for circles, lines, arcs, and ellipses but not for polylines. To elevate an entire line, you need to change the Z coordinate of both the start point and the endpoint.
When you change the current elevation, all objects that you create are drawn on that elevation. Remember to change the elevation back to zero when you want to draw on the XY plane again.
Warning
If you specify an object snap of an object on a different elevation than your current elevation (with a different Z coordinate), AutoCAD and AutoCAD LT use the elevation of the object snap, not the current elevation. However, if you specify the first point of a 2D command, such as PLINE (to create a polyline), on the current elevation, you can use object snaps at a different elevation for subsequent points. Because the entire polyline must be on the same elevation, subsequent points follow the elevation of the first point.
STEPS: Working with Elevation, Thickness, and the HIDE Command
Start a new drawing by using the
acad.dwtoracadlt.dwttemplate. The Allow/Disallow Dynamic UCS button on the status bar should be off (if you have AutoCAD). This template uses a 2D environment.Save it as
ab21-03.dwgin yourAutoCAD Biblefolder.Choose Home tab
Choose View tab
Select the circle. Display the Properties palette (Ctrl+1). Click the Thickness property. In the Thickness text box, type 3
Type elev
Start the CIRCLE command again. Specify 6,6 as the center and set the radius to 3.
Zoom out and pan so that you can see the entire model.
Type elev
Start the CIRCLE command. Specify the center as 6,6 and the radius as 18. Because you don't specify a Z coordinate, the current elevation is used. You can verify in the Dynamic Input tooltip that the Z coordinate is 27.
Type hide
Save your drawing. It should look like Figure 21.15.
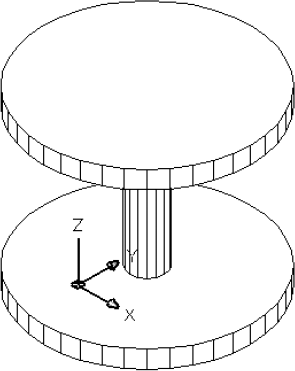
Except for certain true solids, much of 3D work starts with a 2D shape. However, the 2D drawing commands can be drawn only on, or parallel to, the XY plane. For example, the spool in Figure 21.15 consists of three circles, all parallel to the XY plane. How do you draw a circle, or any other 2D object for that matter, that is not parallel to the XY plane?
The answer is to change the User Coordinate System (UCS), thereby changing the definition of the XY plane. You can move the UCS to any location to define the XY plane in any way that you want. After you do so, you can draw a 2D object at any angle. This section offers a brief review of UCS features that are particularly useful for 3D drawing. (See Chapter 8 for complete coverage of the UCS feature.) Remember that you can save and name any UCS that you create by using the Named option of the UCS command.
Note
You can customize the look of the UCS icon. The 3D style is helpful when you're working in 3D. See Chapter 8 for details on customizing the UCS icon display.
A plan view of the World UCS (the default) is different from the plan view of a UCS that you've created by rotating the UCS around the X axis, for example. The UCS defines the orientation and origin of the X, Y, and Z axes. On the other hand, the viewpoint shows your drawing from different angles without changing the orientation or origin of the axes. Understanding the difference between the UCS and viewpoints is important. The next chapter is all about viewpoints.
The UCS is important because it enables you to draw and edit at unusual angles. However, after you have a suitable UCS, you need to look at the drawing from the best viewpoint, one that displays the objects clearly with as little overlapping as possible.
If you want to change your UCS when you change your viewpoint, you can use the UCSORTHO system variable. When this variable is on and you switch to an orthographic viewpoint (top, bottom, left, right, front, or back), the UCS changes to match the viewpoint.
When the UCSFOLLOW system variable is on (set to 1), it switches you to plan view whenever you change the UCS. This means that whenever you change the UCS, you start by looking at your model from the top. You can then change the viewpoint to anything that you want.
Note
In 3D work, you usually use a 3D UCS icon display. However, if you use the 2D display, and choose a viewpoint that looks straight across the XY plane, you see a broken pencil icon, indicating that you're looking at the XY plane edge on.AutoCAD only.
Express Tools has a command, RTUCS, that enables you to rotate the UCS icon by dragging with the mouse. You can set an incremental angle for rotation and specify an active axis around which you rotate the UCS. Enter rtucs
To change the UCS, choose View tab
Table 21.1. UCS Orientation with the Object Option
Line | The endpoint nearest your pick point is the origin. The line lies on the X axis. |
2D Polyline | The endpoint of the polyline nearest your pick point is the origin. The first segment of the polyline lies on the X axis. |
Dimension | Places the origin at the midpoint of the dimension text. The X axis is parallel to the X axis that you used when you created the dimension. |
Text | Places the origin at the insertion point and aligns the X axis with the rotation angle of the text. The same applies to attributes. |
Block | Places the origin at the insertion point and aligns the X axis with the rotation angle of the block. |
Circle | The origin is at the circle's center. The X axis is aligned with your pick point. |
Arc | The origin is at the arc's center. The X axis is aligned with the endpoint closest to your pick point. |
Point | The origin is at the point. The X axis may be difficult to determine in advance. |
Solid | Uses the first point that you specified for the origin and the first and second points to align the X axis. AutoCAD LT doesn't offer solids, but you can open AutoCAD drawings containing solids. |
3Dface | Uses the first point for the origin. The X axis is aligned with the first two points. The Y axis is aligned with the first and fourth points. The new UCS may not be parallel to the prior UCS. AutoCAD LT doesn't offer 3Dfaces, but you can open AutoCAD drawings containing 3Dfaces. |
Creating a new UCS is great if you need to work in it for a while and if you want to save it for future use. However, sometimes you just want to draw one object on a certain plane of an existing solid object. For these times, you can use the dynamic UCS feature, which creates a UCS on the fly so that you can draw on any face of an object. You can also use the dynamic UCS feature to help you specify a regular UCS.
Note
AutoCAD LT does not have the dynamic UCS feature.
The dynamic UCS feature works only on solids (covered in Chapter 24). You turn this feature on and off by clicking the Allow/Disallow Dynamic UCS button on the status bar (or pressing F6). You can temporarily override the Dynamic UCS feature by pressing Shift+Z.
To create a temporary UCS, follow these steps:
Start a command. Some commands that work with the dynamic UCS feature are:
Commands that draw 2D geometry, text, a table, 3D solids, or a polysolid
The INSERT and XREF commands for inserting blocks or xrefs
Editing commands, such as the ROTATE, MIRROR, and ALIGN commands, and grip-editing
The UCS command
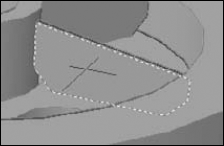
Pass the cursor over a face of a solid. A dashed border appears on the solid's face, as shown in Figure 21.16.
Continue the command. For example, if you're drawing a circle, specify the center point. The UCS icon appears near the cursor in its new direction so that you can see where the XY plane is. The temporary X axis is aligned with the edge of the face and always points to the right of your screen.
Note
If the grid is on, it flips to match the XY plane. This can be distracting, so you may want to turn it off.
Finish the command. The UCS automatically returns to its previous setting.
Note
The drawing used in the following exercise on creating UCSs, ab21-c.dwg, is in the Drawings folder on the DVD.
STEPS: Creating UCSs
Open
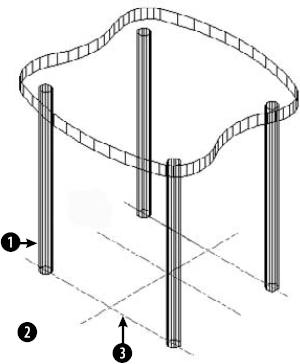
ab21-c.dwgfrom the DVD.Save it as
ab21-04.dwgin yourAutoCAD Biblefolder. This drawing contains some centerlines based on measurements of a chair. Object Snap should be on. Set running object snaps for Endpoint, Midpoint, Center, and Quadrant. The UCS icon is set at the origin. This drawing starts in a 2D environment.Choose Home tab
Display the Properties palette (Ctrl+1) and select the circle that you just drew. Change the thickness to 16. Press Enter. Close the Properties palette (or right-click its title bar and choose Auto-Hide).
Click Ortho Mode on the status bar to turn it on. Choose Home tab
Repeat the MIRROR command. Select the two circles. Pick the midpoint of the line at
Type elev
Choose View tab
Choose Home tab
Choose Home tab
To see the result, type hide
Choose Home tab


Tip
Although it's not necessary for this exercise, this would be a good UCS to save (choose View tab
With no objects selected, display the Properties palette (Ctrl+1). Set the thickness to 16. Close the Properties palette.
Start the CIRCLE command. Choose the center of the lower circle of the top-left leg (it's below the chair's seat) for the center. Accept the default radius of 0.5. Use the same technique to draw a circle at the corresponding right circle.
Choose View tab
Change the thickness to −5. Type hide
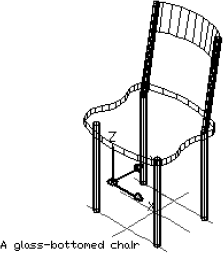
Start the ARC command. The start point should be at the left quadrant of the left circle that you just drew. The second point is the intersection of the vertical centerline and the top horizontal centerline. (There is an Endpoint object snap there.) The endpoint is the right quadrant of the right circle.

Save your drawing. The chair should look like Figure 21.19.

This chapter introduced you to 3D drawing. You read about:
Understanding all the types of 3D coordinates and how to use them
Using editing commands in 3D
Using point filters, object snaps, and grips in 3D drawings
Utilizing elevation and thickness
Understanding the HIDE command and the system variables that affect the hidden display
Working with User Coordinate Systems in 3D
In the next chapter, I explain all the ways to view 3D drawings.