Often, the first step after you start a new drawing is to set its size and unit type. These and other setup options are discussed in this chapter. The entire process of setting up a drawing is essential for ensuring accurate results. You can save most of these settings in a template to avoid having to re-create them each time you start a new drawing.
One of the first tasks in setting up a drawing is to choose the unit type. Units define how objects are measured. You can save the unit type in a template.
Note
When you start AutoCAD or AutoCAD LT for the first time, the Initial Setup dialog box appears and prompts you to select your industry and a template. This can affect your units. For example, if you choose the Architecture option on Page 1 and a template suitable for your industry on the last page, whenever you start a new drawing, your units will be architectural. You can change these settings at any time by choosing Application Button
The coordinates you use in AutoCAD or AutoCAD LT are measured in units that can represent any real-world measurement, such as inches or millimeters. A surveyor or city planner might even use miles or kilometers as the base unit. However, different disciplines have customs that express units differently, and you should use the unit type appropriate for the type of drawing you're creating. This ensures that everyone involved understands the drawing. AutoCAD and AutoCAD LT offer five types of units, as shown in Table 5.1. The sample measurement column shows how a line 32.5 units long would be displayed in the various unit types.
Table 5.1. Unit Types
Sample Measurement | Description | |
|---|---|---|
Decimal | 32.50 | Number of units, partial units in decimals |
Engineering | 2′–8.50″ | Feet and inches, partial inches in decimals |
Architectural | 2′–8 1/2″ | Feet and inches, partial inches in fractions |
Fractional | 32 1/2 | Number of units, partial units in fractions |
Scientific | 3.25E+01 | Base number + exponent |
Notice how the engineering and architectural units translate a line of 32.5 units into feet and inches. Engineering and architectural units assume a unit of 1 inch, unlike the other unit types, which can represent any measurement.
The unit type affects how coordinates are shown on the status bar and how information about objects is listed. You generally input coordinates by using the type of units you've chosen, although in some cases you can input coordinates in another unit type.
Note
If you're using engineering or architectural units, AutoCAD and AutoCAD LT display partial inches differently than the format you must use to type them in. You must type coordinates without any spaces, because a space is equivalent to pressing Enter, and that ends your input. Use a hyphen between whole and partial inches, for example, 3′2-1/2″. (You can omit the ″ after the inches because inches are assumed in engineering and architectural units if no symbol follows a number.) However, this appears on the status line as 3′-2 1/2″. This can be confusing because the hyphen is in a different place, and you see a space between the whole and partial inches.
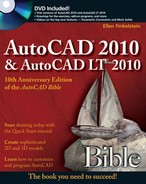
When you know the units you want to use, you set them in the Drawing Units dialog box. To set the units, choose Application Button
Warning
AutoCAD and AutoCAD LT round off measurements to the nearest precision value you choose. Say that you choose a precision of two decimal places, using decimal units. You want to draw a line so that it is 3.25 units long, but when you type the coordinate, by accident you press the 4 key at the end, resulting in a line 3.254 units long. This line is displayed as 3.25 units long, making it difficult for you to spot the error. Therefore, setting a higher precision than you need to show is a good idea.
As with units, your choice of angle type depends on your profession and work environment. Decimal Degrees is the default. Table 5.2 lists the types of angles.
Table 5.2. Angle Types
Angle Type Name | Sample Measurement | Description |
|---|---|---|
Decimal Degrees | 32.5 | Degrees, partial degrees in decimals |
Deg/Min/Sec | 32°30′0″ | Degrees, minutes, and seconds |
Grads (gradians) | 36.1111g | Gradians |
Radians | 0.5672r | Radians |
Surveyor | N 57d30′ E | Surveyor (directional) units |
Note
A minute is
To set the angle type, choose the option you want from the Type drop-down list of the Angle section of the Drawing Units dialog box (shown in Figure 5.1).
Note
Changing these angle settings does not automatically change the way your dimension annotations appear. Use the Dimension Style Manager, which is discussed in Chapter 15, to change dimensions.
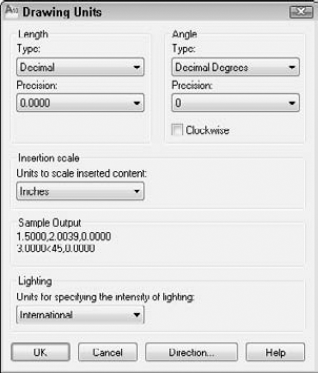
By convention, degrees increase in a counterclockwise direction, and you measure angles so that 0 degrees starts to the right, also called the East direction. To change the angle direction, click Clockwise in the Drawing Units dialog box. To change the direction of 0 degrees, click Direction to open the Direction Control dialog box, as shown in Figure 5.2.
Here you can choose to have 0 degrees start in a direction other than East. You can also choose Other and type any other angle or click the Pick an Angle button to pick two points on your screen that specify an angle. Click OK to close the Direction Control dialog box. Click OK to close the Drawing Units dialog box.
Note
Changing the angle direction affects what happens when you input angles and what you see in the coordinate display. It does not change the absolute coordinates, which are set according to the User Coordinate System (UCS). Chapter 8 covers using and customizing UCSs.
If you are using Dynamic Input, the angle that you see in the Dynamic Input tooltip never goes above 180°. This angle in the tooltip represents the angle to your current point and goes from 0° to 180° in both the clockwise and counterclockwise directions.
Note
At the bottom of the Drawing Units dialog box, you can choose units for lighting. See my discussion of lighting in Chapter 25 for more information.
STEPS: Setting Drawing Units
Begin a new drawing by using the
acad.dwtoracadlt.dwttemplate. Close any palettes that may be open. If Dynamic Input isn't on, click the Dynamic Input button on the status bar. This exercise assumes that you have input of coordinates set to relative coordinates, the default setting. (For more information, see Chapter 4.)Save the drawing as
ab05-01.dwgin yourAutoCAD Biblefolder.Choose Application Button

In the Length section, choose Architectural.
Click the arrow to the right of the Precision drop-down list in the Length section. Choose 0′-0 1/8″.
In the Angle section, choose Deg/Min/Sec.
In the Precision box, choose 0d00′.
In the Units to Scale Inserted Content drop-down list, set the units to Inches.
Click OK.
Choose Home tab
Specify first point:
2,2Specify next point or [Undo]:
1′<0Specify next point or [Undo]:6-3/4<153Specify next point or [Close/Undo]:Right-click and choose Close.Choose View tab
Note
You would not actually use Deg/Min/Sec for angles in an architectural drawing, but the exercise gives you the opportunity to set the angular units.
You can specify the area of your drawing, also called the limits. The drawing limits are the outer edges of the drawing, specified in X,Y units. You need to set only the width and length of the drawing. Together, these two measurements create an invisible bounding rectangle for your drawing.
Almost universally, the lower-left limit is 0,0, which is the default. Therefore, the upper-right corner really defines the drawing size. Remember that you typically draw at life size (full scale). Therefore, the size of your drawing should be equal to the size of the outer extents of what you're drawing, plus a margin for a titleblock (if you plan to add one), annotation, and dimensioning. If you want to show more than one view of an object, as is common in both architectural and mechanical drawings, you need to take this into account.
To decide on the upper-right corner limits (the width and length) for your drawing, you need to consider what the drawing units mean for you. Generally, the smallest commonly used unit is used, often inches or millimeters. Therefore, if you're drawing a plan view of a house that is approximately 40 feet across (in the X direction) by 30 feet deep (in the Y direction), this translates to a top-right corner of 480,360. Adding room for a titleblock brings you to about 500,380.
Note
In Chapter 17, I explain how you can put the titleblock on a layout. A layout simulates the sheet of paper that you will use to plot the drawing. If you use a layout, you don't need to leave room for the titleblock when you set the limits.
The limits define an artificial and invisible boundary to your drawing. However, you can draw outside the limits. The limits affect the size of the grid, when displayed. (See Chapter 4 for a discussion of the grid.) The ZOOM command with the All option also uses the limits, but only if no objects are outside the limits. (See Chapter 8 for a discussion of the ZOOM command.)
To set the drawing limits, type limits
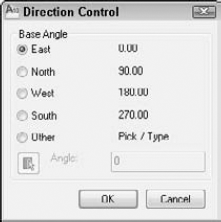
You need to consider the fact that your drawing will most likely be plotted onto a standard paper (sheet) size. The standard orientation for drafting (and the default for most plotters) is landscape orientation, meaning that as you look at the drawing, the paper is wider than it is tall. Figure 5.3 shows an example. To scale a drawing onto a piece of paper in a pleasing manner requires a rectangular shape that somewhat resembles the proportions of standard paper sizes.
In addition, although you specify the scale at plotting time, it helps to be aware at the outset of the scale you'll use when plotting your drawing. One important reason for establishing the scale at the beginning is to ensure that text, whether annotations or dimensions, is readable in its final plotted form. Applying a scale ensures that text remains a reasonable size even as the rest of the drawing is scaled up or down. Scale also affects linetypes that contain dots or dashes.
Some drawings are not scaled. Examples are electrical or electronic schematics, piping diagrams, and railroad schematics. These drawings are representations of electrical or electronic connections but do not resemble the actual physical object that will eventually be created from the drawing. These drawings can be any size as long as they are clear and organized.
Note
You can lay out various views of your drawing on an imaginary piece of paper, a paper space layout, to prepare it for plotting. You can annotate on the layout to avoid having to scale these components. See Chapter 17 for more information on layouts and plotting.
When determining your scale to fit a drawing on a sheet of paper, be aware that a plotter cannot print on the entire sheet. A certain amount of the margin around the edge is not available for drawing. The plotter's manual can let you know the width of this unprintable margin. On average, you can assume a half-inch margin on each side; thus you should subtract 1 inch from both the length and width sheet measurements to determine the actual drawing space. Table 5.3 shows standard U.S. sheet sizes.
Table 5.3. Standard Paper Sheet Sizes in the United States (in inches)
Size | Width | Height |
|---|---|---|
A | 11 | 8½ |
B | 17 | 11 |
C | 22 | 17 |
D | 34 | 22 |
E | 44 | 34 |
Table 5.4 lists standard metric sheet sizes.
Table 5.4. Standard Metric Paper Sheet Sizes (in millimeters)
Size | Width | Height |
|---|---|---|
A4 | 297 | 210 |
A3 | 420 | 297 |
A2 | 594 | 420 |
A1 | 841 | 594 |
A0 | 1,189 | 841 |
A scale is often indicated in the format plotted size=actual size or plotted size:actual size. Because you draw at actual size, the actual size is also the drawing size. For example, a scale of ¼″=1′ means that ¼ inch on the drawing, when plotted out on a sheet of paper, represents 1 foot in actual life — and in the drawing. This is a typical architectural scale. A windowpane 1 foot wide would appear ¼-inch wide on paper.
From the scale, you can calculate the scale factor. You use the factor when you set the size for text (see Chapter 13) or for dimensions (see Chapter 15). To do this, the left side of the scale equation must equal 1, and the two numbers must be in the same measurement (for example, both in inches). This requires some simple math. For ¼″=1′, you would calculate as follows:
¼″=1′ | |
1″=4′ | Both sides of the equation multiplied by 4 |
1″=48″ | 4′ converted to 48″ |
Therefore, the scale factor is 48. This means that the paper plot is
In mechanical drawing, you might draw a metal joint that is actually 4 inches long. To fit it on an 8½-x-11-inch sheet of paper, you could use a 2″=1″ scale, which means that 2″ on the paper drawing equals 1″ in actual life and the drawing. Calculate the scale factor:
2″=1″
1″=½″
The scale factor is ½. This means that the paper plot is twice the real size.
Most professions use certain standard scales. Therefore, you do not usually have a choice to pick any scale you want, such as 1″:27′. Instead, the conventions of your profession, client, or office dictate a choice of only a few scales. Some typical architectural scale factors are:
192: 1/16″ = 1′
96: 1/8″ = 1′
48: 1/4″ = 1′
24: 1/2″ = 1′
12: 1″ = 1′
Civil engineering scales are somewhat different and range to larger sizes — a bridge is bigger than a house. Some typical scale factors are 120 (1″ =10′) and 240 (1″ =20′).
Metric scales can be used for any purpose. Example scale factors are 10000 (1mm = 10 meters), 5000 (1mm = 5 meters), 1000 (1 mm = 1 meter), or 100 (1cm = 1 meter).
You can assign an annotative property to certain objects so that they automatically resize to the proper scale when you lay out the drawing for plotting. The following types of objects can be annotative:
Text (see Chapter 13)
Dimensions and leaders (see Chapters 14 and 15)
Hatches (see Chapter 16)
Blocks and attributes (see Chapter 18)
You would especially use annotative scaling when you need to display your drawing at more than one scale. For example, you might display the entire drawing at one scale and a detail at another scale. (See Chapters 13, 14, 15, 16, 17, and 18 for more detailed information on annotative styles and objects.)
Using annotative objects avoids the necessity to manually figure out how large these objects need to be; when you scale them, they will be the proper size. For example, if your drawing scale will be 1:48, and you want your text to be ¼″ high, then you would need to multiply the desired height of the text (¼″) by the scale factor to get a text height of 12. However, by setting the annotative scale for the text to 1/4″ = 1′-0″, you can simply set the height of the text to ¼″ and not worry about the calculations.
The procedure for creating annotative objects differs somewhat for each type of object, but the overall process is the same:
If necessary, create an annotative style and make it current. Annotative text, dimensions, and multileaders require an annotative style.
Decide on the scales that you will use for each object. For example, you might have two text objects each at a different scale, or one text object that you need to display at two different scales.


Create the object.
When you're ready to plot, you can set the desired annotative scale, and plot. You can also create viewports and set their scale. See Chapter 17 for details and an exercise using annotative objects.
If you want one object to have more than one scale, you can add an annotative scale to it. Follow these steps:
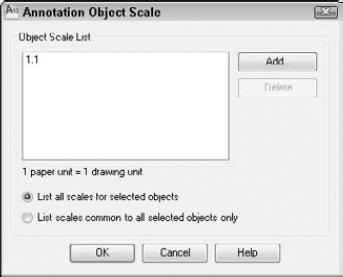
You can also open the dialog box by displaying the Properties palette, clicking the Annotative Scale item, and clicking the Ellipsis button that appears.
You generally choose a scale during the process of laying out a drawing. AutoCAD and AutoCAD LT have a list of scales from which you can choose. You can find this list in several places (which I discuss throughout the book):
On the Annotation Scale list on the status bar, as mentioned earlier
In the Add Scales to Object dialog box, also mentioned earlier
In the VP Scale list of the status bar, when you select a viewport (see Chapter 17)
In the Plot Scale drop-down list section of the Page Setup dialog box (see Chapter 17)
In the Plot Scale section of the Page Setup dialog box (see Chapter 17)
In the Standard scale item of the Properties palette when a viewport is selected (see Chapter 17)
In the Sheet Set Manager (AutoCAD only), when placing a view on a layout (see Chapter 26)
You might use unusual scales in your office or want a list that includes only the scales that you use. You can customize the scale list for this purpose.
To customize the scale list, choose Annotate tab
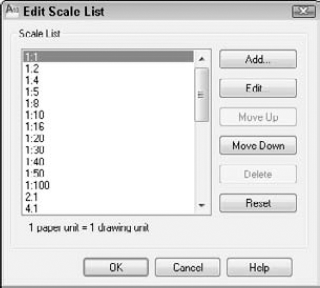
To add a new scale, click Add. In the Add Scale dialog box, name the scale. The name is what will show on the list. Then define the scale by completing the Paper Units and Drawing Units text boxes. For example, to add a 1:12 scale, you would name the scale 1:12, set the Paper Units to 1 and the Drawing Units to 12.
To delete scales that you don't use, select the scale and click Delete. You can also edit existing scales (select the scale and click Edit), move them up or down in the order of the list, and reset the list (click Reset) to its original status. Click OK when you're done.
As soon as you know the size of your drawing and the scale appropriate for your situation, you need to consider the sheet size of the paper on which you want to plot. Again, you often find that certain factors limit your choices. Your plotter or printer may be limited to certain sheet sizes. The conventions used in your discipline or working environment also affect your decision. You may be working on a series of drawings that are all to be plotted on the same size sheet of paper.
As an example, the architectural drawing in Figure 5.3 is 175 feet wide by 120 feet high. The two most typical scales for a drawing of a house are ¼″=1′ and ⅛″=1′. On a small plotter, you might have a choice of sheet sizes A, B, or C. The following steps show the calculations you need to do in order to decide on a scale, obtain the scale factor, and determine the appropriate sheet size.
In this exercise, you practice determining the scale and sheet size. You need only a sheet of paper and a pencil. Use Figure 5.3 as a reference.
STEPS: Determining the Scale and Sheet Size
To calculate the plotted size of the drawing at ¼″=1′, you can start with the width, which is 175′. Take one-quarter of 175 to get the width of the drawing in inches, which is 43¾″.
Take one quarter of the height, 120′, to get the height of the drawing in inches, which is 30″.
A C-size sheet (see Table 5-3) is 22″×17″, which is too small for a 43¾″×30″ drawing.
Recalculate the drawing at ⅛″=1′. Take one-eighth of 175 to get 21⅞. Take one-eighth of 120 to get 15″.
The actual drawing space (minus the margins the printer requires) on a C-size sheet is about 21″×16″. The height of the drawing at this scale is adequate, but the width is ⅞″ too long. Therefore, the best option is to simply make the drawing ⅞″ narrower because the drawing has some extra room. This lets you fit the drawing on a C-size sheet.
To calculate the scale factor of a ⅛″=1′ scale, multiply 1′ by 8 to get 8′ and convert it to inches, which is 96 (8×12).
Rearranging the views, dimensions, and text on a drawing to fit a standard scale factor and sheet size is a typical task. There is no actual setup step for setting the drawing scale, but you use it when you insert text or dimensions and when you plot the drawing.
A titleblock is a rectangle that includes spaces for the drawing title, company name, drafter name, and so on. It generally comes with a border that bounds your drawing. Many drawings require titleblocks. You can insert an existing titleblock in two ways:
When creating a new drawing, choose Application Button
After you open a drawing, you can insert a drawing of a titleblock into it. Choose Home tab
To find the location of the templates, choose Application Button
Note
As explained in Chapter 2, you can create your own titleblock, make a template from it, and then start a drawing based on that template.
A few other items are generally set up in advance and are included in a template. Other chapters of this book cover the following:
Layers (covered in Chapter 11) enable you to organize your drawing into meaningful groups. In an architectural drawing, for example, you might create layers for walls, doors, and electrical fixtures.
Text styles (covered in Chapter 13) enable you to format the font and other text characteristics.
Table styles (covered in Chapter 13) format tables.
Multileader styles (covered in Chapter 14) create styles for multileaders.
Dimension styles (covered in Chapter 15) format the dimensions that measure your objects.
If you know that you'll be using snap, grid, and ortho modes (covered in Chapter 4) a lot in certain drawings, and you know the suitable settings for snap and grid, you can set these and save them in a template because these settings are saved with the drawing. In other cases, you might want to leave them off and turn them on only when you need them.
Many settings, such as running object snaps, the type of snap (grid or polar), and the polar distance, are saved in the Windows registry, not in your drawing. As a result, when you open AutoCAD or AutoCAD LT, they're automatically set to the same setting that you had when you last closed the program, regardless of the setting in the drawing. Therefore, you cannot save these settings in a template.
Note
The drawing used in the following exercise on setting drawing aids and creating a template, ab05-01.dwg, is in the Results folder on the DVD.
STEPS: Setting Drawing Aids and Creating a Template
If you did the exercise on setting drawing units, use that drawing or open
ab05-01.dwgfrom theResultsfolder of the DVD.Save the drawing as
ab05-02.dwgin yourAutoCAD Biblefolder.Right-click the Snap Mode button on the status bar, and choose Settings.
System variables
When you change AutoCAD or AutoCAD LT settings, such as the unit type, angle type, drawing limits, blip marks, snap mode (on or off), grid mode, or ortho mode, you actually changing system variables. These are settings that are stored in each drawing or in the Windows registry (which stores settings that apply to all drawings). Usually, you don't need to pay any direct attention to them, but they're the nuts and bolts behind the dialog boxes that you use to change the settings. When you start customizing AutoCAD, you need to learn about them because programming code and script files (macros) cannot access dialog boxes. Also, a few system variables are accessible only by typing them on the command line. Some system variables store information about a drawing or its environment, such as the drawing name and path. These are read-only, meaning that you cannot change them. They are often used in AutoLISP programs (AutoCAD only).
Information about each system variable, where it is stored, its default, and whether it is read-only is in the Help system. Press F1 (with no command active) and double-click Command Reference on the Contents tab. Then double-click System Variables. In the Options dialog box (Application Button
On the Snap and Grid tab, the snap spacing is set to ½″. In the Grid Spacing section, change the X and Y spacing to 1″. Make sure that the Snap Type is set to Grid Snap and Rectangular Snap. Click OK.
Click Snap Mode and Grid Display on the status bar to turn them on. Make sure that Object Snap Mode is turned off.
Choose Application Button
Using the coordinate display as your guide, start the LINE command and draw line segments from 2.5, 1.5 to .5<270 to 11<0 to .5<90. End the LINE command.
Restart the LINE command. Again use the coordinate display to draw line segments from 2.2 to .5<270 to 12<0 to .5<90. End the LINE command.
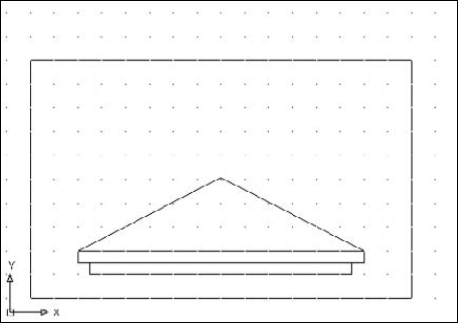
Save your drawing. It should look like Figure 5.6. Notice how the grid and snap settings facilitate the drawing process.
The architectural units create a different drawing experience than decimal units would. Setting up a drawing creates a drawing environment suited to your work needs.
Choose Application Button
In the File Name text box, change the name to
archroof.dwt. Click Save.In the Template Options dialog box, type Arch units, 16,10 limits, snap & grid and click OK. The Measurement drop-down list should be set to English.
Choose Application Button
Move the cursor around and look at the coordinate display to confirm that the grid is set to 1″, although the snap is set to ½″.
Do not save this new drawing.
The MVSETUP command is used in two different ways: to set up a drawing and to create viewports for paper space layouts (covered in Chapter 17). This command does not exist in AutoCAD LT.
MVSETUP provides a command-line routine to walk you through some of the basic setup functions discussed in this chapter. You can use MVSETUP when you start to customize AutoCAD to set up a drawing from a script file or AutoLISP program (topics covered in Parts VI and VII of this book). To use MVSETUP, type mvsetup
Enable paper space? [No/Yes] <Y>:
Type n
The next prompt lets you enter the units type:
Enter units type [Scientific/Decimal/Engineering/Architectural/Metric]:
Choose the option you want. Then AutoCAD displays a list of scale factors appropriate to the units option you chose. (To see them all, you may have to press F2 to open the AutoCAD Text Window.) At the Enter the scale factor: prompt, type in a numeric scale factor.
Finally, AutoCAD prompts you to set the drawing limits with the following two prompts:
Enter the paper width:
Enter the paper height:
After each prompt, enter a number based on the size of the paper on which you plan to plot. AutoCAD draws a rectangle of the size that you indicated for the drawing limits.
Note
There are two wizards to help you set up a drawing. You need to activate the Startup dialog box to find them. To do so, enter startup
This chapter explained setting up a drawing so that it behaves the way you want it to. You read about:
Setting the unit type
Setting the angle type, measurement, and direction
Drawing limits
Using scales and calculating a scale factor
Setting drawing aids and creating a template that includes the settings that you want
Using MVSETUP (AutoCAD only) or the setup wizards to set up your drawing
This chapter ends Part I, "AutoCAD and AutoCAD LT Basics." Now that you know the basics, you can go on to Part II, "Drawing in Two Dimensions." The next chapter covers drawing simple lines, polygons, rectangles, and infinite construction lines.