If you look at the Capabilities tab in your project settings, there is a CloudKit Dashboard button underneath your iCloud capability configuration. Click this button or navigate to https://icloud.developer.apple.com/dashboard/ in your web browser to go to the CloudKit dashboard. After logging into the dashboard, you'll see your developer teams and the containers that you have set up for each team.
A CloudKit container uses a unique identifier that is based on your app's bundle identifier. To explore your CloudKit container, click it. You should see a screen that resembles the following screenshot:
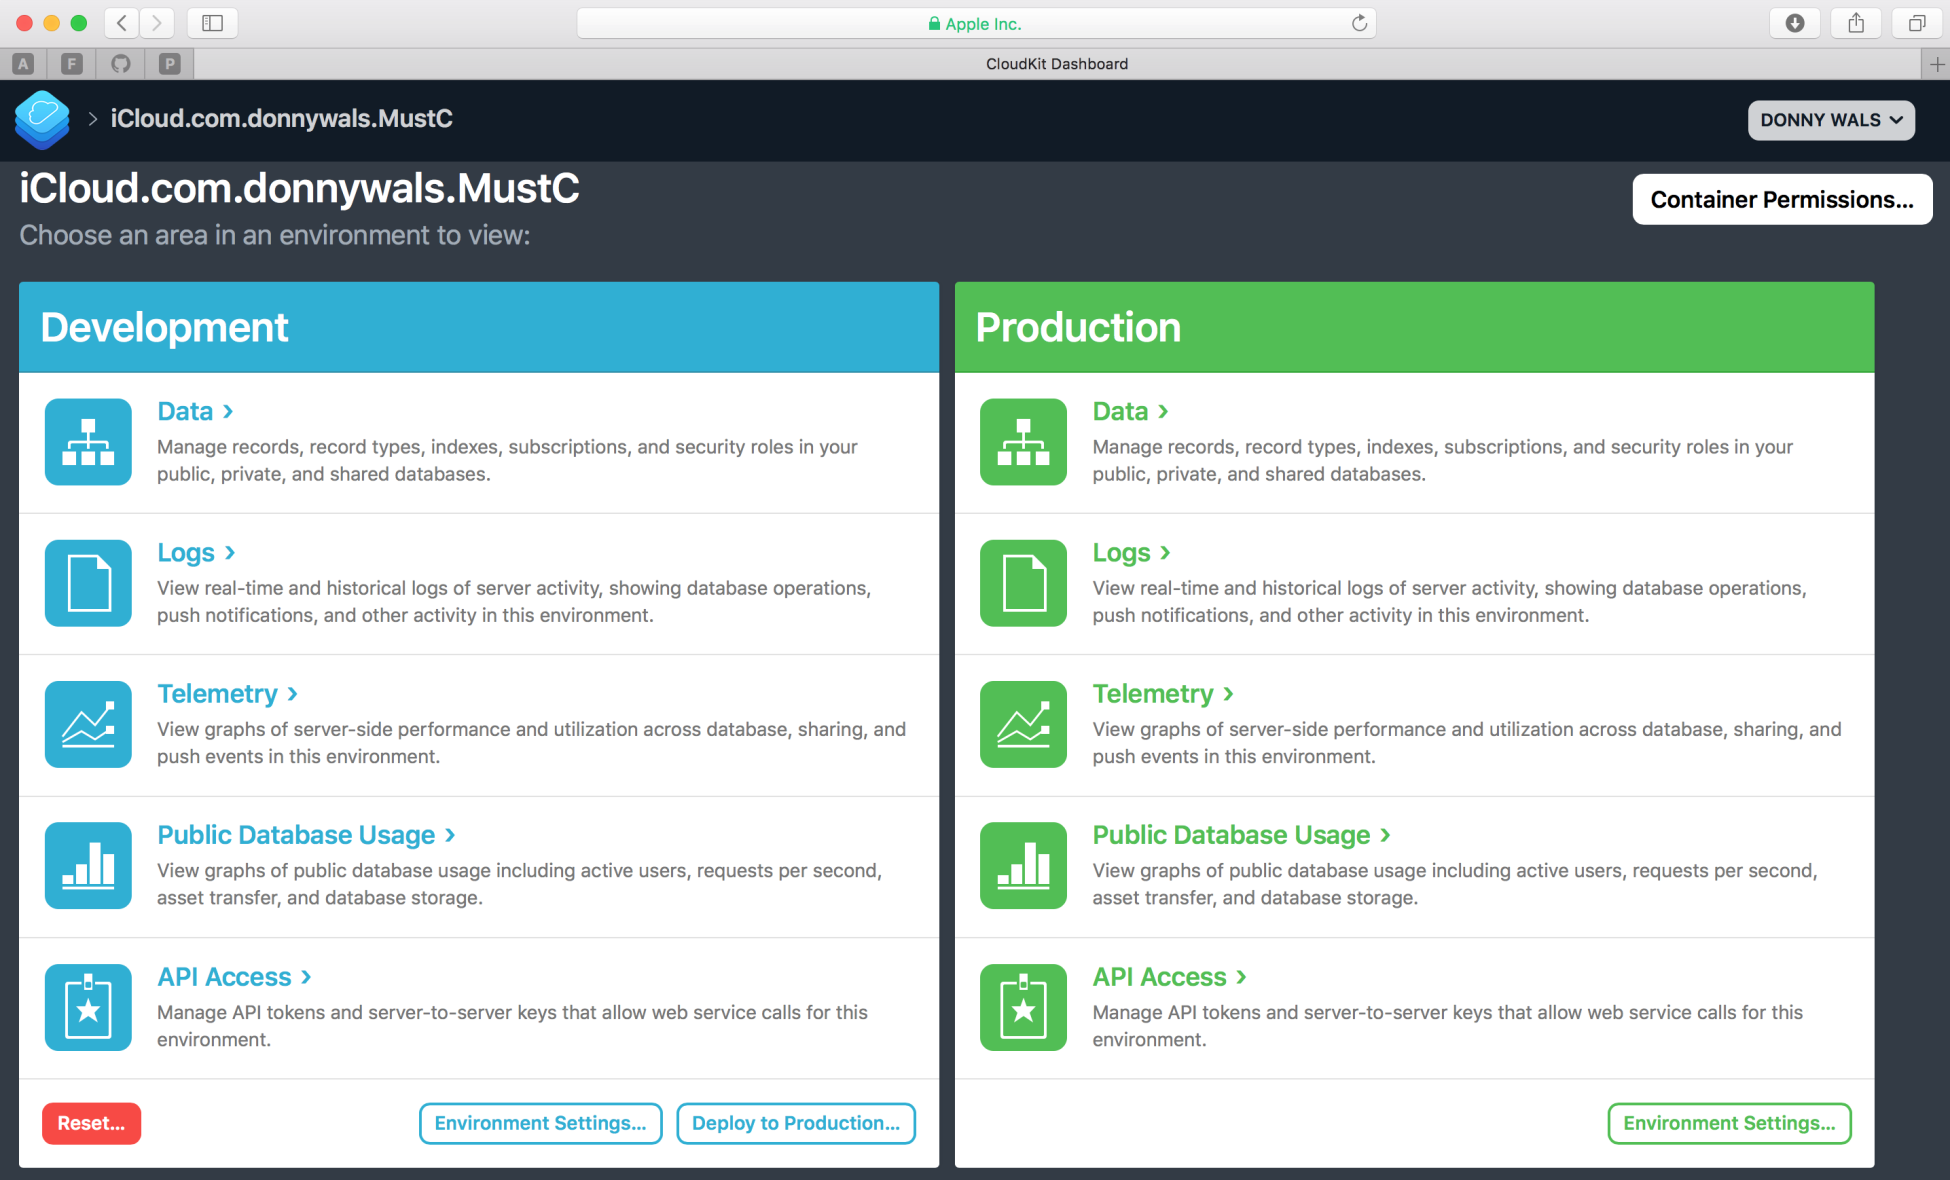
This screen is the starting point for your container. Every container has a development environment and a production environment. This is convenient because it allows you to experiment as much as you'd like in your development database without disrupting the production database where your user's data will live.
From this screen, you can monitor what your container is doing, how much it's used, and you can even access logs that help you with debugging issues if you encounter them. For now, go to the Data section so you can explore your CloudKit container's data store.