
Whenever you find that your app is slow or choppy, there's a good chance that something in your code is taking longer than it should, especially if your memory usage appears to be within reasonable range. For instance, if your app uses less than 50 MB, memory is not likely to be an issue for your app, so seeking the problem in your code's performance makes a lot of sense.
To discover where your code is lacking in the performance department, it's a great idea to profile your app in Instruments, by either selecting Product | Profile in Xcode's toolbar or by pressing Cmd + I. To figure out what the code is doing, you need to select the Time Profiler template when Instruments asks you which template you want to use. This template measures how long certain blocks of code take to run.
To record a profiling session of our app, make sure that a device is connected to your Mac and make sure that it's selected as the device that your app will run on by selecting your iOS device from the list of devices and simulators in the scheme toolbar menu in Xcode. Once you've selected your device, start profiling the app. When Instruments launches, pick the Time Profiler template and hit record. Now use the app to navigate to a collection and begin scrolling until the app starts acting choppy and scroll some more. After seeing the app stutter a couple of times, there should be enough data to begin filtering out what's going on. Press the stop button to stop the recording session.
If you take a look at the data Instruments has recorded, you'll notice a graph that has a bunch of peaks. This part of the timeline is marked CPU, and if you hit Cmd + a couple of times to zoom in on this timeline, you'll notice that these spikes seem to last longer and longer as the scrolling becomes choppier and choppier. This is a great clue to investigate a bit more. Something must be going on that makes these peaks last longer every time they occur.
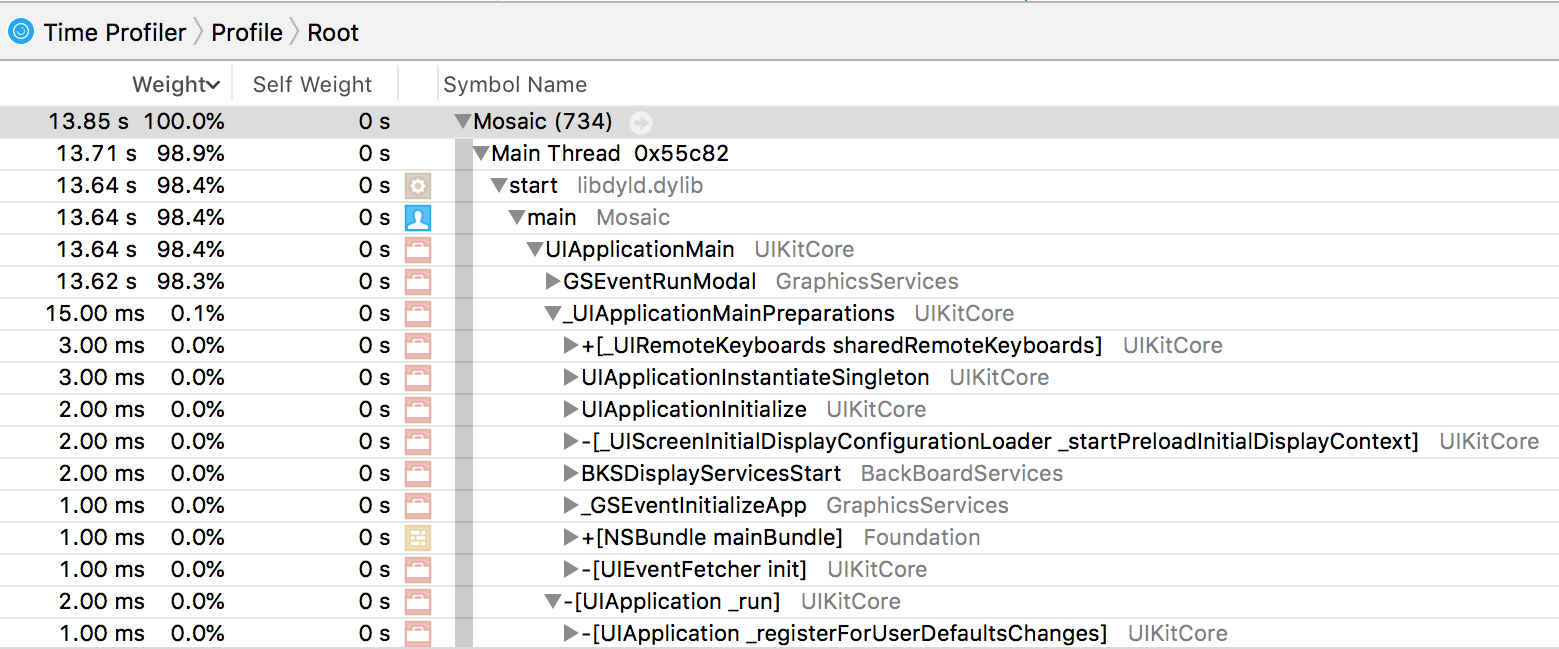
In the bottom section of the Instruments window, you'll find an overview of the code in the app that was executed while the recording session was active. The code is separated by thread and since you saw the user interface lagging, you can be pretty sure that something on the main thread is slow. If you drill down into the list of method calls by a couple of levels, you won't find much useful information. It doesn't even look like most of the executed code is part of the app's code, as you can see in the following screenshot:
To make sure the code you're interested in is pulled to the surface, you should apply a couple of filtering options. If you click on the Call Tree button in the bottom of the window, you can select Invert Call Tree and Hide System Libraries:

The Invert Call Tree option inverts the tree of method calls. The default tree starts at main and works its way down to the method calls in your app code. When you invert this tree, your app code will be at the top and works its way down to main. By checking Hide System Libraries, you make sure that all code shown in the detail view belongs to your app. The call tree is a lot more readable after applying this filter:
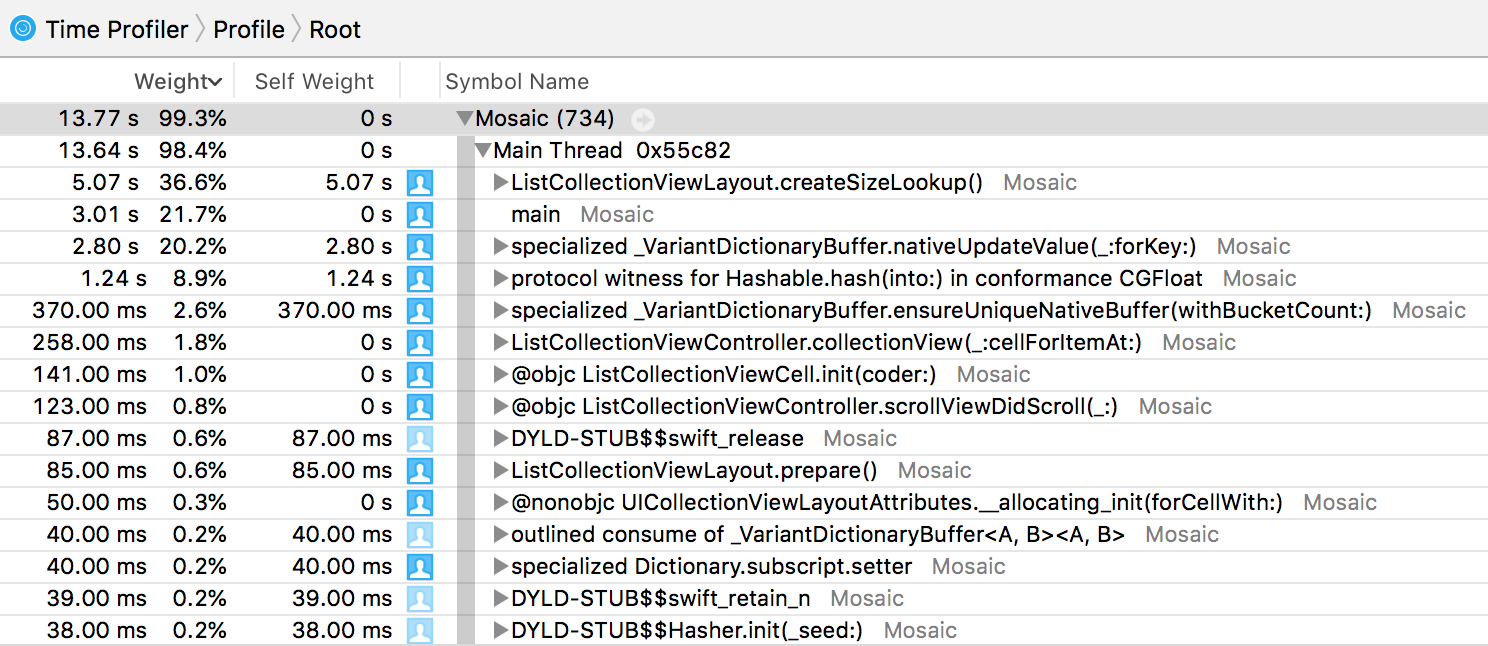
When you examine the call tree, it's immediately clear that the issue is in the collection view layout. On the left side of the detail area, the percentage of time spent in a certain method is outlined, and you can see that a considerable portion of time is spent in ListCollectionViewLayout.createSizeLookup(). This method appears to be much slower than it should be.
It's probably tempting to immediately point at the createSizeLookup() method and call it slow. It would be hard to blame you if you did, that method is a pretty rough one because it's computing an entire layout. However, the layout should be computed pretty efficiently. Unfortunately, you can't prove this with the data in Instruments. If you could see the time that each method call takes, you would be able to verify the claim that createSizeLookup() is not slow.
What can be proved, though, is that createSizeLookup() is called way more often than it should be. If you add a print statement at the start of this method, you'll see that there are hundreds of prints as you scroll through the list. If you dig deeper and figure out when createSizeLookup() is called exactly, you'll find two places:
- In prepare()
- In rectForThumbAtIndex(_:)
This is strange because rectForThumbAtIndex(_:) is called in a loop inside of the prepare method after the size lookup has already been generated.
More importantly, as the number of items in the collection grows, the number of items to loop over grows too. It's very likely that this extraneous call to createSizeLookup() is the source of the bug. You should be able to remove the call to createSizeLookup() from rectForThumbAtIndex(_:) without problems because the lookup is already created before the items are iterated, so it's safe to assume that the lookup exists when rectForThumbsAtIndex(_:) is called. Remove the call to createSizeLookup() and run your app on the device. Make sure to do plenty of scrolling to verify that the bug was fixed.
To make sure that everything is fixed, you should use Instruments again to see what the Time Profiler report looks like now. Start a new Time Profiler session in Instruments and repeat the steps you performed before. Navigate to a collection and scroll down for a while so the app loads lots of new pages.
Looking at the result of the measurements now, the percentage of time spent in createSizeLookup() has dramatically decreased. It has decreased so much that it's not even visible as one of the heaviest methods anymore. The app performs way better now and you have acquired the measurements to prove it.
Now that the scrolling performance issue is solved, you can navigate the app, and everything is working smoothly. But if you take a look at the memory usage in Xcode, the memory usage still goes up every time you navigate to a new item in the table view. This means that the app probably has another problem in the form of a memory leak. Let's see how to discover and fix this leak with Instruments and Xcode.