
To figure out why the memory usage of Mosaic increases every time a new screen is loaded in the app, you should profile the app using the Allocations Instruments template. When you've started a new Allocations profiling session, navigate through the app and you should see the memory usage graph rise consistently. This behavior is typical for a memory leak, so it's time to dig in deeper to figure out what exactly is going on that causes this to happen. Take a look at the following screenshot:

If you look at the detail area in Instruments, there is a lot of information there that does not make a lot of sense. A lot of the objects that are created are not objects that you explicitly wanted to create, which makes it hard to figure out what's causing the memory problem. It's not very likely to be an issue with UIKit, for instance, and even if it is, you can't quite fix that. Luckily, you can use the search dialog in the top-right corner of the detail area to look for objects that do belong to the application code, giving you insight into what's happening with the objects that get created by the application code.
If you type the word Mosaic in the search box, you'll find a couple of objects, and they should all look familiar to you. In the detail area, you can now see the number of instances of a particular object that is in memory. Refer to the following screenshot:

If you look closely, you'll find that there are way more collection view cells, collection view controllers, and collection view layouts present than you'd expect. The app can only show one collection view at a time, and when you navigate back to the list view controller, you would assume the collection view controller to be deallocated since nothing should be referencing it anymore.
When you segue to one of the collection view controllers, it's added to the viewControllers array on the navigation controller. This means that the navigation controller keeps a reference to each of the view controllers that are part of the navigation stack. This means that none of the view controllers in that list should be deallocated because the reference count is at least 1.
When you pop back to the list view controller, the navigation controller removes the collection view controller from its viewControllers array. The result of this is that the reference count for the collection view controller is now decremented by one since the navigation controller is not referencing it anymore. This should put the reference count at 0, meaning that the collection view controller can be deallocated and the memory should be freed up.
However, something is preventing this from happening, because the collection view controller remains allocated according to the observations in Instruments. Unfortunately, Instruments does not tell you much more than the information just saw. Objects are sticking around for too long, which means that a reference cycle exists somewhere. This probably means that something is referencing the collection view controller and in turn, the collection view controller is referencing something else.
To figure out what's going on, you should probably start looking for problems in the collection view controller. The collection view controller has a delegate relationship with an object conforming to ListCollectionDelegate. It also acts as a delegate for the list collection view cells it displays, and it's also a delegate for the detail view. All the delegate relationships are references to other objects. These delegates could very well be causing the reference cycle. You can use Xcode to visualize all the objects in memory and see how they relate to each other. This means that it's possible to capture the state of the app's memory after browsing to several collection views, and you can see which objects are holding references to other objects. This enables you to visually identify reference cycles instead of blindly guessing.
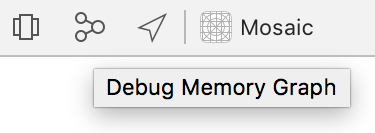
To visualize your app's memory usage, build and run the app in Xcode and navigate to a couple of collection views. Then open the memory view in the Debug navigator in Xcode and click the Debug Memory Graph button in the bottom toolbar of the screen:
After clicking this button, Xcode will show you a visual representation of all the memory that your app is using. In the toolbar on the left side of the screen, look for ListCollectionViewCell and click it. Xcode will show you the relationship between ListCollectionViewCell and other objects. At first glance, nothing unusual is happening. There is a list view controller, which holds a reference to a collection view, then there are a couple of other objects, and finally there's the collection view cell:

Next, click the collection view controller. When you click it, two different views could be shown to you. One of these two shows a couple of collection view cells pointing to the collection view controller and there should be a navigation controller in the graph as well:

The other situation you might see is slightly different. It also has all the cells pointing to the collection view controller, but the navigation controller is nowhere to be found, as shown in the following screenshot:
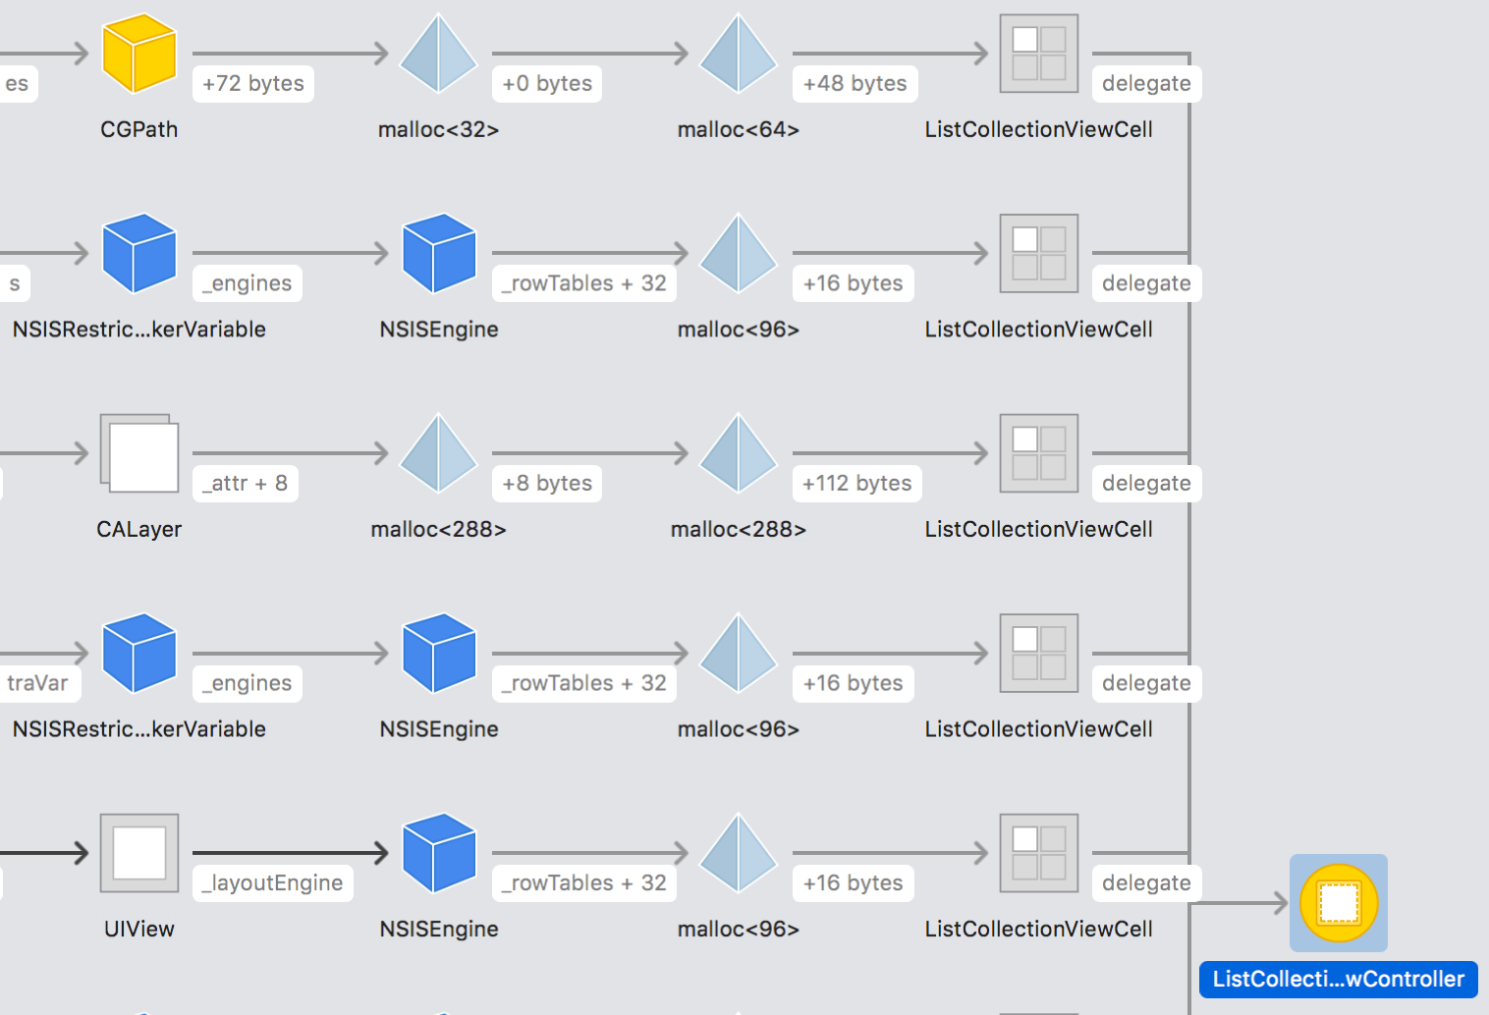
This is pretty typical for a reference cycle. Objects that should be long gone stick around because somewhere, somehow, they are keeping references to each other. The memory graph reveals that the delegate relationship between the collection view controller and the collection view cells could very well be causing problems, you can begin fixing them.
In this case, the fix is pretty simple. You need to make the delegate relationship between the cell and the controller weak. Do this by opening ListCollectionViewCell.swift and changing the delegate declaration as shown:
weak var delegate: CollectionItemDelegate?
Marking the delegate as weak breaks the reference cycle because the references aren't strong anymore. This essentially tells our app that it's OK if the referenced object is deallocated. One final adjustment you must make is to constrain CollectionItemDelegate to class instances only. Due to the nature of value types, such as structs, you can't mark references to them as weak, and since protocols can be adopted by both value and reference types, the protocol must be constrained to class instances only. Update the declaration for the CollectionItemDelegate protocol as shown:
protocol CollectionItemDelegate: class
If you run the app now, you can safely navigate around and both the memory debugger and Instruments will prove that you no longer have any reference cycles in your app. It's possible that Instruments still tells you that your memory usage is growing. Don't worry about this too much; you did your job making sure that your code is safe and that all memory that you don't use anymore can be freed up.
The example of a reference cycle you just saw is a very common one. A common way to avoid reference cycles in delegates is to try to make all of your delegates weak by default. This prevents you from making mistakes that you might not catch right away and it's often the safest route to go. Do note that there are many ways in which a reference cycle can occur, and you should always use the appropriate tools to troubleshoot your memory issues.
Let's wrap up this exploration of Instruments by creating an Instrument of your own.