
CHAPTER 58
BUSINESS CONTINUITY PLANNING
Michael Miora
58.1.1 Enterprise Risks and Costs
58.2.2 Correlating Objectives to Corporate Missions and Functions
58.2.4 Mapping Goals to Recovery Phases
58.3 PERFORMING A BUSINESS IMPACT ANALYSIS
58.3.1 Establishing the Scope of the Business Impact Analysis
58.3.3 Describing the Functions
58.3.4 Definition of Departments and Functions
58.4 BUSINESS IMPACT ANALYSIS MATRIX ANALYSIS
58.4.1 Listing the Functions Organizationally
58.4.2 Finding Cross-Department Functions
58.4.3 Using the Ranking Factor
58.5.1 Quantitative Risk Model
58.5.2 Generalized Cost Consequence Model
58.1 INTRODUCTION.
We are in an age where businesses and governments are turning in increasing numbers to high-technology systems, and to the Internet, to gain and maintain their competitive advantage. Businesses of all types are relying on high-technology products to build, promote, sell, and deliver their wares and services—as are government, educational, and nonprofit enterprises. All of these are dependent on technology to maintain their income, image, and profitability. business continuity planning (BCP) is the process of protecting organizations from the deleterious effects on their missions that can result from outages in information systems.
The goal of BCP is to protect the operations of the enterprise, not just the computing systems. Prudent planning is not restricted to computer or telecommunications systems but is enterprise-wide. There lies the key difference between the traditional hot sites and service providers and the newer, self-contained and supported backup and recovery capabilities. Without the people, procedures, and connectivity to keep the enterprise going, there is little point in restoring systems.
The enterprise has evolved to this dependency through the continual redefining of the word “fast” and the growing expectation of having access to information anywhere and at any time. In the 1960s and 1970s, fast turnaround meant a week or, with luck, a few days. In the 1980s, fast was redefined to mean today—the 1980s brought lower-cost computing and the beginning of high-speed communications. For the 1990s, fast meant now. The 1990s brought the Internet, intranets and extranets, with distributed systems, sophisticated client/server architectures, and high-speed communications.
Today, information is predominantly collected and sent electronically, often without human intervention. Analyses have been automated and streamlined, strengthened by user-friendly tools and by expert systems. Data are requested, sent, and analyzed in minutes; reports are generated automatically; and presentations can be created, edited, and delivered in near–real time. Moreover, access to information is provided almost equally fast to internal corporate personnel, to business partners and allies, and to customers and consumers.
It should be self-evident to business owners and other stakeholders that planning is an important function and that no enterprise, large or small, should be without a plan. However, as shown in Exhibit 58.1, this is not the case. Regardless of the size of the enterprise, full readiness to handle disruptions is not universally achieved. For larger enterprises, only one-third of companies claim to be fully prepared. For smaller companies, the number is larger, but the validity of some of these responses may be questioned, given that this result is based on self-assessments reported to a survey organization.
At least one partial explanation for this lack of preparedness goes to the heart of how BCP is understood in the business community. It is not clearly understood that the goal of BCP is to protect the business, not simply its equipment or information; at least one goal of this chapter is to show that the focus of the planning should be on business issues.
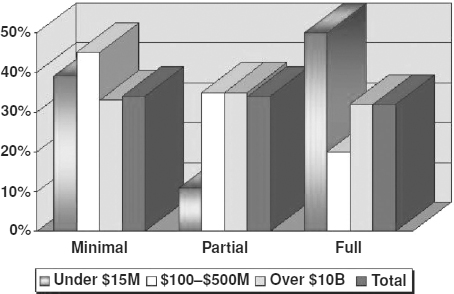
EXHIBIT 58.1 Corporate Preparedness
Source: BC Management, “2003 Benchmark Study Results.”
58.1.1 Enterprise Risks and Costs.
The overall risk is to the continued survival of the enterprise. A company weakened by a disaster, and without adequate preparation, may be unable to recover before failure or a hostile takeover occurs. In the 1970s, formal business continuity plans did not exist; only data backup and recovery procedures, with some disaster recovery planning for large systems, was considered. Today, companies without active and tested enterprise contingency plans are likely to fail in the event of a disaster. Such failures may have dire consequences for the board and corporate officers, whose lack of due diligence is demonstrated by the absence of planning. The need for planning may be well recognized, but protected companies are still in the minority.
There is abundant evidence that unprotected companies suffer greatly during major outages. In investment trading, time is crucial, yet many investment firms did not have a plan in place until late 1993, when a major hot-site provider first built a contingency trading facility in New York. Companies protected by disaster recovery plans can control their losses, holding them down to reasonable levels. Experts in the field believe that companies without such plans are likely to suffer significantly greater losses, with consequences so critical that almost 50 percent of firms that do not recover within 10 days never will recover.
R. A. Elbra, the author of “Contingency Planning,” a technical report published in 1989 for the National Computing Center (London), demonstrated that if a critical system was inoperable without suitable backup for as few as six days, the cumulative loss could amount to 200 percent of the net daily income produced by that system. After 12 days, the cumulative loss could be 800 percent of the net daily income, as shown in Exhibit 58.2. In the years since that report was published, the reliance by large and small enterprises on their systems has grown significantly. As greater portions of corporate revenues are closely tied to systems and connectivity, these numbers take on even greater significance.
Even today, few industries have strict disaster recovery or business continuity planning regulations. The banking industry is subject to such regulations for portions of its systems only. Even Sarbanes-Oxley has minimal requirements, although there are other U.S. federal and state laws that lay requirements on financial services organizations. The Health Insurance Portability and Accountability Act (HIPAA) contains security and privacy elements that make Business Continuity Plans even more important than before, although full BCP is not a specific requirement.
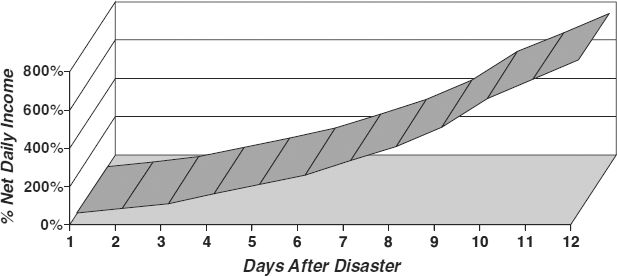
EXHIBIT 58.2 Fiscal Losses Caused by Disasters
There are many examples of serious downtime, including one instance of a construction crew repairing a nearby roadway and mistakenly damaging the power lines feeding a nearby set of buildings. Repairs required parts that delayed completion of repairs for almost 48 hours. One of the affected companies was an electrical supply company with revenues of approximately $50 million annually. The company felt safe because it had a plan that included reciprocal agreements to share spare computer time with other companies using similar equipment. Unfortunately, the company was unable to secure as much time as it expected because some of the other companies had changed equipment since the agreements were made, some were too busy with their own processing, and some simply did not abide by their agreements. To the chagrin of management, the replacement capability was limited to 30 percent of normal processing. Management reported that this outage cost the company over $250,000 in lost and unrecoverable sales. Although managers were unsure of their market share losses, they did know that two major customers subsequently split their orders between the affected company and another supplier. Although this is not a headline-grabbing disaster, it did significantly affect this financially healthy company.
A less healthy company might have been bankrupted by such a loss. Even surviving businesses experience significantly lower profits for the two-year period following a disaster. Reconstruction costs usually exceed insurance allowances and typically involve uninsured costs for modernization. Insurance premiums usually rise, and advertising budgets increase, to repair the corporate image. The largest problems, however, are due to productivity declines and inefficient operations caused by production restarts, debugging efforts, and the need to retrain newly hired staff to replace employees who departed in fear of corporate collapse or layoffs.
Cantor Fitzgerald, a bond company with a major office in the World Trade Center, lost 733 workers in the North Tower on September 11, 2001. The company's disaster recovery plans and mirroring sites enabled it to be back in action and taking orders just 47 hours after that loss. This was especially noteworthy because of the range of the disaster and the fact that the tragic loss of life included approximately 150 information technology workers.
Management's voice is needed to address another key issue. During natural disasters, employees at all levels of the corporate structure will make family and home their top priority. The successful recovery plan considers the need for employees with recovery responsibilities to ascertain first the condition of their own homes and families. Corporate management can make it clear to all employees that people come first. Recovery plans must provide participants with the time and the means to reach their loved ones. Once people are satisfied that families and homes are safe, then they can turn their full attention to corporate recovery.
58.1.2 Types of Disasters.
Many different threats can lead to disasters. Exhibit 58.3 lists a small sampling of these potential threats. It is neither feasible nor desirable to design a strategy for each of these disasters. It is more important to consider the effects of each applicable potential threat. For example, a bomb threat may deny access to the building or to the local area for a time. A small fire may deny access to an entire building for a day and to a small portion of the building for a few months. All threats can then be grouped by their levels of impact. Exhibit 58.4 lists one hierarchical structure that maps the levels of impact to a predefined duration of outages.
Identifying disaster threats and grouping them into disaster types fulfills a planning need. Each disaster type is associated with an outage duration, which is the length of downtime expected, and with a set of predefined outage durations, such as indicated in Exhibit 58.4. Therefore, each disaster type can be mapped to specific corporate functions that will be affected.
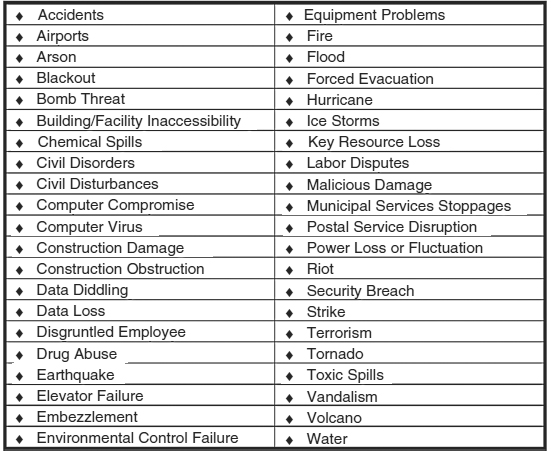
EXHIBIT 58.3 Disaster Threats
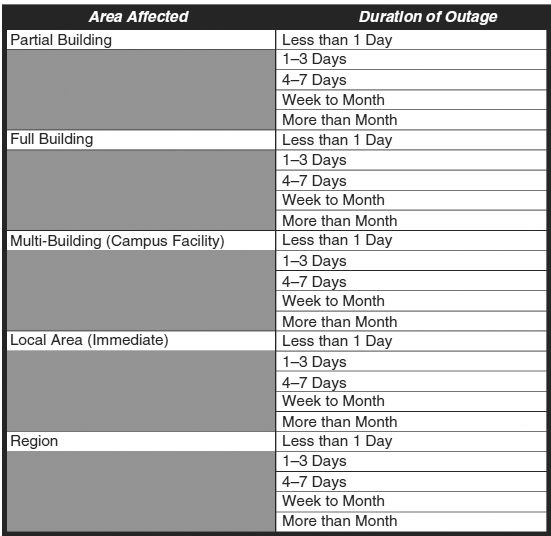
EXHIBIT 58.4 Levels of Impact and Durations
For example, a bomb threat may affect an entire building, but only for a fraction of a day. If this is so, then protecting against a bomb threat requires protecting only those corporate functions performed in that building whose survival time is one day or less. A toxic spill caused by a nearby train derailment may disrupt an entire facility, or campus of buildings, for several days. Protecting against a toxic spill requires protecting all functions whose survival time is less than several days. A regional disaster such as an earthquake, flood, or hurricane, however, disrupts operations for a longer period, and may prevent quick recovery anywhere within the affected area.
Business continuity plans need to be developed in a modular fashion so that modules can be activated depending on the disaster type. Assessing the expected duration of a disaster provides a means of determining which functions should be scheduled for recovery initiation; assessing the level of impact provides a mechanism for determining what type of recovery should be performed on each function. These are the two major factors that need to be identified promptly after a disaster: estimated duration and expected level of impact.
On September 11th 2001, there were many companies whose complete operations were destroyed; In one case, all of the staff perished. Yet, the companies that had made business continuity and disaster recovery in advance did recover, some with no discernable long-lasting impact to the client base or long-term profitability. The companies that survived and flourished and preplanned, pre-staged and up-to-date hot sites, either through an external provider of internally.
The key point is that planning for specific threats is not necessary. Planning for types of outages is more efficient and more effective. It may not matter whether the building is damaged by fire or water, or terrorist attack but the extent of damage and the duration of the outage are important, for those factors determine the types of recoveries to make. Traditionally, enterprise risks were calculated on aper-threat basis. Each threat was analyzed to determine the percentage probability of that threat occurring within a period. Those probabilities were then summed over all possible threats. The resulting figure was a representation of probability of some disaster having a significant impact on business operations over a period such as a year. The disadvantage of this method is that it misleads management into believing that the probabilities are so small as to be insignificant. A different and more streamlined analysis is more useful for the disaster recovery process. It is called the Generalized Cost Consequence model (GCC) and is described in Section 58.5.2.
58.1.3 Recovery Scenarios.
Recovery scenarios are the planned steps to be followed when disaster strikes. These scenarios are designed based on the various threat levels of impact and durations. All recovery scenarios are built in three phases, or sequences, of activities as shown in Exhibit 58.5.
The beginning sequence evaluates an emergency to determine the effect of the event on the enterprise. This can be an unhurried, deliberate activity when there is sufficient notice of an approaching problem. An example of this is a hurricane, where weather reports contain warnings days in advance, and additional information can be evaluated as it becomes available. In contrast, the pace is highly fast and frenetic during an evacuation due to fire, flood, or earthquake. Achieving a safe position is always the first consideration; following that are the other steps: determining the disaster type and declaring a disaster; activating the disaster recovery teams; making legal, regulatory, and other notifications; and establishing command and control centers. This beginning sequence often involves top corporate management.
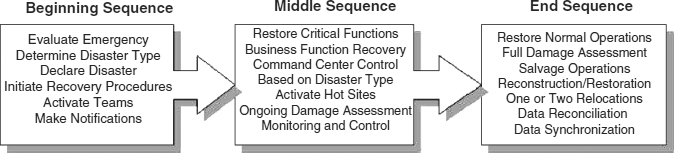
EXHIBIT 58.5 Phases of Recovery
The middle sequence includes most of the major recovery activities. Whereas the beginning sequence determines the type of disaster in progress, this sequence provides procedures to the various functional groups based on the type of disaster in progress. One key element of the middle sequence is to perform ongoing damage assessments and maintain contact with salvage operations. Knowledgeable information technology personnel should be available to review salvage possibilities and rebuilding plans for information equipment.
The end sequence restores normal operating conditions. This phase of recovery is the least predictable of all, and is linked to disaster type and to specific threats. Therefore, this phase is planned in more general terms than the two preceding sequences. In the end sequence, detailed damage assessment is performed. Salvage operations for vital records, information equipment, data, and general facility equipment take place. Reconstruction or relocation activities are specified and executed. Finally, normal operations are restored. Often the end sequence includes two facility relocations. The first relocation moves operations from the emergency operations centers, including the command center, hot sites, work area recovery centers, and other off-site workplaces, to a longer-term interim operating area. This longer-term operating area may be a cold site or other temporary work area. The second relocation is from the interim facility back to the reconstructed, or to a newly constructed, permanent home.
Completion of the recovery plan occurs when normal operations are restored. Ending the formalized recovery procedures before then may introduce errors and may compromise integrity in the final move to the permanent facility. In this final move, large processing equipment is torn down and moved, just as it was during the initial disaster declaration, only in a more deliberate manner. Temporary operations may require use of the reserve systems as backup in case the move encounters problems. Often much of the equipment at the interim site is required at the permanent site. Finally, data reconciliation, the merging of data from different operating environments, and data synchronization require planning and careful implementation to prevent the destruction and replacement of good data with erroneous information.
The traditional disaster recovery strategies include hot sites for data centers and emergency services for employees. These sites have been effective and continue to be necessary, but not sufficient. New strategies are needed to consider the new ways of doing business: mobile computing, real-time sales and service support, client/server architectures, extensive telecommunications, real-time process controls, and online customer service support. Preplanned recovery capabilities can resurrect functions that depend on huge databases and large systems in hours rather than days. Connectivity can be restored in minutes, and the client base need never know that a disaster has occurred. Business can continue, no matter what has happened, so long as proper recovery precautions have been taken.
58.2 DEFINING THE GOALS.
Defining the specific goals of a business continuity plan is a multistep process that correlates what is important to the enterprise with what the enterprise does, and is tempered by what is possible. A general goal for a plan may be stated in this way: Protect critical business functions so they will continue meeting minimum corporate objectives cost effectively during times of crises and disasters. This general statement describes (BCP) goals for many companies. Before building a plan, however, specific goals must be conjectured by the planner, evaluated by the planning team or steering committee, and validated by corporate management.
This section describes the specific elements and steps of defining the goal of the recovery and continuity plan, and identifying the specific objectives required to meet that goal. Succeeding sections describe how to determine the criticality and time sensitivity of various corporate business functions, how to gain and keep commitments from management, and how to define what protections are needed for each business function.
A business continuity plan may have many specific goals. For example, a central order entry and production scheduling system may reside at corporate headquarters or at the corporate sales office, while manufacturing may be dispersed geographically and by product across many facilities. One possible objective of the plan for such an enterprise is to maintain production levels at some fraction of normal levels even if the corporate center is damaged or destroyed.
A California manufacturer of custom filters devised exactly such an objective. For the vast majority of the firm's products, normal operating procedures were for a five-day cycle from order to shipment. Order entry was performed at corporate headquarters. Full material requirements planning (MRP) of all North American manufacturing sites, including purchasing, control, scheduling, and shipping, was performed on the same system. Corporate management determined that the company could not survive for more than a short time unless overall plant production capacity was maintained at 50 percent of normal levels. Production of less than 50 percent would make it infeasible for the company to survive more than two weeks. Production of more than 50 percent but less than 100 percent of normal levels would severely reduce or eliminate profits but would not cause corporate failure. The clear goal of this plan was to protect the functions required to meet the objective of achieving a minimum of 50 percent of normal levels.
The firm performed an analysis of products and revenues. It considered the quantity and cost of the various filters made, the resulting manufacturing load, and the customer base. Although the overall requirement was to maintain a manufacturing load of at least 50 percent of normal, the firm also wanted to make certain that major customers were served and that large contract commitments were met. All of these requirements were incorporated into the final BCP. In another case, a major electronics manufacturer provided free, seven-day, 24-hour customer service and technical support to all customers. Two facilities in the United States provided support to customers worldwide. This support was a major competitive advantage and was believed to be a major contributing factor to the reputation and exceptional customer loyalty enjoyed by the manufacturer. During normal operations, the call center guidelines were:
- All incoming calls must be answered by the third ring.
- Average waiting times must be less than two minutes.
- Maximum waiting times would not exceed six minutes without operator intervention. Moreover, busy signals should not exceed one caller in 500. Communications systems linked technical support personnel with technical databases.
These were strict criteria for the company's service-level objectives, and traffic engineering studies carefully monitored busy signals and queuing delays to prevent violations of call center guidelines. Trunk lines were added or removed, and staff members were rescheduled to maintain this level of support, which far exceeded industry standards. The major goal for the call center business continuity plan was to maintain service-level objectives at a predefined minimum degradation level. The allowable queuing delay was increased significantly, and the busy signal allowance was increased slightly. A special message would play apologizing for any inconvenience, but all customers still would be served. The planning project identified what capabilities were needed to meet these requirements. The goal of this plan was to provide the backup capabilities needed to meet the reduced service-level objectives using a combination of the preexisting surviving call center and some emergency capability for the damaged or destroyed call center.
Corporate goals are independent of means and systems; they are stated in business terms. Top management must make decisions about what needs to be protected and how protected it needs to be. Often, though, this is an iterative process in which management designs some preliminary decisions and instructs analysts to confirm or refine those thoughts. The disaster recovery planning process includes steps to do just that during the business impact analysis (BIA) phase.
The goals of the plan are associated with the products and services that the enterprise or operating unit provides. In cases where the facility to be protected is a support facility, such as the corporate headquarters of a manufacturing conglomerate, the services provided are in support of the overall corporate operations, perhaps including banking and other support activities. In these cases, although the services are somewhat removed from actual production, they are still imperative to continuing production. Building the plan requires goals that are more specific in nature than those in the examples above. In this methodology, these lower-level goals are referred to as the plan objectives.
The BCP objectives are closely coupled with specific business functions and are not adequately defined until the conclusion of the business impact analysis. In order to begin this definition process, however, first the recovery problem must be constrained by defining the scope of the disaster recovery plan.
58.2.1 Scope.
The scope of the plan is the definition of the environment to be protected. Before performing detailed analyses and interviewing management, decisions must be made regarding who and what is to be included in the plan. Specifying the systems, equipment, procedures, locations, and support capabilities that require protection identifies the scope. The corporate environment consists of people, information, facilities, and equipment. The plan focuses on a subset of the people, some of the information, selected facilities, and specific equipment. That constitutes the scope of the BCP. Stated more simply, no matter what the size or complexity of the enterprise, planning is performed on one part of the enterprise at a time.
The scope must be established in order to define the goals of the plan. However, during the planning process, the scope will be refined and redefined as the analysis progresses. Which facility is involved? Is part of a building being protected, such as the data center or the shop floor? Is it the entire facility, including a campus of buildings that fall into the scope of the plan? To perform a BIA, users must focus on the business elements that reside or utilize the people, information, facilities, and equipment that are in scope. However, sometimes it becomes clear during the analysis that the scope must be broadened or can be restrained to protect business functions adequately.
In a world of tight budgets, compressed schedules, and phased implementations, BCP usually is performed in stages. Perhaps the computer and telecommunications systems are protected first, followed later by other office support equipment such as copiers and hard copy files. No matter which elements are chosen for implementation, the scope must be clearly documented. For computer systems, the current systems in use must be identified. Hardware and software must be described in detail. Special equipment must be identified.
In the planning process, it sometimes becomes clear that important items have been excluded from the plan. Where those newly uncovered requirements prove to be critical, they must be included, but for all others, a well-defined scope will prevent creeping requirements that increase cost and lengthen implementation schedules. Requirements identified as desirable but not absolutely necessary can be recorded in an ongoing project log and scheduled for implementation in a later phase. It is better to put into place a plan that leaves out some capabilities while meeting basic objectives than to allow the planning scope to expand, thereby risking long delays or project abandonment. A clearly defined scope enables the planning team to communicate to management precisely what is and what is not protected or included in the planning process.
Major scope issues and disagreements sometimes can be resolved in this early phase of the planning project. If not, resolution of these issues is best delayed until the conclusion of the BIA, since that process reveals hidden functional interdependencies. For example, research and development (R&D) functions usually are longer-term projects that can be delayed without major impact on the enterprise. In many plans, R&D functions are relegated to low priority. Consider, however, the case of a customer service technical representative discussing the status of a custom-manufactured product with a key customer who is unhappy with the delivered prototype. If R&D technical personnel are required to resolve such issues, and resolution has an impact on production schedules, then R&D may be elevated to a higher priority. The BIA process usually reveals and prioritizes such hidden interdependencies.
58.2.2 Correlating Objectives to Corporate Missions and Functions.
It usually falls on the information systems and technology department to build the BCP. Naturally, then, most plans focus first on computers and telecommunications. While there is nothing intrinsically wrong with starting that way, it must be just the first step of the analysis. The danger is the potential for myopic views of corporate functions; corporate computer and telecommunications systems may be required for the successful execution of critical business functions, but usually they are only part of many needed capabilities. Desktop paper files, telephones, personal phone directories, and copying machines may be just as important as access to the corporate database or to some tailored vertical application. The list of functions and equipment to be investigated must be complete or the resulting plan will be inadequate.
The BIA provides a formal methodology for ranking business functions by criticality and time sensitivity. The process includes interviews with key personnel from each business function included in the scope of the planning project. There are two dangers inherent to an information technology–based approach to disaster recovery planning.
- Business functions that do not use information systems may be inadvertently overlooked.
- Noncomputer support structures and systems may not be recognized and, therefore, not brought into the protection definition process.
When the information systems department leads the disaster recovery project, it will naturally base the plan on a systems-based knowledge of the enterprise. The accounting department, a traditional heavy user of computer systems, will naturally be included among the functions that potentially need protection. Similarly, all other functions that use computers in their normal activities will likely be included in any list of functions requiring analysis. All organizational elements that use computer systems will be recognized and included precisely because they use computers and therefore are known to the systems department. However, there are many important functions that may not regularly use computers or may use them in ways that are only minimally visible to the systems people.
Mailroom operations are frequently omitted because often they are not computer users. Planning personnel are clearly well aware that mail operations exist; they just might forget to include them in the planning process even though mail operations are important to every organization. Planning mailroom recovery and continuation is simple before a disaster but very difficult after the fact.
Facilities management, maintenance, and plant engineering organizations are seldom intensive computer users in their daily activities. Nevertheless, in normal circumstances, operations in a large facility would deteriorate quickly without these functions. During a disaster, these are the people who can rapidly determine the nature and breadth of facility damage. They are the people who need to be instantly available to evaluate damage, hasten repairs, and estimate duration of outages. They are also the individuals who are often left off the disaster recovery team lists and phone rosters. Similarly, security forces are needed when building damage leaves valuable equipment and other assets vulnerable to theft or vandalism. They may be needed to protect employees who are working during civil disturbances or other such incidents. Corporate communications and public relations departments are also frequent computer systems users, but they are not very visible to the systems department as unique functions, although their contributions to a successful recovery are often essential.
The safest way to compile a list of business functions is to work from three documents: an organization chart, a corporate phone directory, and a list of corporate operations budget line items (see Exhibit 58.6). Using these three lists, the planner can develop a comprehensive list of business functions and can identify the manager or supervisor of each function. That comprehensive list should include every function performed, regardless of the perceived importance of that function. Criticality and time sensitivity will be determined during the BIA; leaving off any functions can lead to inaccurate BIA results.
Working from that comprehensive list, a second list should be compiled that includes or excludes each business function based on the defined scope of the BIA. When doubt exists, the function should be included. The BIA will be the final filter for out-of-scope functions. Therefore, for each function in the list, the planner must determine which of the included elements are relevant to the function under evaluation. Although this may seem to be a complicated process, it is usually straightforward. The golden rule is: When in doubt, include the function. It can always be excluded later if analysis shows that the function is really out of scope.
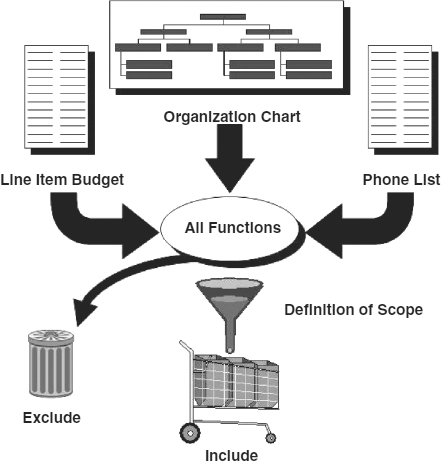
EXHIBIT 58.6 Building and Filtering the List of Functions
58.2.3 Validating Goals.
A full disaster recovery plan must consider the contribution of each element of the organization to the overall corporate goals. Clearly, no single area is dispensable, for if it were, it would have been discarded already. Properly defined goals are independent of specific functions as they are stated in global terms. Validating the goals requires examining each function to determine how it contributes to the corporate objectives. It is necessary to distinguish between the importance of a function toward meeting specific disaster recovery goals and the overall importance of a function to an enterprise.
Even functions that are not relevant to any specific disaster recovery goals may be crucial to the overall operation of the enterprise. The BCP focuses on protecting selected corporate functions for a specified period of time, but it is a mistake to assume that a function whose importance to recovery goals is low is not important to the enterprise in the longer run. For example, during a crisis, the corporate tax accounting function often can cease operations with little impact to the enterprise. If this is true, then the continuation requirements for that department are minimal, and the recovery timeline can be extended. Clearly this does not mean that the corporate tax accounting function is unimportant. Other examples of longer-term requirements include fulfilling regulatory and legal requirements.
The goals of the BCP are associated with the products and services of the enterprise and are expressed in business terms. Validating those goals requires presenting management with options for levels of protection and their associated costs. Gross estimates are possible at the outset; refined presentations require a complete BIA. The goals should be clearly defined and presented to management. Although these goals are not addressed specifically by each procedure in the ultimate BCP, they drive the entire recovery strategy development. A clear and concise description of the goals must be presented to management and approved by them. After this approval, the disaster recovery planners can attempt to attain those goals. During the strategy development, other alternatives may appear and may be added for ultimate management consideration, but the initial goals become the operational baseline against which strategies and costs can be measured.
58.2.4 Mapping Goals to Recovery Phases.
There are three phases to the recovery process:
- Continuation activities
- Resumption activities
- Restoration activities
The continuation activities are those specific tasks and procedures that enable a very limited set of functions to continue operating with little or no interruption. The resumption activities provide for resuming a full, or almost full, range of business functions, even if that resumption means using backup methods and temporary operating procedures. The restoration activities are those that bring back a normal operating environment in a permanent facility.
The continuation and resumption activities occur during the middle sequence of activities and are the activities that must meet the short-term recovery goals that are within the domain of the recovery plan. The restoration activities occur during the end sequence and may include some long-term goals. The long-term goals may include decisions about rebuilding versus relocating and other major decisions that are beyond the province of BCP construction.
Each goal should be assigned to one of these three sets of activities. This assignment is based primarily on timeline considerations: what must be continued quickly versus what can wait a short while, and what can be delayed for the longer term. In the call center example, the number of rings, the allowable queuing delays, and the busy signal allowance were measurements of service levels. They constituted the goals for the recovery plan. After an interruption, the levels of service can be restored to normalcy gradually, as a function of time since the disaster. Stated differently, with each passing day, the level of service should improve. Therefore, the goal of the continuation activities may be for service within some stated parameters, and the goal of the resumption activities would be for improved levels of service. Normal levels may await the restoration activities.
Clearly, the same level of service can be attained at lower cost if the timing requirements are loosened. That is the reason it is important to assign each goal to a particular set of activities. Exhibit 58.7 illustrates a potential mapping of service levels to activity sets. In the first hours following a disaster, the continuation activities maintain a minimum required level of functionality, with some increases over time. The resumption activities dramatically increase functionality immediately and then bring functionality, over time, to an almost normal condition. The restoration function, shown as two bars to represent temporary and permanent facilities, achieves full levels of service.
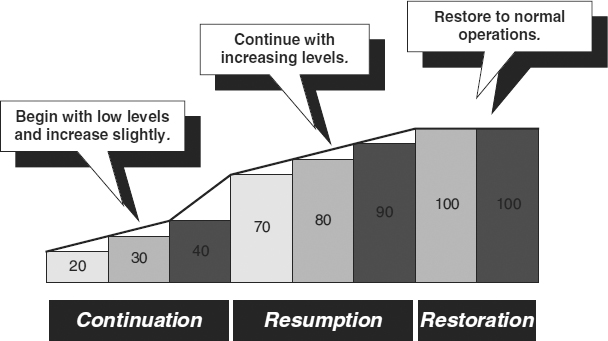
EXHIBIT 58.7 Service Levels Mapped to Recovery Activities
58.2.5 Emergency Issues.
A good plan includes provisions for ensuring the safety of all employees potentially affected by a disaster. This is especially true for employees working on site when a disaster occurs. Life safety issues include health and safety preparedness, shelter and care of employees caught in the enterprise facilities during a disaster, and search and rescue teams for employees in imminent danger. Some of these protections are required by various local, state, and federal regulatory agencies. Others are not mandated but are nonetheless important to the survival of the employees and the business.
Public relations is an important issue during any disaster. More than one enterprise has realized too late that neglecting the media can induce a second, even greater disaster than the original one to which the media was responding. Even a small fire can make major news in the local community. The public relations aspect includes recovery actions. For example, one chemical company suffered a minor fire but refused to inform the media on the status of cleanup operations. The result was predictable: The media reported that a fire had potentially released toxic chemicals into the local environment and that the company had refused to comment. That report did more to damage the reputation of this chemical company than did the fire that caused the spill, which was not in fact toxic, and was brought under control within hours of the fire.
58.3 PERFORMING A BUSINESS IMPACT ANALYSIS.
The business impact analysis comprises the heart of the planning process. It is here that the recovery planner determines what is important for inclusion into the BCP and what is not relevant to that effort. The BIA determines how far to go in protecting the people, information, and equipment that constitute the organization and its functions so that all survive to flourish another day.
The BIA assesses how unavailability of each system would affect the enterprise. The BIA is a multistep process that may be performed over a period of weeks or months, depending on the availability of various corporate personnel. Often the BIA may be a first effort to determine the total cost and the schedule required for a full plan. In all cases, the BIA should precede any other planning activities since it will help determine the direction and strategies for prevention, mitigation, and recovery.
58.3.1 Establishing the Scope of the Business Impact Analysis.
To succeed, a project must be well defined in terms of work effort and work product. Just as the BIA helps bound the recovery problem in precise recovery terms so that the project may be successful, the BIA subproject also must be understood in terms of the work required and the product of the analysis. This requires establishing the scope of the BIA by deciding what equipment the BIA will investigate and what people to interview.
The BIA begins with an inventory process to catalog the various equipment and capabilities to be protected. As systems evolve to meet ever-increasing customer demands, equipment and management responsibilities change along with them. For example, a mainframe shop with large local area networks (LANs) and wide area networks (WANs) may be managed by the information technology department, whereas smaller LANs may be managed by individual departments such as accounting or engineering.
Without a comprehensive and constantly updated list of systems across departments and functional areas, systems can evolve quickly with little or no overall corporate knowledge. For the recovery planner, this means the plan will be incorrect at its outset, or will grow obsolete quickly.
The inventory should describe in detail the general hardware and software used in each included system, paying particular attention to special-purpose equipment, such as imaging equipment, custom equipment, and uncommon equipment.
The inventory must include communications links and equipment. A connectivity map showing LAN and WAN equipment and connections is useful; a cabling diagram with gateways, routers, bridges, firewalls, proxy servers, and other communication equipment is also important. General telephony diagrams and summaries of lines and capacities are required to bring voice communications systems into the recovery process.
The inventory provides an opportunity to decide what level of office equipment and supplies (e.g., paper, writing implements, staplers, note pads) should be protected by the recovery plan. Although staplers seldom will be critical, certain printed business forms might well require off-site storage for quick recovery. Boxes of corporate checks, for example, should be stored securely off site.
Security access controls and special alarm systems should be included in the inventory, along with current procedures for maintaining them. There have been instances of a recovery hampered by inaccessibility to the building caused by active alarm and access control systems. Inclusion of such systems into the inventory helps ensure that they will help rather than hinder the recovery process.
58.3.2 Interview Process.
The best source of information about the work performed by the enterprise is the enterprise's own labor force. Corporate executives understand and control corporate goals; managers understand and control operations. Front-line supervisors and workers perform the daily tasks that bring revenue to the enterprise, and these are the people who have the knowledge needed for the BIA. The recovery planner must collect that information, understand it, and translate it into terms meaningful for disaster recovery planning. Exhibit 58.8 shows the three steps of interviewing.
The first step is to compile a list of all the departments that fall within the scope of the BIA. The term “department” is used here to describe an organizational entity that may not correspond with a specific organization chart position or with the use of the term within the enterprise. The term is meant to convey a functionally complete unit performing a task or a series of related tasks. It might well be that people from different organization chart departments work more closely with one another than they do with people in their own departments.
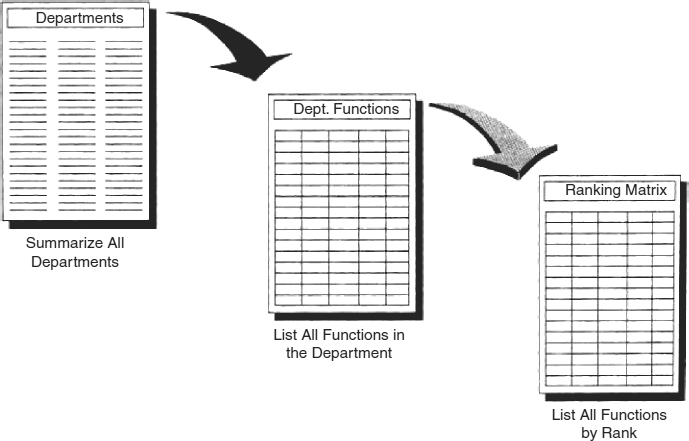
EXHIBIT 58.8 Three Steps of Interviewing
For example, the accounting department of an organization may handle all corporate accounting functions, including accounts receivable (A/R), accounts payable (A/P), general ledger (G/L), and payroll. However, for the purpose of the planning project, the planner may choose to group accounting into two departments: accounting and payroll. In this way, payroll can be separated from its organizational component and combined with other portions of the enterprise that provide the payroll data, and with which the payroll department interacts daily.
Once the list of departments is complete, the next step is to choose an individual in each department to be the primary interview candidate. Because the primary interviewee from each department will perform two functions—(1) identify all of the high-level functions performed within that department and (2) describe in detail many of those functions—that person should be an experienced and knowledgeable member of that department. It is neither necessary nor desirable to assign this interview position to a senior manager. Management interviews should be scheduled for a later phase that requires management insight. The first interviews should focus on daily task structures and purposes.
The recovery planner guides the interview. The first step of the interview is to describe the department in terms of its overall function and to list all the high-level functions performed. For example, in the accounting department, the high-level functions usually include accounts payable, accounts receivable, general ledger, and payroll. It may include corporate tax preparation, or that may be a completely separate function. It may include financial reporting for the Securities and Exchange Commission (SEC) and other filings, or a different department may perform those functions.
A corporate human resources department may include employee records, benefits management, payroll distribution, time sheet processing, and other common functions. For the planning project, the payroll distribution and time sheet processing functions may be more closely allied with the accounting department than with the human resources department.
During the interview process, the department expert will likely want to describe functions at a detailed level. For example, in the financial reporting area, the expert may want to list each and every report produced. While it may be useful for the planner to learn about the production of these reports, the BIA should categorize all related reporting functions into one function. Therefore, there is no function called 10K Reports, but there may be an overall SEC Reporting function. It is not possible to list all functions or potential functions here, but Exhibit 58.9 lists some examples. Each department should include several to a dozen functions. If a department contains only one function, it may be combined with another department, or it may be divided into lower-levels functions. If a department includes too many functions, then either the functions should be combined into a higher level, or that department can be divided into two departments.
The primary purpose of these interviews is to provide the information necessary to perform a matrix analysis that ranks all enterprise functions for recovery capabilities and timelines. An important secondary purpose is to raise corporate awareness of the recovery planning goals and preparations. During this interview process, the planner can explain that the overall purpose of the planning project is to protect employees and the business functions they perform. This is the opportunity to promulgate disaster preparedness as a normal and necessary part of the corporate business posture.
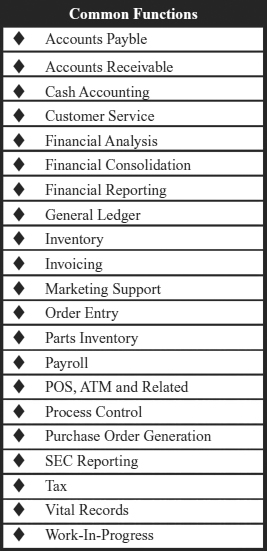
EXHIBIT 58.9 Examples of High-Level Functions
58.3.3 Describing the Functions.
Once the functions have been listed, the interviewer must collect summary information about each function. This functional summary will be included in the BIA document so that it will be clear to the reader precisely what the function entails. The description of no more than one or two paragraphs prevents misunderstandings and helps focus discussions during the interview. Along with the summary description, the interviewer can further describe the function by identifying the key and alternate individuals responsible for performing that function. These are not the managers of the functional areas; these are the people who do the work on a daily basis, enter the data, and perform the function. Each function should be associated with those individuals and with the functional area manager, and the information should be recorded in a matrix format.
This matrix format provides a single place to record all the nonnarrative information about the function. The matrix, which also will include quantitative data, will be combined with the narrative descriptions and some analysis to become the BIA document. The descriptions of each function identify the function clearly, assess the survivability factors of the function, and associate the function with the various existing corporate capabilities. The sections that follow describe the information to be collected about each function and suggest ways to encourage objectivity, even when collecting subjective quantification information. Exhibit 58.10 shows a blank, sample matrix.
58.3.4 Definition of Departments and Functions.
The first column is entitled Department, such as Financial Reporting, Central Distribution Center, A/P, Merchandising, Planning, Distribution, and Purchasing. Although these are not necessarily equal in number or scope, they are units that need to be analyzed as groups. When unsure of organizational entities, the planner can use the organization chart as a starting point. The department title can always be modified and the functions expanded as the need arises during the development of the BIA.
The second column is the Functions list. The functions are the high-level groups of activities performed within the department. Each function is a group of activities related to a single purpose. In the accounting department, for example, there is an accounts payable function, which may include activities such as receiving invoices, requesting payment approval, scheduling payment, and printing checks. Although these detailed tasks are very important, they need not be described individually since they all follow a single thread and timeline. The aim of the BIA is to establish the time and processing needs; therefore, any series of tasks that occur in a closely connected chain can be addressed together. Exhibit 58.11 pictorially depicts the relationship between departments and functions.
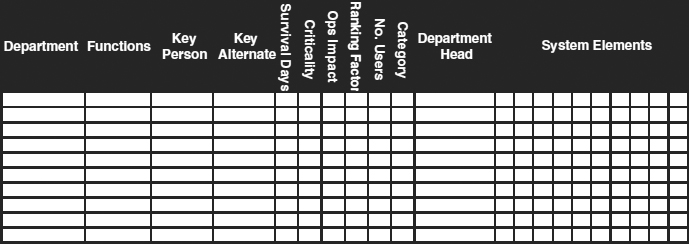
EXHIBIT 58.10 Blank, Sample BIA Matrix
Another example of a department is the distribution center of a warehousing operation. This may include functions commonly known as receiving, processing, shipping, quality control, and inventory control. Some of these are aggregates of lower-level tasks. Processing is a function that includes “pulls,” “moves,” and “put-aways.” If shipping, receiving, and processing are performed using the same resources according to a similar timeline, then they can be grouped as one function. Often the BIA calls this the Shipping and Receiving function. If inventory control is an outcome or natural by-product of the Shipping and Receiving function, then it need not be addressed individually. If inventory control includes special functions apart from the Shipping and Receiving function, however, it can be addressed separately.
One example of inventory as a separate function is regulated inventories. For example, alcohol storage requires careful scrutiny according to regulations of the Bureau of Alcohol, Tobacco, and Firearms. Inventories must be documented according to length of storage time, source, destination, and quantities. In this case, inventory control is a special function with its own resource and timeline requirements. Another example of inventory control as a separate function is the isolated customs areas in import and export centers, where inventory must be controlled according to source, arrival time, destination, departure time, and shipper.
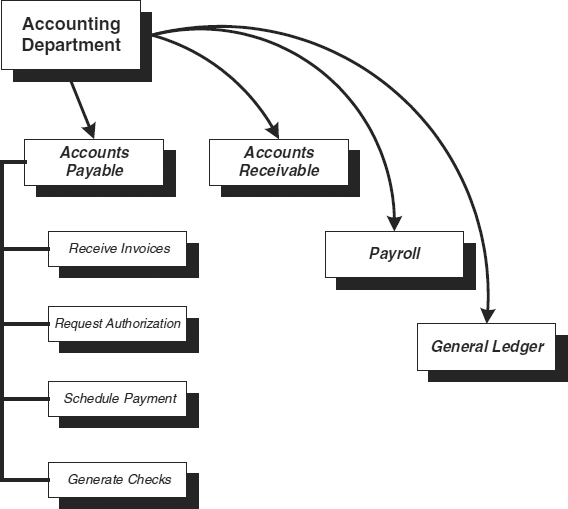
EXHIBIT 58.11 Departments and Functions
If functions are defined too tightly, which means at too low a level of detail, then there will be a great many functions, thereby hiding the true set of functions requiring analysis. This will result in a large set of functions that are so interrelated that they cannot reasonably be separated for individual analysis. If the functions are defined too loosely, which means at too high a level, then there will be too few functions, thereby hiding the timelines and forcing all functions to be rated as time critical. During the interview process, it is likely that the definition of functions will be refined and redefined several times. The functional area experts should guide the definitions, with the recovery specialist helping formulate the ideas.
58.3.4.1 Key Person, Key Alternate, and Department Head.
The third column in exhibit 58.12 identifies the Key Person for each function. The key person is typically neither a manager nor a supervisor. Rather, the key person normally performs the task at hand. For example, in the accounting department's time-keeping function, the key person is the individual who collects and enters or validates the time-keeping information. For the treasury department, bank transfer function, this is the individual who calls or connects to the banking system to perform the transfers and manage accounts—in other words, the person who will be responsible for performing the function during a crisis when little supervision, help, or direction is available. The manager may not know the phone numbers to dial, the people to talk to, or the keystrokes required to perform the function, but the key person must know these things, for that person may be working in virtual isolation immediately following a disaster.
The key person becomes an important member of the recovery team when that function is identified as a time critical, or Category I, function. In those cases, the key person receives training, special backup and communications equipment, and extra responsibilities. The key person is the enterprise's first line of defense against disasters.
The Key Alternate Person, identified in the fourth column, is the backup to the key person. When possible, the key alternate should be as well equipped and well trained as the key person. In practice, however, this is seldom feasible. The key alternate should be an employee who is as familiar with the tasks to be performed as the key person.
The eleventh column identifies the Department Head. This is the one individual who is held accountable for performance of all the functions listed for the department. The department heads for the various departments recorded in the matrix may report at different levels on the organization chart; this is an acceptable situation so long as each department head has direct management control of all functions listed for the department.
58.3.4.2 Survival Time.
The fifth column records the Survival Days as reported by the interviewee and discussed with the disaster recovery planner. The survival days are the length of time the enterprise can withstand the lack of a function with minimal impact. This length of time is measured in whatever units are appropriate to the enterprise, which may be minutes, hours, or months. This length of time is the maximum allowable downtime for the function, after which the enterprise begins to suffer serious repercussions. This measure does not determine the importance of the function to the enterprise; it only measures the time sensitivity of the function. Payroll, for example, is most often very time sensitive, affecting operations after only one or two days.
It may be possible to postpone tax accounting functions because there are alternative actions possible. Missing a filing deadline is avoidable by using past data and making reasonable, informal estimates of changes. Overpayments have few or no consequences. Underpayments may result in modest penalties and interest. Typically, payroll checks are generated close to the distribution date, with little spare time. However, most organizations can develop backup payroll procedures that can compress payroll processing into one or two days so that there is no delay in payroll distribution. Obtaining this information may require exploring past instances when the function had been postponed. The delay may have been due to illness, vacation, system downtime, or management direction. Inquiring about the effect of the delay may help refine the estimate of allowable down time for the BIA.
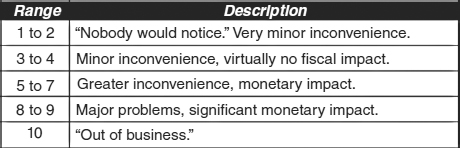
EXHIBIT 58.12 Criticality Ratings and Descriptions
58.3.4.3 Criticality.
The Criticality of a function, recorded in the sixth column, measures the magnitude of the immediate effect on the enterprise of function loss beyond the survival time. If payroll processing has been determined to have a one-day survival time, then criticality is the effect on the enterprise of payroll processing delays beginning on the second day and continuing from there. If tax accounting has been assigned an allowable down time of 30 days, then its criticality is the affect on the enterprise after 30 days.
Criticality is a measure of time-phased impacts. The criticality of a function is loosely based on fiscal impact to the enterprise. It is not identical with fiscal loss because indirect impacts are also important. A corporate image of reliability and strength may be lost forever if functional capabilities are not restored. NASA's Challenger disaster had an effect far beyond any fiscal estimate. The space program suffered a setback and a long delay. Some believe that NASA's loss of funding in subsequent years was attributable to this disaster. The value of lives lost in the disaster is, of course, immeasurable.
A major telephone common carrier once lost a major switching station, thereby causing all of its customers to be without long-distance phone capability for a significant time in the middle of a business day. Although the company lost only a relatively modest amount of money due to lost calls, the damage to its reputation lives on. Its loss of business is irreparable: Many of its dedicated customers decided to double-source their long-distance providers and now split their services between this company and its major competitor. This event constituted a permanent, unrecoverable loss of market share.
The Criticality column records an estimate of the impact of loss once the survival period has been exceeded. It is an estimate because it is not the result of a detailed analysis but rather is provided by the interviewee based on heuristic analyses and experience. The interviewee is asked to rank each function on a scale of 1 to10, where 1 is the least critical, and 10 is the most critical. Exhibit 58.12 summarizes these level criticality ratings and provides brief descriptions. The recovery planner provides this information to the interviewee and solicits a response. These criticality ratings are subjective, so the planner and the expert must work together to attempt to smooth out individual prejudices and opinions as much as possible. However, the ratings are designed to work with the operational impact measure (described in Section 58.3.4.4) to minimize this problem.
On the rating scale, a value of 10 is the highest level of criticality possible. This value should be accepted only if it is clear that virtually all corporate functions will come to a standstill. Frequently, the payroll function for hourly employees fits this criterion. Hourly, unionized employees may be specifically barred from working by union rules if the enterprise cannot provide a paycheck within some number of hours after the checks are due. In the case of a manufacturing company, this could mean that all production, receiving, shipping, and related functions cease. This is tantamount to a company shutdown. The phrase “out of business” from the summary table (Exhibit 58.12) fits this scenario. This phrase does not mean that the company ceases to exist; it means only that company operations cease until this function is restored.
The criticality range 8 to 9 often is used to signify that loss of a function will not drive an enterprise to close its doors but will cause severe damage or loss of confidence. Missed deliveries, loss of customer service functions, lower quality, and similar effects warrant a rating in this range. Functions such as corporate communications (e.g., press releases, customer relations, and shareholder notices), banking functions, some accounting filings, and order entry are examples of functions in this range.
The range of 5 to 7 is probably the criticality rating used most often. This range indicates considerable fiscal effect and significant inconvenience. If such a function were not recovered in time, the effect would be felt but would not be a major corporate event. Perhaps the significant difference between the range of 5 to 7 and the range of 8 to 9 can be summarized in this way: The former is an internal event that would be an internal problem. The latter would be reportable in annual reports and may require media involvement or public advertisements to explain the outage. The higher range has significance beyond corporate walls. Some functions that often meet the lower criteria are accounts payable, various reporting functions, and low-priority government regulatory requirements.
The criticality range of 3 to 4 identifies loss of a function as a minor inconvenience, with little or no monetary impact. Various filings, audits, and internal support functions often can be delayed, with no impact other than the need to perform the work later when functional capability is restored. These are not unimportant functions, but they are functions that can be delayed for a fixed interval with minimal impact on corporate operations. Examples of such functions are certifications, some SEC filings, electronic data processing (EDP) audit, financial audit, internal consulting, corporate directories, and ongoing training programs. Although these are important functions, sometimes significant to overall corporate survival, often they can be delayed without major problems.
The 1- to 2-criticality level indicates that loss of the function would be barely noticeable for the short term and would cause minimal inconvenience. Although these may be important, often regulated, functions, often they are fairly time independent. Examples include former employee tracking functions, claims management, charitable contributions, and equal employment opportunity/affirmative action plans. Although these are not necessarily level 1 to 2 functions in all companies, often they are functions that can be delayed for a significant time without jeopardizing the corporate mission.
58.3.4.4 Operational Impact, Ranking Factor, and Number of Users.
The Operational Impact, recorded in the seventh column, is an automated result that is a function of the criticality. Individuals within the enterprise will express their biases in the criticality ratings they assign to various functions. One employee may say that a function has a criticality rating of 7 and another may say 6 or 8. The operational impact measure lowers the granularity of the estimates by transforming a scale of 10 levels to a scale of 4 levels. In this way, individual biases can be normalized and the estimates adjusted to achieve a 4-level assessment of functional criticalities and impacts.
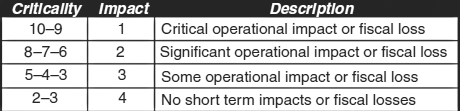
EXHIBIT 58.13 Transformation of Criticality to Operational Impact
Operational impact is derived through a many-to-one mapping that transforms criticality to operational impact as shown in Exhibit 58.13. This transformation achieves a data-smoothing function that removes discontinuities caused by individual or organizational biases. It also reverses the order of importance, making 1 the highest impact and 4 the lowest impact. Criticality measurements are transposed; where earlier a higher number meant higher criticality to a system, now a lower number means greater impact and higher priority. This provides a mathematical convenience for combining survival time and criticality into a single measure.
The eighth column is the Ranking Factor, which is the combination of survival time and operational impact, and hence criticality. The ranking factor is the product of the survival time in days and the operational impact. A function with short survival time and high operational impact receives the highest-priority (lowest-number) ranking factor. For example, a function with a one-day survival time and level 1operational impact receives a ranking factor of 1. Another function with seven-day survival time and operational impact of 3 earns a ranking factor of 21.
The purpose of the ranking factor is to provide a single measure that ranks all corporate functions from highest priority to lowest priority for recovery planning purposes. The compilation of all functions listed in ascending order of ranking factor will show functions in their order of priority for disaster recovery and restoration.
The ninth column of the matrix shown in Exhibit 58.10 is the Number of Users. This column simply records the number of employees involved in each function. Note that in most cases, individual employees perform multiple functions and, therefore, will be counted as users in several functional areas. As a result, the sum of users in this column may exceed the total employees of the enterprise. This duplication is acceptable and accounted for in the detailed plans.
58.3.4.5 Category.
The tenth column is used to record the Category of the function. This column summarizes the analysis achieved through the assessment of survival time, identification of criticality, and computation of ranking factors. The category is simply a way of grouping functions with similar recovery periods. Once sorted by ranking factor in ascending order, the functions are then classified into several categories based on natural groupings.
Using heuristic techniques or more formal graphical ones, the survival times of the functions can be traced or mapped as they proceed from highest priority to lowest priority. The functions will naturally fall into groups or clusters. Often one category consists of functions requiring recovery within one to three days, which can be assigned Category I, and which form the foundation of functions requiring quick recovery. Another group, which can be assigned Category II, often consists of functions requiring recovery or resumption in one to two weeks. These are the highest-priority recovery functions, once all of the Category I items have resumed. Other categories are similarly assigned.
Exhibit 58.14 shows a sample translation of functions to a graph and the subsequent assignment of categories. Each function is represented by one “tick” mark on the horizontal axis, the x-axis. The corresponding survival time is the height, graphed on the y-axis. In the exhibit, there are four categories: Category I functions have survival periods of from 1 to 3 days. Category II functions have survival times of 7 to 14 days. Category III functions have survival times of 30 days, and Category IV have survival times of 60 days. Although there are usually more functions than those shown on the exhibit, the process is the same.
58.3.4.6 System Elements.
The twelfth and final column is really a series of columns each representing a system element. The system elements consist of hardware, software, communications systems, and operating units. The purpose of these columns is to record which functions make use of which system elements. For each function, the disaster recovery planner marks the appropriate system element used in performing that function.
Columns may correspond to hardware devices or to a functional hardware description, such as an imaging system. Major software systems may be column headings, especially for custom-built or custom-tailored software systems, such as material requirements planning (MRP) or accounting systems. Office software systems such as word processors, spreadsheets, presentation software, databases, communication software, and many other software packages may each form column headings as well. Software packages that are always installed as a group may be described that way in the column. Several system elements may constitute one functional system. For example, the time-keeping and recording function may use electronic punch clocks, communication links between the clocks and a computer, and software to translate the electronic punch clock data into time sheets. This entire system may be labeled as the time-keeping system and be consolidated into one column.
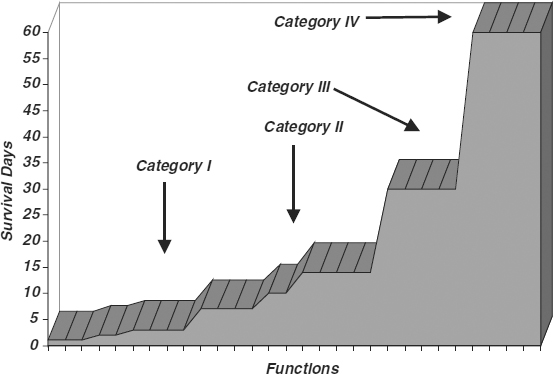
EXHIBIT 58.14 Category Assignment Curve
This column also functions as a check and balance against the defined scope of the recovery plan. If columns are necessary for systems that are out of scope, then either the scope must be changed or important statements must be made regarding the limited recovery posture for those system elements not included in the plan.
58.4 BUSINESS IMPACT ANALYSIS MATRIX ANALYSIS.
The BIA matrix forms the heart of the business impact analysis. The matrix provides the basic information needed to establish recovery requirements and timelines, and to estimate costs of outages. The matrix can be manipulated to help the recovery planner perform the analyses required for translating the business objectives defined earlier in the process into the business continuity plan objectives.
58.4.1 Listing the Functions Organizationally.
The major matrix manipulations that the planner will perform are a special set of sorts. Exhibit 58.15 shows a sample BIA matrix. This sample BIA matrix is representative of a corporate headquarters facility with some production and warehousing capabilities. The matrix shown is for illustrative purposes only and therefore is composed of only a selected subset of the columns found in an operational matrix. It also shows only a few of the many corporate functions that would normally comprise a full matrix.
This matrix is sorted alphabetically by department. Within departments, it is sorted first by survival time of functions, starting with shortest survival. When the survival time of functions is equal, functions are sorted by criticality so that the most critical functions are listed first. This matrix sort, called the organizational sort because it follows corporate structures, frequently is the first one used, and is most useful for summarizing interviews and results. This sort is also the one that is most useful when meeting with department managers, for their concerns center on their own departments.
58.4.2 Finding Cross-Department Functions.
A second useful view emphasizes similar functions across departmental boundaries. In this view, shown in Exhibit 58.16, functions that cross departments are grouped together. This matrix, which for simplicity is a subset of the matrix shown in Exhibit 58.15, provides facility for uncovering functions with similar titles performed by different departments. In the exhibit, there are three sets of functions with similar names but different departments.
The corporate accounting and human resources departments both perform functions named Benefits. However, the two departments describe the survival time and criticality of these functions very differently. Human resources considers this function a minor inconvenience with virtually no fiscal impact and an allowable downtime of more than two weeks. The accounting department tags this function with a downtime of only one day and a greater inconvenience with fiscal impact. The ranking factors of these two functions, both called Benefits, are widely different in value, showing at a glance that there is a discrepancy here. The planner must determine whether this discrepancy is the result of inconsistent descriptions, and therefore a problem, or the result of different functions with a similar name.
The other two sets of cross functions are the Payroll function, another overlap between the corporate accounting and human resources departments, and Production Scheduling, which is performed by both the materials department and customer service. In both cases, the survival time and criticality measures were assessed to be similar by both departments, with ranking factors that are close or the same.
The matrix makes apparent the existing overlaps, but the planner must determine whether the overlaps are similar, overlapping functions, or different functions with similar names. In the first example, the function named Benefits is quite different. The human resources department views this function as a regular record-keeping function with occasional changes, and it includes tracking and managing employee health plan choices, usually offered annually. Short processing delays are usually inconsequential to the enterprise and its employees. For the corporate accounting department, however, the same named function includes making matching funds payments, exercising stock options, and calculating other financial disbursements based on existing benefits packages and agreements. The functions are similarly named but different in meaning.
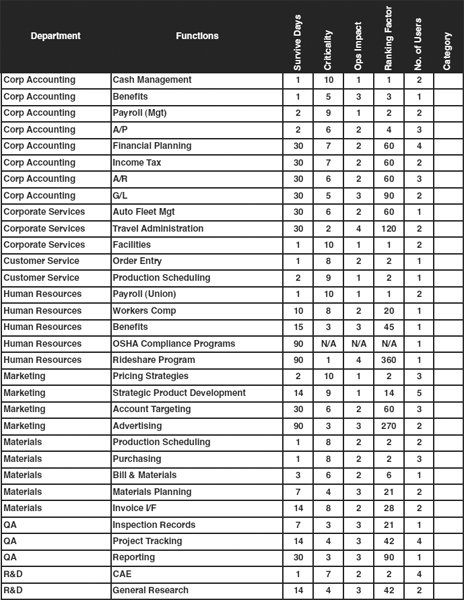
EXHIBIT 58.15 Sample BIA Matrix
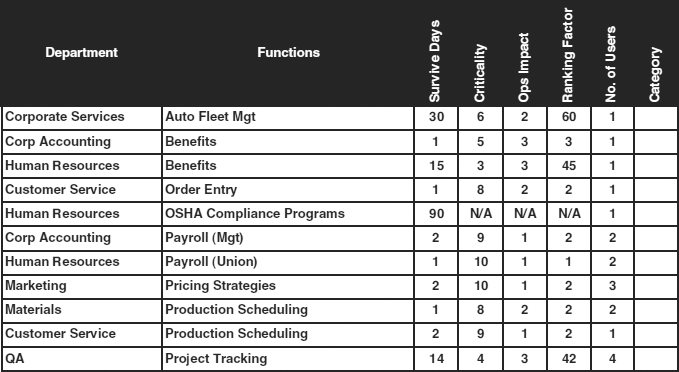
EXHIBIT 58.16 Emphasizing Cross Departmental Functions
The other two examples are similar functions with the same meanings but performed from different perspectives. Payroll for management and union personnel is performed differently due to union rules and regulations. Therefore, corporate accounting can calculate regular salaries and benefits for management employees and produce payroll checks. However, the human resources department must be involved in calculating pay for unionized, hourly employees to make certain that all rules and regulations are followed precisely.
Production Scheduling, performed by customer service and by materials, is a similar function with different perspectives. For customer service, production scheduling means setting requirements for customer deliveries and, thereby, determining production schedules. Materials finalizes the schedules to reconcile possibly conflicting production requirements for different customers by advancing or delaying schedules within corporate policy constraints.
The planner must understand the meaning of each function and recognize the differences between similarly named functions so that all recovery capabilities meet the true needs of the corporate users and customers.
58.4.3 Using the Ranking Factor.
A third view, which is the most important part of the matrix analysis, is the ranking factor view. In this sort, shown in Exhibit 58.17, functions are listed in ascending order according to their ranking factor first and then in ascending sequence according to survival days. The purpose of this view is to assign Category designations to all functions and to establish specific timelines for the categories. These timelines become the disaster recovery plan technical objectives. Exhibit 58.17 consists of the same data as the previous exhibits but sorted differently.
A useful function of the ranking factor is to list functions in a reasonable priority order for recovery timeline planning. The primary purpose of the Category designation is to group functions by recovery requirement or timeline, as a function of short-term importance to the enterprise. Therefore, the ranking factor sort is ideal for determining functional categorizations. All Category I functions for this organization must be recovered in less than 3 days. For most of these functions, the criticality is high and the survival time is low. Category II functions begin when the survival time jumps to 14 days.
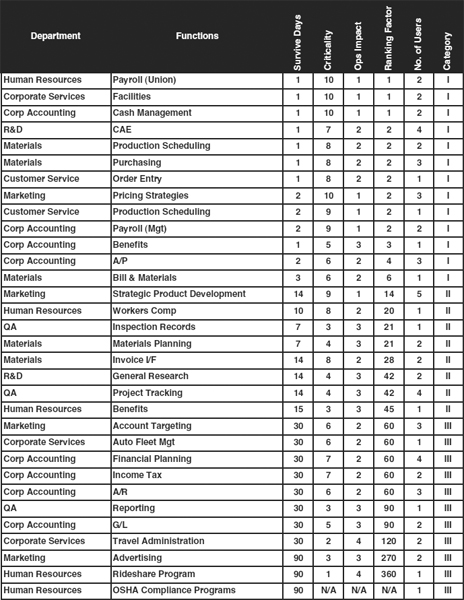
EXHIBIT 58.17 Ranking Factor View
This type of orderly grouping is not exceptional; it occurs in most organizations. The natural organizational activity is to perform functions, generally in a regular, repeating pattern. Many functions are critical and performed almost daily. Other functions are performed weekly, monthly, quarterly, or annually. The ranking factor is a good tool for viewing functions according to their natural cycle. It works because this factor measures both cycles and relative importance. Either measure alone would be insufficient. Exhibit 58.18 graphs three basic measures: survival days, operational impact, and ranking factor. This graphical representation is based on the data contained in Exhibit 58.17.
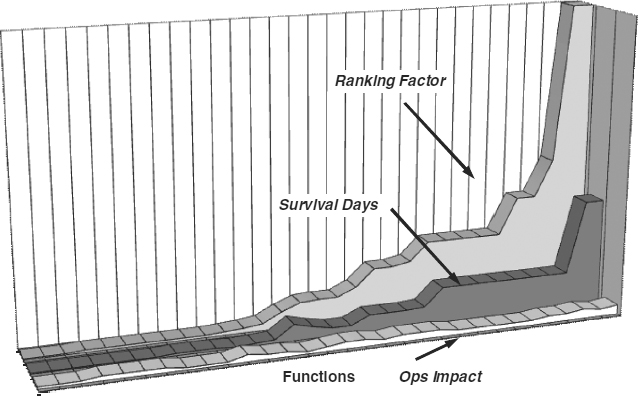
EXHIBIT 58.18 Graphing the Three Measures
Each item on the horizontal (x) axis represents one function from the matrix. The height of each of the three curves represents their numerical values. The ranking is an in-creasing curve because the data are presented according to the ranking factor view. The survival days is mostly increasing but does drop near the middle of the graph and then rises again. This dip corresponds to the two functions with 7-day survival times The rankings of the operational impact curve begin at fairly low values, corresponding to high levels of effects such as criticality 10 or 9, and end with fairly high values, corresponding to lower levels of effects which are typically less than 5 or 6. This curve rises and falls but follows a generally increasing pattern.
Sorting this information according to operational impact would not yield sufficient information upon which to base recovery timelines. Some functions with great detrimental effects only begin to have an effect after a longer time. Similarly, a simple sort of survival time may erroneously include functions as high priority whose operational impacts are too low to merit the quick recovery and expense associated with Category I functions. In both cases, the timeline would not be accurate because the sorting criteria exclude either levels of impact or time. Only the ranking factor is reliable since it reflects both time and effect simultaneously.
58.5 JUSTIFYING THE COSTS.
One of the most difficult aspects of the planning process is justifying the costs of the planning process, the reserve equipment, and the contract services. The cost justification is performed best and most efficiently using the generalized cost consequence model rather than the quantitative risk model. Both models are described in the sections that follow.
58.5.1 Quantitative Risk Model.
The quantitative risk model is a formal and rigorous methodology for analyzing expected losses that will be incurred over a predetermined time period. This procedure requires a significant amount of analysis and research. The model consists of three main factors: probability of loss, cost of loss, and annual loss expectancy (ALE). The probability of loss is really a sum of the probabilities of different catastrophic events that range from partial outages to severe interruptions. The cost of loss depends on the level of interruption. For example, a partial building loss affecting computer systems but leaving phone systems in operating condition has a much lower cost than a complete building destruction. Therefore, the cost of loss is dependent on the type of disaster.
A simplified risk model considers the probability of loss and the cost of the loss. The annual loss expectancy is the product of the probability and the cost. For example, let us assume there is a 5 percent probability (annual) of a major power failure. Stated differently, this means that the facility will experience a major power failure once in 20 years. Let us further assume that the power failure will cause a 72-hour outage, which will cost the enterprise $1,250,000. The ALE is calculated as 5% × $1,250,000, or $62,500. This number is compared to the baseline cost of the recovery plan and the cost of capital. For example, say the cost of the recovery plan is $2,000 per month and the cost of capital is $25,000. Then the baseline cost or comparison figure is (12 × $2,000) + $25,000, or $49,000. Since the comparison figure is lower than the ALE, recovery planning is justified.
There are some serious shortcomings in this simplified approach. First, the cost of the outage depends on the level of loss. A 72-hour power outage is significantly costlier than a 24-hour outage. Therefore, the ALE must reflect the difference in probabilities of different levels of impact. Another problem is defining the probability of occurrence for an aggregation of events.
The more acceptable risk model must consider the different levels of loss and sum the probabilities of all disasters that can cause that level of loss to define the true probability of loss for that loss level. This is accomplished for each loss level. First, a series of disaster events is defined. Each event is then refined into levels. For example, office buildings are susceptible to loss due to fire. Data on numbers of fires and amount of destruction (in predefined ranges) are available from various fire protection services. For a given facility, the total number of such buildings in the geographical vicinity is considered. Then the frequency or probability of a fire causing a range of damage is calculated. This calculation is performed for each defined range of damage. The level of loss for each range of damage is assessed, then the ALE is calculated for each range of damage by multiplying the probability of a fire causing that range of damage with cost of the loss if there is such a fire. All the ALE values are summed to calculate the total fire ALE. This calculation must be performed for all types of disasters that can affect the facility to determine the grand total ALE. For each level of impact for all disasters, the baseline costs also must be calculated. These figures are also summed to form a total baseline cost. The grand total ALE is then compared with this baseline cost figure.
This analysis is a complex process that requires great effort to generate and even greater patience to explain. However, there are two more important problems with the quantitative risk model.
- Calculating all the outage costs is very difficult and subject to debate. Moreover, once the cost figures are finalized, they are subject to constant change due to the changing business climate and practices.
- Calculating the probabilities is also very difficult and often requires many subjective conclusions. For example, what is the effect of modernizing the sprinkler system based on the level of damage experienced by a particular type of fire? Each countermeasure can significantly alter both the cost and the probability. Moreover, the probability of any particular event tends to be quite small, often less than 1 percent.
While the quantitative risk model is an interesting actuarial exercise, it is of marginal use in modern business continuity planning.
58.5.2 Generalized Cost Consequence Model.
The generalized cost consequence (GCC) model (developed by this author between 1990 and 1995) does not consider probabilities of specific disaster events. Instead, it estimates the total cost of outages as a function of time after an event. This model is significantly simpler than the quantitative risk model: It is easier to build and simpler to explain. The GCC estimates the cost of an outage for each function and applies that cost to the total disaster cost after the maximum allowable down time has been exceeded.
For instance, assume the cost of delaying the treasury department's bank management function is $25,000 per day after the first day. Let us also assume that the cost of delaying the law department's general contract review is $5,000 per day after seven days. For the bank management function, the cost to the enterprise is calculated as $25,000 per day beginning on the second day. For the contract review function, the cost is calculated as $5,000 per day beginning on the eighth day. Therefore, the contract review function does not contribute to loss during the first seven days. This calculation is performed for each function, and then the costs are collected by category. This category cost summary is used to develop and present a graph that shows the total cost losses for each category level once they are activated and the total for all categories over time.
A sample graph of the contribution of functions aggregated by category level is shown in Exhibit 58.19. In this example, Category I functions cause slightly more than $120,000 of loss on a daily basis once the maximum allowable downtime has been exceeded. Category II functions contribute slightly under $60,000 in this example. It is likely that different functions will commence their loss contribution at various times after the disaster event. Therefore, the true Category I loss contribution may begin at a lower level and increase to its full level. That distribution of effect will occur beginning on the first day any function exceeds its allowable downtime and continues to grow until the last day any function exceeds its downtime, at which point the effect will have achieved its full loss contribution. Since categorizations cluster functions with similar downtimes, the loss can be presented as a single, or point, value rather than as a value that varies over time.
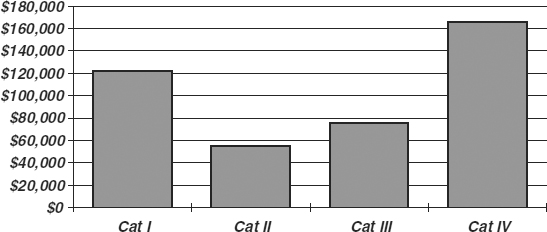
EXHIBIT 58.19 Summary of Loss Contribution
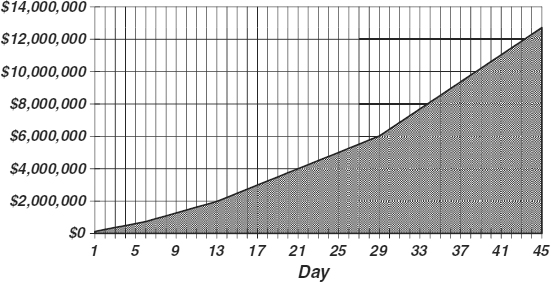
EXHIBIT 58.20 Cumulative Loss Summary
The bars indicate that Category I has a higher value than Categories II and III. Category IV is also high. The U-shape is characteristic of this graph. No matter how many categories are used, the Category I functions tend to be quite high in their contributions. The next one or two categories are lower, but increasing in values until the lowest-priority category, which tends to be quite high. This shape results from the manner of the categorizations. The Category I functions are highly critical with great effects on corporate operations. Category I functions tend to be few in number, with each function contributing significantly. The middle categories tend to be larger in number than Category I, with the number increasing with each succeeding category, although still small compared to the overall set of organizational functions. The final category tends to contain the largest number of functions, each of which contributes less on a daily basis than the Category I functions, but the sheer magnitude of this set often causes it to be the largest overall contributor to loss. Of course, Category I functions begin their effects quickly, while loss of Category IV functions may be insignificant for weeks.
Exhibit 58.20 presents a sample graph showing the accumulation of losses from all categories following a disaster. This exhibit uses the same values as in Exhibit 58.19 but presents them in a different format and represents the losses accumulated after 45 days. Neither exhibit measures physical losses such as real property, capital equipment, and the like. Physical losses are not issues that affect the planning process; they affect the cost to recover and are independent of continuation measures. The horizontal (x) axis represents the number of days since the disaster event caused damage and cessation of corporate functions. The vertical (y) axis represents the total losses the enterprise will have sustained on the corresponding day represented on the x-axis.
At the time of the disaster occurrence, no losses will have accumulated. Thereafter, the accumulated loss is increased each day by the cost contribution of the category whose earliest start time has already been surpassed. Assume that Category I functions begin to contribute to corporate losses of $120,000 on the first day, that Category II functions begin to contribute losses of $60,000 on the seventh day, and that Category III functions contribute $80,000 daily beginning on the fourteenth day. In this case, the cumulative loss begins at zero and grows by $120,000 per day for the first six days. On the seventh day, the Category II functions begin to contribute $60,000 per day along with the ongoing contribution of the Category I functions. Therefore, beginning on the seventh day, the cumulative loss grows by the sum of $120,000 and $60,000, which is $180,000 daily. On the fourteenth day, the daily loss increases by another $80,000, representing the Category III contribution. This brings the total daily loss to $240,000, which is the sum of the contributions of Categories I, II, and III.
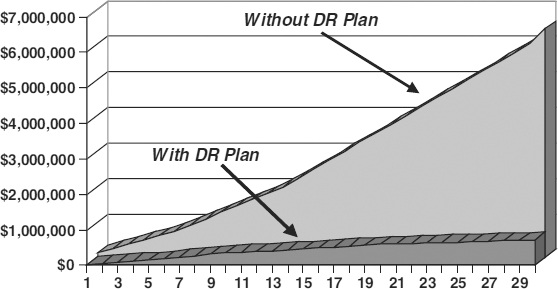
EXHIBIT 58.21 Cumulative Loss Summary With and Without Planning
The cumulative loss summary shows at a glance the loss that an enterprise will experience over time following the disaster, if no recovery planning is performed. The active simplifications of this model are the grouping of functions by category and the subsequent representation of each category as a single value beginning at a fixed point in time. This may render the estimate slightly inaccurate at some local points, but the overall values are as accurate as the underlying estimates.
The generalized cost consequence model summarizes at a glance the effects of loss of functions. These loss figures can be affected by insurance reimbursements, legal liabilities, and overall management objectives.
A second model can be developed if the recovery planning is in place, showing the residual loss proposed. That model would be developed in a similar manner but with the assumption that certain functions are restored within established time parameters. There would be residual loss only if the restoration occurs later than the allowable downtime, which will almost certainly be the case for some functions. Exhibit 58.21 presents a graph that shows cumulative losses with and without a disaster recovery plan in place. The Without Plan curve is similar to the previous exhibit. The With Plan curve reflects the residual loss that would occur even if a plan were in place. This loss is normally dramatically lower but is seldom zero. Typically, a reduction to zero residual loss would require extraordinary and prohibitively expensive measures. Most organizations can benefit more from a substantial lowering of residual losses than from a full reduction to zero losses.
The estimation process itself is much simpler than for the quantitative risk model. For each function, the loss estimate is based on three criteria, or types of losses:
- Tangible and direct losses
- Tangible and indirect losses
- Intangible losses
The tangible and direct losses are the easiest to calculate. These losses can be traced to specific revenue-producing functions. The results are direct because the loss occurs as a first-order effect, meaning that revenue stops because the function cannot be performed. The results are tangible because they can be measured easily. An example of such a function is automated production control of an assembly line. If the systems exceed their allowable downtime, then production will cease. The cost is the resultant loss of sales after inventory is depleted. Another example is loss of order entry functions. In this case, the result is similarly calculable: Lost sales after in-stock items are depleted and existing orders are produced. Tangible, direct losses include lost sales, lost manufacturing, lost deliveries, and other lost opportunities.
The tangible and indirect losses are the most common, although slightly more difficult to estimate. Support functions generally produce tangible results whose deprivation would cause a financial loss indirectly. For example, a public corporation issues quarterly earnings reports that, if late, could have significant consequences on the company's stock value. Although this is not a direct loss resulting from cessation of sales or other production, the loss can be calculated using accounting standard practices. The internal accounting personnel are in the best position to provide this estimate to the disaster recovery planner. Tangible, indirect losses include penalties, fees, fines, market share, and other issues that can be directly calculated, or at least estimated with some degree of confidence.
Intangible losses are the most difficult to calculate. The intangible effects include reduced public confidence, compromised customer satisfaction, promises not kept, damaged reputation, and other losses that are general in nature and not easily calculable. Sometimes these losses are not translated into specific financial losses and are, therefore, not represented in the cost graphs. In such cases, prominent notations should be made explaining the additional but not quantified losses.
According to a study by Contingency Planning Research in their 2001 Cost of Downtime Study, hourly losses by major companies can range from a low of $12,000 for service-oriented organizations to over $7 million for a major brokerage firm. There are no strict rules for estimating losses. The timeline can be specified in increments of days, as shown in the preceding examples. It also can be as fine as hours or minutes. Some industries, such as hospitals and other acute care facilities, must measure loss in finer increments.
The generalized cost consequence model can solve the problem of cost justification. This model shows the potential, possibly catastrophic, losses without engaging in the analysis paralysis that can stem from a detailed quantitative risk model development effort.
58.6 PLAN PRESENTATION.
The development of a business continuity plan is an involved and somewhat complex process. Though there is the simplifying technique of the generalized cost consequence model, there is still significant work required to devise and implement a workable and resilient plan.
The complexity of the development process, however, must give way to simplicity in the final plan that is presented to the enterprise. Complex analyses and detailed descriptions must give way to simple and easy-to-read flows and action plans, for even after significant training, the people responsible for carrying out the plans need simple documentation to help them along.
Exhibit 58.22 provides on example of how to present the overall recovery flow. This one diagram can form the basis for a set of sections that describes each of the specific steps to be followed. Each decision point requires information and decision guidelines; the BCP document can describe each of these steps and can provide guidance for which path to follow. In this diagram, some recovery responses have cases that further define the steps to take. In this example, the cases are parameterized by the expected outage period or the actual outage duration.
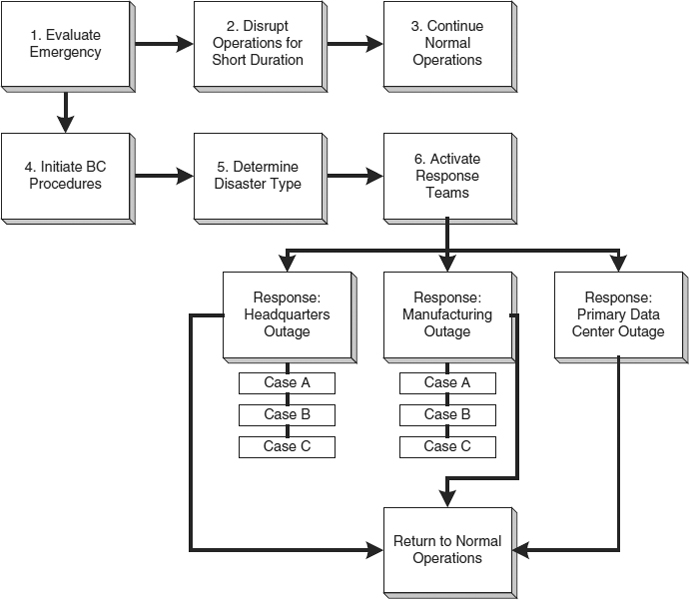
EXHIBIT 58.22 Recovery Flow
Exhibit 58.23 illustrates the meaning of the cases in the preceding exhibit. This illustration draws from the previously described concepts of function categories and lays those categories against their specific timeline requirements. The cases overlay time periods and make it clear which functions must be recovered and in which of the three cases they reside. The diagram intends to clarify that categories of functions continue across time boundaries, and new categories are activated at their designated times.
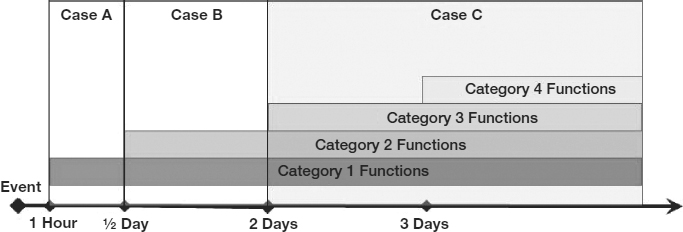
EXHIBIT 58.23 Cases and Categories
In this example, Case A represents the time period from 1 hour after an event to 1/2 day after the event. In Case A, only Category 1 functions are activated. If the event lasts longer than 1/2 day, up to 2 days, then after the 1/2-day period, the organization enters Case B and activates Category 2 functions but leaves Category 1 functions active. If the event duration is greater than 2 days, then Case C shows that Category 1 and 2 functions continue, and Category 3 and 4 functions are activated at the 2- and 3-day points.
58.7 CONCLUDING REMARKS.
This chapter has introduced a methodology for analyzing mission-critical functions in an organization and for structuring business continuity plans that reflect organizational needs and resources. Chapter 59 in this Handbook continues the discussion with details of how to recover full functionality should a disaster occur.
58.8 FURTHER READING
Barnes, J. C. Business Continuity Planning and HIPAA: Business Continuity Management in the Health Care Environment. Brookfield, CT: Rothstein Associates, 2004.
Barnes, J. C. A Guide to Business Continuity Planning. Hoboken, NJ: John Wiley & Sons, 2001.
Butler, J. G., and P. Badura. Contingency Planning and Disaster Recovery: Protecting Your Organization's Resources. Charleston, SC: Computer Technology Research Corp., 1997.
Fulmer, K. L. Business Continuity Planning: A Step-by-Step Guide with Planning Forms on CD-ROM, 3rd ed.. Brookfield, CT: Rothstein Associates, 2004.
Gregory, P., and P. J. Rothstein. IT Disaster Recovery Planning for Dummies. Hoboken, NJ: John Wiley & Sons, 2007.
Hiatt, C. J. A Primer for Disaster Recovery Planning in an IT Environment. Hershey, PA: Information Science Reference, 1999.
Hiles, A. Business Continuity: Best Practices—World-Class Business Continuity Management, 2nd ed. Brookfield, CT: Rothstein Associates, 2003.
Hiles, A. ed. The Definitive Handbook of Business Continuity Management, 2nd ed. Hoboken, NJ: John Wiley & Sons, 2008.
Myers, K. N. Manager's Guide to Contingency Planning for Disasters: Protecting Vital Facilities and Critical Operations, 2nd ed. New York: John Wiley & Sons, 1999.
Rothstein, P. J., ed. Disaster Recovery Testing: Exercising Your Contingency Plan. Brookfield, CT: Rothstein Associates, 2007.
Sayed, A., and A. Sayed. Business Continuity Planning Methodology. Mississauga, Ont.: Sentryx, 2003.
Schreider, T. Encyclopedia of Disaster Recovery, Security & Risk Management. Norcross, GA: Crucible Publishing Works, 1998.
Snedaker, S. Business Continuity and Disaster Recovery Planning for IT Professionals. Norwell, MA: Syngress, 2007.
Toigo, J. W. Disaster Recovery Planning: Preparing for the Unthinkable, 3rd ed. Englewood Cliffs, NJ: Prentice-Hall, 2002.
Wallace, M., and L. Webber. The Disaster Recovery Handbook: A Step-by-Step Plan to Ensure Business Continuity and Protect Vital Operations, Facilities, and Assets. New York: AMACOM, 2004.