2. The Return on Investments in Analytics
Keri E. Pearlson
Deciding to invest in an analytics project and then evaluating the success of that investment are complex processes. Often the decision is complicated by the complexity of the project, the time lag between the investment and the realization of benefits, and the difficulty in identifying the actual costs and actual value. However, most go/no-go decisions are made on the basis of a calculation of the return on investment (ROI), through either a formal ROI calculation or an informal assessment of the answer to the question “Will the value be greater than the investment?” The objective of this chapter is to summarize the traditional approaches to calculating ROI and then to describe a particular approach to ROI analysis used by Teradata, a provider of technologies and services including data warehousing, BI, and customer relationship management (CRM). I’ll conclude with a case study on the business justification of analytics at the semiconductor firm Freescale.
Traditional ROI Analysis
The concept of calculating the ROI is simple, but the actual process to do so can be complicated. Despite this difficulty, ROI is useful in making the business case for the initial investment and also is used after the fact to evaluate the investment. We’ll begin this chapter by looking at the traditional method of calculating ROI and some of the considerations you face when doing so for investments in analytics.
A traditional ROI would have the analyst calculate a simple equation:
When it is part of the business case, this calculation is used in two ways. First, if the result of this simple calculation is a positive number, that means the cost of the investment is less than the value received. Therefore, the investment has a positive return and is potentially a “good” investment. Likewise, if it is a negative number, it is not a good investment. The second way this calculation is used is to compare investment opportunities. ROI calculations typically are expressed as this ratio to normalize the result and provide a basis for comparison with other investment opportunities. In many organizations, this ratio must exceed a minimum level to be considered for funding in resource allocation decisions.
Let’s consider a simple example. Suppose a retail company is evaluating the potential return on the investment of an analytics project aimed at producing a more successful direct-mail campaign. The company plans to build a model of high-potential customers based on criteria selection and then mine its CRM data for these customers. Instead of sending a mailing to all customers who have spent $500 in the past year, the company will send the mailing only to customers who meet a selection of additional criteria. To build and run the model, the investment in the analytics project will cost $50,000. The expected benefit is calculated at $75,000 (you’ll read more about how this might be calculated later). Plugging these numbers into the ROI formula yields this equation:
Clearly, if a second project cost $100,000 and the expected benefit were $130,000, the ROI would be 30%.
What would we do with these ROI numbers? First, if budget permits, we might make both investments, given both are projected to return more than they cost (we know this because the ROI is positive). Alternatively, the internal budget policy might be to invest only in projects with at least a 40% return. Therefore, the first investment passed this hurdle, but the second one did not.
If we can make only one investment (perhaps the resources or the people needed to do these projects are the same and cannot do both at the same time), we could compare the investments to each other. A return of 50% is more than a return of 30%, so we might be more inclined to make the first investment. But at the same time, the actual benefit from the first investment is much less than the actual benefit from the second investment ($75,000 versus $150,000), supporting a decision to make the second investment. Given these calculations, it would take a budget committee or decision-maker to make the actual decision.
Cash Flow and ROI
In this simple example, the assumption is that the costs and benefits occur at the same time. That is rarely the case with an actual analytics project (or any business project). The ROI calculation must result from a realistic cash flow over the period of the project with the timing in mind. It’s beyond the scope of this chapter to explain this type of complex ROI calculation, but some websites have good examples, such as http://bit.ly/IIACashFlow.
Building a Credible ROI
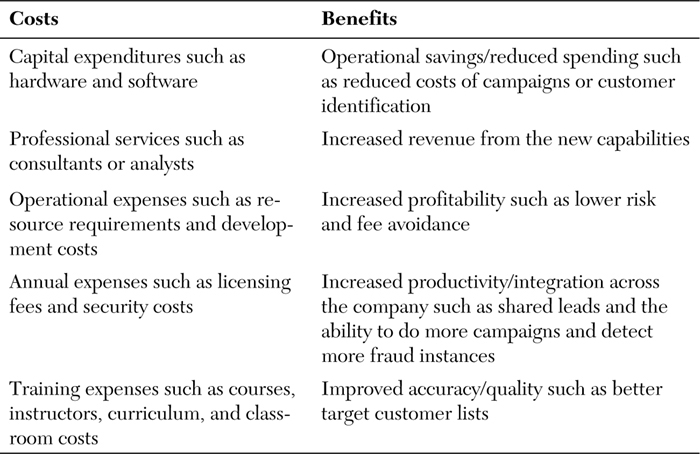
A credible ROI is based on a credible business case. Expected benefits must clearly be a result of the investment. All reasonable benefits and costs are bundled into the calculation. Table 2.1 summarizes sample components of the benefits and costs buckets.
Table 2.1. Comparing Costs and Benefits
Other Financial Metrics for Decision-Making
Business managers spend much of their time calculating financial metrics to provide input into the go/no-go decision for projects. The ROI calculation is just one metric. Some of the other common metrics include the following:
• Cost of capital is the rate of return that a company would other wise earn (at the same risk level) as the investment being analyzed. This calculation depends on the use of the funds, not the source of the funds. Cost of capital is expressed as a percentage (%).
• Net present value (NPV) is the value, in today’s currency, of a stream of cash inflows and outflows. The NPV takes into account both the cash outflows and inflows to create a net value for the investment. To calculate NPV, you factor in an inflation rate, which makes cash in the future worth a bit less than cash today. NPV is expressed in currency ($).
• Internal rate of return (IRR) is the percentage of income in a discounted cash flow analysis of the investment. This calculation takes into account the cash outflows and inflows and creates the percentage return. Decisions often examine the IRR to make sure it is more than a hurdle rate—a minimum-acceptable rate of return for the company. IRR is expressed as a percentage (%)
• Payback is the amount of time it takes for the cash inflows to equal the cash outflows. Payback normally is expressed in terms of time (months or years).
Other Considerations in Analytics ROI
A simple ROI works well when the costs and benefits are known and easily calculated and when the benefits are clearly a result of the investment. In analytics projects, however, the complexity of the actual business environment means that the inputs to the ROI calculation may not be as evident or as trustworthy as necessary to make the decision. Furthermore, it is often difficult to isolate the investment in the analytics project from the actual business opportunity, further complicating the decision to make the investment. Analytics are often used to optimize or improve the returns from another business opportunity—for example, to provide better targeting in the direct-mail example described earlier. Finally, the different functions within the organization have different priorities, which often factor into the ROI discussions.
The complexity of the business environment makes it difficult to identify the investment’s actual costs and benefits. Inputs can be loosely defined as the people, the process, and the technology necessary to complete the project. Obvious inputs include the costs of the analytics model and the analyst’s/modeler’s time. Obvious benefits are the cost savings accrued by targeting the customers who come from the application of the model to the database and the additional revenue or accuracy that results from a more targeted group. But the list of actual items to be included in the bucket of inputs can grow quickly when you consider all the resources that go into the analytics program. Some additional questions to ask might include the following:
• What portion of the costs of the IT infrastructure software and hardware are directly part of this project?
• What will it cost to prepare the data for the project (such as building a data warehouse)? What fraction of those costs should be allocated to the analytics initiative?
• What experts or analysts will be needed for this project? What is the cost of including these experts?
You also might want to ask further questions about the potential benefits of the analytical initiative:
• Could improved analytics increase the potential business value? Would additional throughput, timeliness to market, and so on offer value? Will additional revenue or customer retention result?
• What is the value of the additional efficiencies gained by this project? Is there value to a reduction in the data preparation, model development, or model deployment time? What is the value of the labor cost savings?
• Have the operating costs in the IT infrastructure (such as disk space, network, personnel needed to manage and support the efforts) been reduced?
Evaluation of the analytics investment is easily confused with investment in the business project itself because analytics and models can be integral to the business project. For example, in our hypothetical scenario of the direct-mail campaign, some costs of the targeted campaign (the mailing, the postage, the labor necessary to create the campaign) should not be charged to the analytics used to target the campaign (although the savings relative to an untargeted campaign might be credited to analytics). These costs can be a factor in the go/no-go decision about the direct-mail campaign. However, do not confuse the decision of whether to use the analytics modeling approach with the campaign decision itself. Carefully articulate the costs and benefits of both decisions to avoid this confusion. The question to ask is “How do we get value from an investment in analytics?” and not “What is the value of the analytics?” The first question is about the incremental value of the use of the models. The second question is about the overall business project.
The Teradata Method for Evaluating Analytics Investments
Teradata (an underwriter of IIA) has articulated a well-structured business value assessment process. The steps of this process are as follows:
• Phase 1: Validate business goals and document best-practice usage.
• Phase 2: Envision new capabilities.
• Phase 3: Determine ROI and present findings.
• Phase 4: Communicate.
Let’s look at each phase in a bit more detail.
Phase 1: Validate Business Goals and Document Best Practices
This phase helps uncover strategic business initiatives and documents how business leaders measure progress. Business strategies to strengthen market advantage, fix weaknesses, and position the enterprise to take advantage of market opportunities are usually based on having an infrastructure of well-managed data and analytical tools. Understanding what the business wants to achieve and how it’s doing compared to those objectives highlights areas where value can be obtained. Documenting best practices involves reviewing annual reports, strategic plans, investor presentations, corporate reports, and other shared communications. It also includes interviewing business executives and management to understand business strategy, organizational metrics, operational processes, business capabilities, and linkages between business objectives and data. The outputs of this phase are a clear picture of the current environment and the vision of the new environment from a data and analysis perspective, as well as how they impact business results.
The challenge, according to Teradata executives, is validating the financial impact of the improvements. Here are some of the key categories where this impact appears:
• Increased revenue
• Increased savings
• Reduced spending
• Increased profitability
• Business impact of increased productivity
• Business impact of improved accuracy
• Business impact of increased quality
• Fee avoidance from less risk
• Increased output
• Reduced cycle time
Participants in this assessment are senior managers from the business, the information systems organization, operational units impacted by this investment, and the finance organization, to help validate the calculations.
Phase 2: Envision New Capabilities
In this phase, new capabilities are envisioned and documented, and their potential value is calculated. Managers are encouraged to think broadly about how this infrastructure might be used beyond the business problems at hand. Here are some areas where this value hides
• The ability to answer critical business questions beyond those on the table today
• New ways to attract and keep profitable customers
• New capabilities to drive profitable customer behavior
• Identification of unprofitable activities
• Additional business processes that can be improved
Creating this vision and quantifying the benefits is often the critical step in justifying a borderline infrastructure investment. It shows additional value to the organization beyond the problems and opportunities at hand today.
Phase 3: Determine ROI and Present Findings
Creating the business case is the key activity of this next phase. For each of the business opportunities identified in Phases 1 and 2, a business case is made, articulating the financial impact and business value. The summary of all these cases, coupled with the costs of providing the service (the people, technology, and operating costs) over the term of the anticipated value, provides the data for calculating the investment’s ROI and NPV.
This business case is then shared with decision-makers and discussed to identify recommendations, concerns, additional ways to leverage the data, further improvements in processes, and implementation methods to further increase business capabilities. Furthermore, this phase of the process creates a plan to regularly assess business value to ensure that value is obtained, documented, and on track.
Phase 4: Communicate
A successful business value process includes a plan to communicate and market the results to the broader organization. The value created from analytics programs can be difficult to imagine. Skeptics abound until they are shown hard examples of the direct value from the investment. Therefore, a well-thought-out communications plan is essential to set a foundation for future value decisions. The goal of this step is to make visible, throughout the company, the value of the analytics investment and, ultimately, to fuel a culture that values data-driven decision-making.
An Example of Calculating the Value1
Teradata shared this example to help make this process more concrete. Using the business value assessment process, the client validated the IT cost savings from migrating the technology to a new system and documented business value from performance improvements and business opportunities. The client estimated that it enjoyed a 30% performance improvement, resulting in a validated savings of $10 million in IT costs over five years.
In addition, the client found that deeper analysis of more-detailed data resulted in significant performance improvement, and new opportunities resulted from improved data management. In one case, the client found a pricing opportunity that recovered $37 million of direct margin and, in another case, an additional $12 million from increased productivity. The client was able to analyze three times as many complex business issues per year as it did prior to the investment. Strategic initiatives that required the analysis of integrated data were identified that enabled the client to compete more effectively. Processes were streamlined, missing data elements were uncovered, and management work was offloaded, all enabling the company to drive revenue and profitability through new initiatives.
Know Your Audience and Proceed Carefully
In our experience, the ROI analysis typically has three audiences: the finance group, the IT group, and the business group in which the analytical investment will take place. Each has a different perspective and seeks a different angle on the issue of return on investment:
• The finance group prefers hard numbers in the calculation of cost and benefits. It takes a disciplined look at NPV, IRR, and ROI as part of a portfolio approach to investment management. It seeks to answer the question “How does this investment compare to the other investments in our portfolio?”
• The IT group tends to see a more detailed calculation of operating costs—things such as floor space, people, additional servers and disk space, support costs, and software licenses. It seeks to answer the question “What are the additional costs to our data infrastructure?”
• The business group is most interested in the project’s business value. It seeks to answer the questions “What is the return on my investment?” and “What is the business value?”
When calculating the ROI of an analytics investment, the analyst must be prepared for all three angles. The complete picture is necessary to ensure that all functions are appropriately supportive of the investment and the project. In the following example at Freescale Semiconductor, each of these groups was involved in the financial assessment of analytics investments. But in this case the finance organization was more a user of analytics than an evaluator of investments.
Analytics ROI at Freescale Semiconductor
When Sam Coursen took the reins of the IT organization at Freescale Semiconductor2 (www.freescale.com), he found an enterprise-wide data initiative under way, but at a very early stage. Having worked on a similar initiative in his previous role as chief information officer (CIO) at NCR Corporation, Coursen was able to apply lessons learned to help guide the transformation at Freescale. One of his initial top-three initiatives at Freescale was an “enterprise-wide data and analytics platform to enable faster and more informed business decision making,” according to an interview he gave to InformationWeek’s Global CIO columnist in April 2008.3 By December 2010, Coursen’s plans were well on their way to repeating the success he experienced at NCR.
Background and Context
Coursen is vice president and CIO of Freescale Semiconductor. Prior to Freescale, he was vice president and CIO at NCR, which owned Teradata at the time. While at NCR, Coursen led a seven-year journey to create a completely integrated enterprise-wide data warehouse to increase operational efficiency and facilitate better decision-making at all levels of the company. At Freescale, he created similar processes using the lessons he learned at NCR. He is on target to complete a similar transformation in a short five years.
Beginning with High-Impact Areas
The journey at Freescale began with the identification of two areas where business analytics could have a big impact. Coursen sought out places in the organization where colleagues were already interested in getting value from their data. He also sought out projects where the value was quantifiable, in part so that he could show hard value, rather than soft value, to his colleagues.
He found willing partners in finance and manufacturing. In finance, all the sales orders were recorded in one place. Although rich with data, the team was missing efficiency in analyzing and using that data. Manufacturing was ripe for analytics since analyzing end-to-end processes required one-off projects to collect information from all the plants. It could take two weeks to answer seemingly simple questions such as “What trends should we be managing across our plants?” and “We know we have a problem in our Asia plant. Do we have a similar problem in our Phoenix plant?” Similar questions that required data across processes or locations were equally difficult to answer.
Starting with these two applications, Coursen’s team identified the key objectives for investing in analytics. For manufacturing, because yields directly affected bottom-line revenue, there was a good measure of the effectiveness of the investment in analytics. The benefits in finance were harder to quantify. The time to close the books (man-hours) and similar metrics became the measures for identifying value. According to Coursen, “Some are hard benefits; others are soft. I don’t try to put a dollar amount on the soft benefits. Senior managers understand that. They appreciate that some projects have a hard ROI while others are more subjective, based on management’s judgment. Ultimately success translates into value, but making it more explicit isn’t really reasonable, and it can undermine efforts that will truly add value. I don’t do that.”
Getting Managers and Leaders Onboard
Next, Coursen’s team created a governance team. Senior-level managers from all divisions were rallied to form this team. Each group contributed at least one part-time member. The team assisted with tool selection, implementation, and promotion within their respective functional areas.
At Freescale, finance was one of the first business functions to pilot an analytics initiative. The project’s objective was to source financial data and provide value-added finance solutions. Initial areas of focus were revenue, orders, profit and loss, and operating expenses. Because the information most chief financial officers (CFOs) require was housed in different systems across most companies, little integration occurred end-to-end. In internal meetings, everyone used different numbers to build the same metrics. The first phase was to get all the data into a data warehouse so that, as the reports were circulated, everyone would see the same numbers. Phase 2 was more about predictive analytics and looking to the future. “We now have a clear picture instantaneously about what just happened end-to-end and across entities,” Coursen said. “We didn’t have that visibility before. Some of our finance colleagues think it’s magic.”
In manufacturing, early initiatives included a factory data consolidation project and a corporate yield dashboard. These initiatives were chosen because the data was available locally, but not centrally, across factories and because it was directly related to the bottom line, so ROI was relatively easy to calculate. According to Coursen, “We wanted to know how to increase yield from a batch of silicon chips we produced. But we couldn’t see end-to-end, so we couldn’t improve the process as effectively.”
The manufacturing organization audited actual savings and the incidents of savings on an ongoing basis. They recorded the real value they found on a monthly basis, rather than having the analytics group document savings. They found that it saved engineers a significant amount of time and gave capacity for things that couldn’t be done in the past.
Manufacturing told this story, not IT or the analytics group, and that added credibility to the investment. In fact, Freescale won several awards for this initiative. One was the Progressive Manufacturer of the Year High Achiever Award for 2010 from Managing Automation, an industry magazine. Freescale won this award for its Advanced Intelligent Manufacturing (AIM) project, which used advanced IT to significantly improve manufacturing efficiency. A key piece of the AIM project was its analytics capabilities. According to Managing Automation, the investment at the time was $39.9 million, and the ROI was reported to be $103 million. Since its implementation, the return has been much higher.
Coursen commented on his strategy of piloting to build momentum: “I could tell after a couple of years that my colleagues were onboard. No one wanted the analytics engine to go down. Everyone wanted to be next in line for development of a new application. We never talked about how long the journey was. We just moved along incrementally. We started with something doable and valuable. Then we leveraged that success into other areas.”
Incremental Growth
At Freescale, the enterprise business intelligence capability grew incrementally. Figure 2.1 shows the rate of growth in various activities. It progresses from the start of the rehosting of the data, to a data warehouse, to the implementation of a procurement application in the fourth quarter of 2008.
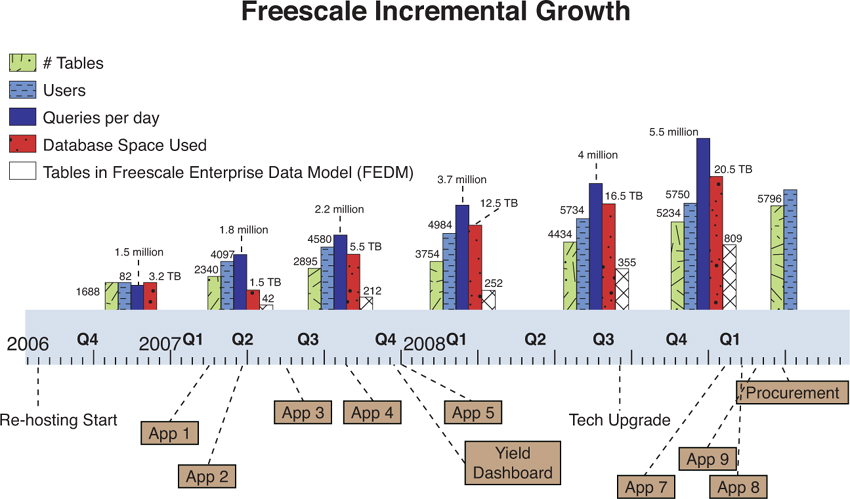
Figure 2.1. Freescale incremental growth.
Lessons Learned
As finance and manufacturing saw success from the analytics projects, word spread quickly across the enterprise, and soon the analytics group was being asked to create applications for other organizations. Here are some of the lessons learned from this experience:
• The sequencing of initial projects is important. Start with the high ROI project, not with the low or hard-to-quantify one. The first project normally bears the biggest cost because the start-up usually involves setting up the data warehouse. If it can be done with a large ROI project, future projects are much easier to justify because they have to cover only the incremental costs, such as additional data files.
• Pick an initial project that has a big pull, where information is scattered all over and a compelling, hard ROI can be calculated. For example, procurement is a good candidate. Global purchasing is impossible without a clear picture of what is being bought all over the world. When that picture is clear, better prices can be obtained from global suppliers. Applying analytics in the sales function can be soft. Everyone will agree that knowing the customer better is an important objective, but quantifying it is very difficult. Improvements in the supply chain, procurement, and service delivery are more easily quantifiable than better customer satisfaction and better decision-making. Cost is quantifiable, but benefits are not always quantifiable.
• Componentize the analytics investment as much as possible. At Freescale, Coursen didn’t want to ask for the investment necessary to do the entire enterprise model at the beginning. Instead, he started with a request for funding for the first piece—the pilots for the finance and manufacturing functions. Then, as the requests snowballed, he was able to justify additional investments with the projects that would use the analytics assets.
• Get good first-use cases, and share them widely to build momentum. At Freescale, Coursen started with finance and manufacturing, in part because their leaders were willing participants and in part because they had low-hanging fruit that could produce well-accepted ROI. At NCR, Coursen used a similar strategy, starting with services, which directly benefited customers and therefore was a high-visibility application. An early application of analytics capabilities increased the quality of services; it would save some money and increase revenue. It was a conservative estimate and therefore believable, and it turned into an excellent use case that quickly spread across the company.
• Don’t expect an enterprise-wide business analytics program to happen overnight; it takes time. At NCR, the enterprise business intelligence program took seven years to become a well-accepted part of the business. At Freescale, it’s taking about five years.
• The leadership team sets the tone, but heavy client involvement makes it a success. IT should not go off in a corner and develop the solution. Every project needs a champion in the function. The leadership team at Freescale insisted on process improvements, standardization, and simplification, in addition to automation and system changes, making this a broader program than just analytics. But requirements definitions, design reviews, testing, and postmortems were done with heavy business-partner involvement, which increased value and quickened adoption.
Endnotes
1. The source of this example is the Teradata whitepaper titled “The Teradata Approach to Assessing the Business Value of Data Warehousing and Analytics Investments,” by Corinna Gilbert, Teradata Corporation, 2008. Used here with permission of Teradata.
2. More details on the Freescale example are available at these websites: www.cio.com/article/print/152450 http://shashwatdc.blogspot.com/2007/07/sam-coursens-interview.html www.freescale.com/webapp/sps/site/homepage.jsp?code=COMPANY_INFO_HOME&tid=FSH.
3. Source: www.informationweek.com/news/global-cio/interviews/showArticle.jhtml?articleID=207400183.