Chapter 1
Distribution System Planning and Automation
To fail to plan is to plan to fail.
A. E. Gasgoigne, 1985
Those who know how can always get a job, but those who know why, may be your boss!
Author Unknown
To make an end is to make a beginning. The end is where we start from.
T. S. Eliot
1.1 Introduction
The electric utility industry was born in 1882 when the first electric power station, Pearl Street Electric Station in New York City, went into operation. The electric utility industry grew very rapidly, and generation stations and transmission and distribution networks have spread across the entire country. Considering the energy needs and available fuels that are forecasted for the next century, energy is expected to be increasingly converted to electricity.
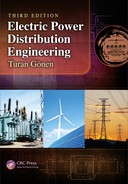
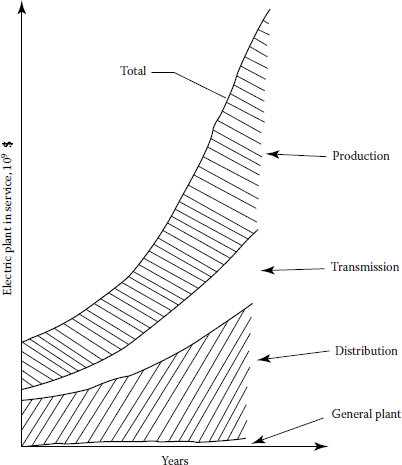
In general, the definition of an electric power system includes a generating, a transmission, and a distribution system. In the past, the distribution system, on a national average, was estimated to be roughly equal in capital investment to the generation facilities, and together they represented over 80% of the total system investment [1]. In recent years, however, these figures have somewhat changed. For example, Figure 1.1 shows the investment trends in electric utility plants in service. The data represent the privately owned class A and class B utilities, which include 80% of all the electric utility in the United States. The percentage of electric plants represented by the production (i. e., generation), transmission, distribution, and general plant sector is shown in Figure 1.2. The major investment has been in the production sector, with distribution a close second. Where expenditures for individual generation facilities are visible and receive attention due to their magnitude, the data indicate the significant investment in the distribution sector.

Production expense is the major factor in the total electrical operation and maintenance (O&M) expenses, which typically represents two-thirds of total O&M expenses. The main reason for the increase has been rapidly escalating fuel costs. Figure 1.3 shows trends in the ratio of maintenance expenses to the value of plant in service for each utility sector, namely, generation, transmission, and distribution. Again, the major O&M expense has been in the production sector, followed by the one for the distribution sector.
Typical ratio of maintenance expenses to plant in service for each utility sector. The data are for privately owned class A and class B electric utilities.
Succinctly put, the economic importance of the distribution system is very high, and the amount of investment involved dictates careful planning, design, construction, and operation.
1.2 Distribution System Planning
System planning is essential to assure that the growing demand for electricity can be satisfied by distribution system additions that are both technically adequate and reasonably economical. Even though considerable work has been done in the past on the application of some types of systematic approach to generation and transmission system planning, its application to distribution system planning has unfortunately been somewhat neglected. In the future, more than in the past, electric utilities will need a fast and economical planning tool to evaluate the consequences of different proposed alternatives and their impact on the rest of the system to provide the necessary economical, reliable, and safe electric energy to consumers.
The objective of distribution system planning is to assure that the growing demand for electricity, in terms of increasing growth rates and high load densities, can be satisfied in an optimum way by additional distribution systems, from the secondary conductors through the bulk power substations, which are both technically adequate and reasonably economical. All these factors and others, for example, the scarcity of available land in urban areas and ecological considerations, can put the problem of optimal distribution system planning beyond the resolving power of the unaided human mind.
Distribution system planners must determine the load magnitude and its geographic location. Then the distribution substations must be placed and sized in such a way as to serve the load at maximum cost effectiveness by minimizing feeder losses and construction costs, while considering the constraints of service reliability.
In the past, the planning for other portions of the electric power supply system and distribution system frequently has been authorized at the company division level without the review of or coordination with long-range plans. As a result of the increasing cost of energy, equipment, and labor, improved system planning through use of efficient planning methods and techniques is inevitable and necessary.
The distribution system is particularly important to an electrical utility for two reasons: (1) its close proximity to the ultimate customer and (2) its high investment cost. Since the distribution system of a power supply system is the closest one to the customer, its failures affect customer service more directly than, for example, failures on the transmission and generating systems, which usually do not cause customer service interruptions.
Therefore, distribution system planning starts at the customer level. The demand, type, load factor, and other customer load characteristics dictate the type of distribution system required. Once the customer loads are determined, they are grouped for service from secondary lines connected to distribution transformers that step down from primary voltage.
The distribution transformer loads are then combined to determine the demands on the primary distribution system. The primary distribution system loads are then assigned to substations that step down from transmission voltage. The distribution system loads, in turn, determine the size and location, or siting, of the substations as well as the routing and capacity of the associated transmission lines. In other words, each step in the process provides input for the step that follows.
The distribution system planner partitions the total distribution system planning problem into a set of subproblems that can be handled by using available, usually ad hoc, methods and techniques. The planner, in the absence of accepted planning techniques, may restate the problem as an attempt to minimize the cost of subtransmission, substations, feeders, laterals, etc., and the cost of losses. In this process, however, the planner is usually restricted by permissible voltage values, voltage dips, flicker, etc., as well as service continuity and reliability. In pursuing these objectives, the planner ultimately has a significant influence on additions to and/or modifications of the subtransmission network, locations and sizes of substations, service areas of substations, location of breakers and switches, sizes of feeders and laterals, voltage levels and voltage drops in the system, the location of capacitors and voltage regulators, and the loading of transformers and feeders.
There are, of course, some other factors that need to be considered such as transformer impedance, insulation levels, availability of spare transformers and mobile substations, dispatch of generation, and the rates that are charged to the customers.
Furthermore, there are factors over which the distribution system planner has no influence but which, nevertheless, have to be considered in good long-range distribution system planning, for example, the timing and location of energy demands; the duration and frequency of outages; the cost of equipment, labor, and money; increasing fuel costs; increasing or decreasing prices of alternative energy sources; changing socioeconomic conditions and trends such as the growing demand for goods and services; unexpected local population growth or decline; changing public behavior as a result of technological changes; energy conservation; changing environmental concerns of the public; changing economic conditions such as a decrease or increase in gross national product (GNP) projections, inflation, and/or recession; and regulations of federal, state, and local governments.
1.3 Factors Affecting System Planning
The number and complexity of the considerations affecting system planning appear initially to be staggering. Demands for ever-increasing power capacity, higher distribution voltages, more automation, and greater control sophistication constitute only the beginning of a list of such factors. The constraints that circumscribe the designer have also become more onerous. These include a scarcity of available land in urban areas, ecological considerations, limitations on fuel choices, the undesirability of rate increases, and the necessity to minimize investments, carrying charges, and production charges.
Succinctly put, the planning problem is an attempt to minimize the cost of subtransmission, substations, feeders, laterals, etc., as well as the cost of losses. Indeed, this collection of requirements and constraints has put the problem of optimal distribution system planning beyond the resolving power of the unaided human mind.
1.3.1 Load Forecasting
The load growth of the geographic area served by a utility company is the most important factor influencing the expansion of the distribution system. Therefore, forecasting of load increases and system reaction to these increases is essential to the planning process. There are two common time scales of importance to load forecasting: long range, with time horizons on the order of 15 or 20 years away, and short range, with time horizons of up to 5 years distant. Ideally, these forecasts would predict future loads in detail, extending even to the individual customer level, but in practice, much less resolution is sought or required.
Figure 1.4 indicates some of the factors that influence the load forecast. As one would expect, load growth is very much dependent on the community and its development. Economic indicators, demographic data, and official land use plans all serve as raw input to the forecast procedure. Output from the forecast is in the form of load densities (kilovoltamperes per unit area) for longrange forecasts. Short-range forecasts may require greater detail.

Densities are associated with a coordinate grid for the area of interest. The grid data are then available to aid configuration design. The master grid presents the load forecasting data, and it provides a useful planning tool for checking all geographic locations and taking the necessary actions to accommodate the system expansion patterns.
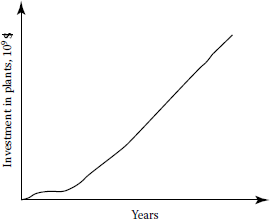
1.3.2 Substation Expansion
Figure 1.5 presents some of the factors affecting the substation expansion. The planner makes a decision based on tangible or intangible information. For example, the forecasted load, load density, and load growth may require a substation expansion or a new substation construction. In the system expansion plan, the present system configuration, capacity, and the forecasted loads can play major roles.
1.3.3 Substation Site Selection
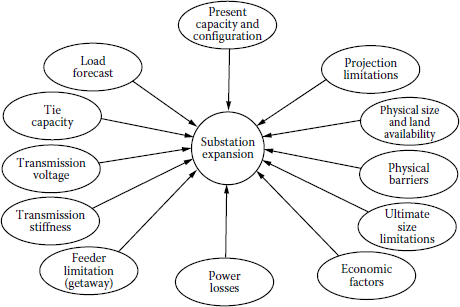
Figure 1.6 shows the factors that affect substation site selection. The distance from the load centers and from the existing subtransmission lines as well as other limitations, such as availability of land, its cost, and land use regulations, is important.

The substation siting process can be described as a screening procedure through which all possible locations for a site are passed, as indicated in Figure 1.7. The service region is the area under evaluation. It may be defined as the service territory of the utility. An initial screening is applied by using a set of considerations, for example, safety, engineering, system planning, institutional, economics, and aesthetics. This stage of the site selection mainly indicates the areas that are unsuitable for site development.

Thus the service region is screened down to a set of candidate sites for substation construction. Further, the candidate sites are categorized into three basic groups: (1) sites that are unsuitable for development in the foreseeable future, (2) sites that have some promise but are not selected for detailed evaluation during the planning cycle, and (3) candidate sites that are to be studied in more detail.
The emphasis put on each consideration changes from level to level and from utility to utility. Three basic alternative uses of the considerations are (1) quantitative vs. qualitative evaluation, (2) adverse vs. beneficial effects evaluation, and (3) absolute vs. relative scaling of effects. A complete site assessment should use a mix of all alternatives and attempt to treat the evaluation from a variety of perspectives.
1.3.4 Other Factors
Once the load assignments to the substations are determined, then the remaining factors affecting primary voltage selection, feeder route selection, number of feeders, conductor size selection, and total cost, as shown in Figure 1.8, need to be considered.

In general, the subtransmission and distribution system voltage levels are determined by company policies, and they are unlikely to be subject to change at the whim of the planning engineer unless the planner’s argument can be supported by running test cases to show substantial benefits that can be achieved by selecting different voltage levels.
Further, because of the standardization and economy that are involved, the designer may not have much freedom in choosing the necessary sizes and types of capacity equipment. For example, the designer may have to choose a distribution transformer out of a fixed list of transformers that are presently stocked by the company for the voltage levels that are already established by the company. Any decision regarding the addition of a feeder or adding on to an existing feeder will, within limits, depend on the adequacy of the existing system and the size, location, and timing of the additional loads that need to be served.
1.4 Present Distribution System Planning Techniques
Today, many electric distribution system planners in the industry utilize computer programs, usually based on ad hoc techniques, such as load flow programs, radial or loop load flow programs, short-circuit and fault-current calculation programs, voltage drop calculation programs, and total system impedance calculation programs, as well as other tools such as load forecasting, voltage regulation, regulator setting, capacitor planning, reliability, and optimal siting and sizing algorithms.
However, in general, the overall concept of using the output of each program as input for the next program is not in use. Of course, the computers do perform calculations more expeditiously than other methods and free the distribution engineer from detailed work. The engineer can then spend time reviewing results of the calculations, rather than actually making them.
Nevertheless, there is no substitute for engineering judgment based on adequate planning at every stage of the development of power systems, regardless of how calculations are made. In general, the use of the aforementioned tools and their bearing on the system design is based purely on the discretion of the planner and overall company operating policy.
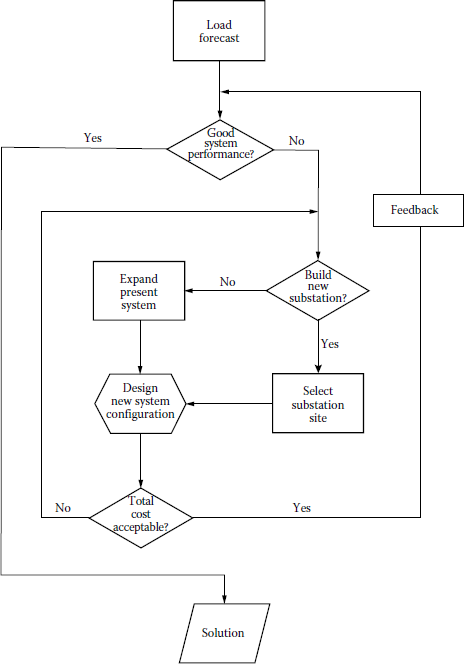
Figure 1.9 shows a functional block diagram of the distribution system planning process currently followed by most of the utilities. This process is repeated for each year of a long-range (15–20 years) planning period. In the development of this diagram, no attempt was made to represent the planning procedure of any specific company but rather to provide an outline of a typical planning process. As the diagram shows, the planning procedure consists of four major activities: load forecasting, distribution system configuration design, substation expansion, and substation site selection.
Configuration design starts at the customer level. The demand type, load factor, and other customer load characteristics dictate the type of distribution system required. Once customer loads are determined, secondary lines are defined, which connect to distribution transformers. The latter provides the reduction from primary voltage to customer-level voltage.
The distribution transformer loads are then combined to determine the demands on the primary distribution system. The primary distribution system loads are then assigned to substations that step down from subtransmission voltage. The distribution system loads, in turn, determine the size and location (siting) of the substations as well as the route and capacity of the associated subtransmission lines. It is clear that each step in this planning process provides input for the steps that follow.
Perhaps what is not clear is that in practice, such a straightforward procedure may be impossible to follow. A much more common procedure is the following. Upon receiving the relevant load projection data, a system performance analysis is done to determine whether the present system is capable of handling the new load increase with respect to the company’s criteria. This analysis, constituting the second stage of the process, requires the use of tools such as a distribution load flow program, a voltage profile, and a regulation program. The acceptability criteria, representing the company’s policies, obligations to the consumers, and additional constraints, can include
- Service continuity
- The maximum allowable peak-load voltage drop to the most remote customer on the secondary
- The maximum allowable voltage dip occasioned by the starting of a motor of specified starting current characteristics at the most remote point on the secondary
- The maximum allowable peak load
- Service reliability
- Power losses
As illustrated in Figure 1.9, if the results of the performance analysis indicate that the present system is not adequate to meet future demand, then either the present system needs to be expanded by new, relatively minor, system additions, or a new substation may need to be built to meet the future demand. If the decision is to expand the present system with minor additions, then a new additional network configuration is designed and analyzed for adequacy.
If the new configuration is found to be inadequate, another is tried, and so on, until a satisfactory one is found. The cost of each configuration is calculated. If the cost is found to be too high, or adequate performance cannot be achieved, then the original expand-or-build decision is reevaluated.
If the resulting decision is to build a new substation, a new placement site must be selected. Further, if the purchase price of the selected site is too high, the expand-or-build decision may need further reevaluation. This process terminates when a satisfactory configuration is attained, which provides a solution to existing or future problems at a reasonable cost. Many of the steps in the earlier procedures can feasibly be done only with the aid of computer programs.
1.5 Distribution System Planning Models
In general, distribution system planning dictates a complex procedure due to a large number of variables involved and the difficult task of the mathematical presentation of numerous requirements and limitations specified by system configuration.
Therefore, mathematical models are developed to represent the system and can be employed by distribution system planners to investigate and determine optimum expansion patterns or alternatives, for example, by selecting
- Optimum substation locations
- Optimum substation expansions
- Optimum substation transformer sizes
- Optimum load transfers between substations and demand centers
- Optimum feeder routes and sizes to supply the given loads subject to numerous constraints to minimize the present worth of the total costs involved
Some of the operations research techniques used in performing this task include
- The alternative-policy method, by which a few alternative policies are compared and the best one is selected
- The decomposition method, in which a large problem is subdivided into several small problems and each one is solved separately
- The linear-programming, integer-programming, and mixed-integer programming methods that linearize constraint conditions
- The quadratic programming method
- The dynamic-programming method
- Genetic algorithms method
Each of these techniques has its own advantages and disadvantages. Especially in long-range planning, a great number of variables are involved, and thus there can be a number of feasible alternative plans that make the selection of the optimum alternative a very difficult one [7].
The distribution system costs of an electric utility company can account for up to 60% of investment budget and 20% of operating costs, making it a significant expense [10]. Minimizing the cost of distribution system can be a considerable challenge, as the feeder system associated with only a single substation may present a distribution engineer with thousands of feasible design options from which to choose. For example, the actual number of possible plans for a 40-node distribution system is over 15 million, with the number of feasible designs being in about 20,000 variations.
Finding the overall least cost plan for the distribution system associated with several neighboring substations can be a truly intimidating task. The use of computer-aided tools that help identify the lowest cost distribution configuration has been a focus of much R&D work in the last three decades. As a result, today a number of computerized optimization programs can be used as tools to find the best design from among those many possibilities. Such programs never consider all aspects of the problem, and most include approximations that slightly limit accuracy. However, they can help to deduce distribution costs even with the most conservative estimate by 5%–10%, which is more than enough reason to use them [10].
Expansion studies of a distribution system have been done in practice by planning engineers. The studies were based on the existing system, forecasts of power demands, extensive economic and electrical calculations, and planner’s past experience and engineering judgment. However, the development of more involved studies with a large number of alternating projects using mathematical models and computational optimization techniques can improve the traditional solutions that were achieved by the planners. As expansion costs are usually very large, such improvements of solutions represent valuable savings.
For a given distribution system, the present level of electric power demand is known and the future levels can be forecasted by one stage, for example, 1 year, or several stages. Therefore, the problem is to plan the expansion of the distribution system (in one or several stages, depending on data availability and company policy) to meet the demand at minimum expansion cost. In the early applications, the overall distribution system planning problem has been dealt with by dividing it into the following two subproblems that are solved successfully:
- The subproblem of the optimal sizing and/or location of distribution substations. In some approaches, the corresponding mathematical formulation has taken into account the present feeder network either in terms of load transfer capability between service areas or in terms of load times distance. What is needed is the full representation of individual feeder segments, that is, the network itself.
- The subproblem of the optimal sizing and/or locating feeders. Such models take into account the full representation of the feeder network but without taking into account the former subproblem.
However, there are more complex mathematical models that take into account the distribution planning problem as a global problem and solving it by considering minimization of feeder and substation costs simultaneously. Such models may provide the optimal solutions for a single planning stage. The complexity of the mathematical problems and the process of resolution become more difficult because the decisions for building substations and feeders in one of the planning stages have an influence on such decisions in the remaining stages.
1.5.1 Computer Applications
Today, there are various innovative algorithms based on optimization programs that have been developed based on the earlier fundamental operations research techniques. For example, one such distribution design optimization program now in use at over 25 utilities in the United States. It works within an integrated Unix or Windows NT graphical user interface (GUI) environment with a single open SQL circuit database that supports circuit analysis, various equipment selection optimization routes such as capacitor-regulator sizing and locating, and a constrained linear optimization algorithm for the determination of multifeeder configurations.
The key features include a database, editor, display, and GUI structure specifically designed to support optimization applications in augmentation planning and switching studies. This program uses a linear trans-shipment algorithm in addition to a postoptimization radialization. For the program, a linear algorithm methodology was selected over nonlinear methods even though it is not the best in applications involving augmentation planning and switching studies.
The reasons for this section include its stability in use in terms of consistently converging performance, its large problem capacity, and reasonable computational requirements. Using this package, a system of 10,000 segments/potential segments, which at a typical 200 segments per feeder means roughly 8 substation service areas, can be optimized in one analysis on a DEC 3000/600 with 64 Mbyte RAM in about 1 min [10]. From the application point of view, distribution system planning can be categorized as (1) new system expansion, (2) augmentation of existing system, and (3) operational planning.
1.5.2 New Expansion Planning
It is the easiest of the earlier-provided three categories to optimize. It has received the most attention in the technical literature partially due to its large capital and land requirements. It can be envisioned as the distribution expansion planning for the growing periphery of a thriving city. Willis et al. [10] names such planning greenfield planning due to the fact that the planner starts with essentially nothing, or greenfield, and plans a completely new system based on the development of a region. In such planning problem, obviously there are a vast range of possibilities for the new design.
Luckily, optimization algorithms can apply a clever linearization that shortens computational times and allows large problem size, at the same time introducing only a slight approximation error. In such linearization, each segment in the potential system is represented with only two values, namely, a linear cost vs. kVA slope based on segment length, and a capacity limit that constrains its maximum loading. This approach has provided very satisfactory results since 1070s. According to Willis et al. [10], more than 60 utilities in this country alone use this method routinely in the layout of major new distribution additions today. Economic savings as large as 19% in comparison to good manual design practices have been reported in IEEE and Electric Power Research Institute (EPRI) publications.
1.5.3 Augmentation and Upgrades
Much more often than a greenfield planning, a distribution planner faces the problem of economical upgrade of a distribution system that is already in existence. For example, in a well-established neighborhood where a slowly growing load indicates that the existing system will be overloaded pretty soon.
Even though such planning may be seen as much easier than the greenfield planning, in reality, this perception is not true for two reasons. First of all, new routes, equipment sites, and permitted upgrades of existing equipment are very limited due to practical, operational, aesthetic, environmental, or community reasons. Here, the challenge is the balancing of the numerous unique constraints and local variations in options. Second, when an existing system is in place, the options for upgrading existing lines generally cannot be linearized. Nevertheless, optimization programs have long been applied to augmentation planning partially due to the absence of better tools. Such applications may reduce costs in augmentation planning approximately by 5% [10].
As discussed in Section 7.5, fixed and variable costs of each circuit element should be included in such studies. For example, the cost for each feeder size should include (1) investment cost of each of the installed feeder and (2) cost of energy lost due to I2R losses in the feeder conductors. It is also possible to include the cost of demand lost, that is, the cost of useful system capacity lost (i. e., the demand cost incurred to maintain adequate and additional system capacity to supply I2R losses in feeder conductors) into such calculations.
1.5.4 Operational Planning
It determines the actual switching pattern for operation of an already-built system, usually for the purpose of meeting the voltage drop criterion and loading while having minimum losses. Here, contrary to the other two planning approaches, the only choice is switching. The optimization involved is the minimization of I2R losses while meeting properly the loading and operational restrictions. In the last two decades, a piecewise linearization-type approximation has been effectively used in a number of optimization applications, providing good results.
However, operational planning in terms of determining switching patterns has very little effect if any on the initial investment decisions on ether feeder routes and/or substation locations. Once the investment decisions are made, then the costs involved become fixed investment costs. Any switching activities that take place later on in the operational phase only affect the minimization of losses.
1.5.5 Benefits of Optimization Applications
Furthermore, according to Ramirez-Rosado and Gönen [11], the optimal solution is the same when the problem is resolved considering only the costs of investment and energy loses, as expected having a lower total costs. In addition, they have shown that the problem can successfully be resolved considering only investment costs. For example, one of their studies involving multistage planning has shown that the optimal network structure is almost the same as before, with the exception of building a particular feeder until the fourth year. Only a slight influence of not including the cost of energy losses is observed in the optimal network structure evolved in terms of delay in building a feeder.
It can easily be said that cost reduction is the primary justification for application of optimization. According to Willis et al. [10], a nonlinear optimization algorithm would improve average savings in augmentation planning to about the same level as those of greenfield results. However, this is definitely not the case with switching. For example, tests using a nonlinear optimization have shown that potential savings in augmentation planning are generally only a fourth to a third as much as in greenfield studies.
Also, a linear optimization delivers on the order of 85% of savings achievable using nonlinear analysis. An additional benefit of optimization efforts is that it greatly enhances the understanding of the system in terms of the interdependence between costs, performance, and tradeoffs. Willis et al. [10] report that in a single analysis that lasted less than a minute, the optimization program results have identified the key problems to savings and quantified how it interacts with other aspects of the problems and indicated further cost reduction possibilities.
1.6 Distribution System Planning in the Future
In the previous sections, some of the past and present techniques used by the planning engineers of the utility industry in performing the distribution system planning have been discussed. Also, the factors affecting the distribution system planning decisions have been reviewed. Furthermore, the need for a systematic approach to distribution planning has been emphasized.
The following sections examine what today’s trends are likely to portend for the future of the planning process.
1.6.1 Economic Factors
There are several economic factors that will have significant effects on distribution planning in the 1980s. The first of these is inflation. Fueled by energy shortages, energy source conversion cost, environmental concerns, and government deficits, inflation will continue to be a major factor.
The second important economic factor will be the increasing expense of acquiring capital. As long as inflation continues to decrease the real value of the dollar, attempts will be made by government to reduce the money supply. This in turn will increase the competition for attracting the capital necessary for expansions in distribution systems.
The third factor that must be considered is increasing difficulty in raising customer rates. This rate increase “inertia” also stems in part from inflation as well as from the results of customers being made more sensitive to rate increases by consumer activist groups.
1.6.2 Demographic Factors
Important demographic developments will affect distribution system planning in the near future. The first of these is a trend that has been dominant over the last 50 years: the movement of the population from the rural areas to the metropolitan areas.
The forces that initially drove this migration—economic in nature—are still at work. The number of single-family farms has continuously declined during this century, and there are no visible trends that would reverse this population flow into the larger urban areas. As population leaves the countrysides, population must also leave the smaller towns that depend on the countrysides for economic life. This trend has been a consideration of distribution planners for years and represents no new effect for which account must be taken.
However, the migration from the suburbs to the urban and near-urban areas is a new trend attributable to the energy crisis. This trend is just beginning to be visible, and it will result in an increase in multifamily dwellings in areas that already have high population densities.
1.6.3 Technological Factors
The final class of factors, which will be important to the distribution system planner, has arisen from technological advances that have been encouraged by the energy crisis. The first of these is the improvement in fuel cell technology. The output power of such devices has risen to the point where in the areas with high population density, large banks of fuel cells could supply significant amounts of the total power requirements.
Other nonconventional energy sources that might be a part of the total energy grid could appear at the customer level. Among the possible candidates would be solar and wind-driven generators. There is some pressure from consumer groups to force utilities to accept any surplus energy from these sources for use in the total distribution network. If this trend becomes important, it would change drastically the entire nature of the distribution system as it is known today.
1.7 Future Nature of Distribution Planning
Predictions about the future methods for distribution planning must necessarily be extrapolations of present methods. Basic algorithms for network analysis have been known for years and are not likely to be improved upon in the near future.
However, the superstructure that supports these algorithms and the problem-solving environment used by the system designer is expected to change significantly to take advantage of new methods that technology has made possible. Before giving a detailed discussion of these expected changes, the changing role of distribution planning needs to be examined.
1.7.1 Increasing Importance of Good Planning
For the economic reasons listed earlier, distribution systems will become more expensive to build, expand, and modify. Thus, it is particularly important that each distribution system design be as cost effective as possible. This means that the system must be optimal from many points of view over the time period from the 1st day of operation to the planning-time horizon.
In addition to the accurate load growth estimates, components must be phased in and out of the system so as to minimize capital expenditure, meet performance goals, and minimize losses. These requirements need to be met at a time when demographic trends are veering away from what have been their norms for many years in the past and when distribution systems are becoming more complex in design due to the appearance of more active components (e. g., fuel cells) instead of the conventional passive ones.
1.7.2 Impacts of Load Management (or Demand-Side Management)
In the past, the power utility companies of this nation supplied electric energy to meet all customer demands when demands occurred. Recently, however, because of the financial constraints (i. e., high cost of labor, materials, and interest rates), environmental concerns, and the recent shortage (or high cost) of fuels, this basic philosophy has been reexamined and customer load management investigated as an alternative to capacity expansion.
Load management’s benefits are systemwide. Alteration of the electric energy use patterns will not only affect the demands on system generating equipment but also alter the loading of distribution equipment. The load management (or demand-side management) may be used to reduce or balance loads on marginal substations and circuits, thus even extending their lives. Therefore, in the future, the implementation of load management policies may drastically affect the distribution of load, in time and in location, on the distribution system, subtransmission system, and the bulk power system. Since distribution systems have been designed to interface with controlled load patterns, the systems of the future will necessarily be designed somewhat differently to benefit from the altered conditions. However, the benefits of load management (or demand-side management) cannot be fully realized unless the system planners have the tools required to adequately plan incorporation into the evolving electric energy system. The evolution of the system in response to changing requirements and under changing constraints is a process involving considerable uncertainty.
The requirements of a successful load management program are specified by Delgado [19] as follows:
- It must be able to reduce demand during critical system load periods.
- It must result in a reduction in new generation requirements, purchased power, and/or fuel costs.
- It must have an acceptable cost/benefit ratio.
- Its operation must be compatible with system design and operation.
- It must operate at an acceptable reliability level.
- It must have an acceptable level of customer convenience.
- It must provide a benefit to the customer in the form of reduced rates or other incentives.
1.7.3 Cost/Benefit Ratio for Innovation
In the utility industry, the most powerful force shaping the future is that of economics. Therefore, any new innovations are not likely to be adopted for their own sake but will be adopted only if they reduce the cost of some activity or provide something of economic value, which previously had been unavailable for comparable costs. In predicting that certain practices or tools will replace current ones, it is necessary that one judge their acceptance on this basis.
The expected innovations that satisfy these criteria are planning tools implemented on a digital computer that deals with distribution systems in network terms. One might be tempted to conclude that these planning tools would be adequate for industry use throughout the 1980s. That this is not likely to be the case may be seen by considering the trends judged to be dominant during this period with those that held sway over the period in which the tools were developed.
1.7.4 New Planning Tools
Tools to be considered fall into two categories: network design tools and network analysis tools. The analysis tools may become more efficient but are not expected to undergo any major changes, although the environment in which they are used will change significantly. This environment will be discussed in the next section.
The design tools, however, are expected to show the greatest development since better planning could have a significant impact on the utility industry. The results of this development will show the following characteristics:
- Network design will be optimized with respect to many criteria by using programming methods of operations research.
- Network design will be only one facet of distribution system management directed by human engineers using a computer system designed for such management functions.
- So-called network editors [20] will be available for designing trial networks; these designs in digital form will be passed to extensive simulation programs, which will determine if the proposed network satisfies performance and load growth criteria.
1.8 Central Role of the Computer in Distribution Planning
As is well known, distribution system planners have used computers for many years to perform the tedious calculations necessary for system analysis. However, it has only been in the past few years that technology has provided the means for planners to truly take a system approach to the total design and analysis. It is the central thesis of this book that the development of such an approach will occupy planners in the future and will significantly contribute to their meeting the challenges previously discussed.
1.8.1 System Approach
A collection of computer programs to solve the analysis problems of a designer necessarily constitutes neither an efficient problem-solving system nor such a collection even when the output of one can be used as the input of another. The system approach to the design of a useful tool for the designer begins by examining the types of information required and its sources. The view taken is that this information generates decisions and additional information that pass from one stage of the design process to another. At certain points, it is noted that the human engineer must evaluate the information generated and add his or her input. Finally, the results must be displayed for use and stored for later reference.
With this conception of the planning process, the system approach seeks to automate as much of the process as possible, ensuring in the process that the various transformations of information are made as efficiently as possible. One representation of this information flow is shown in Figure 1.10, where the outer circle represents the interface between the engineer and the system. Analysis programs forming part of the system are supported by a database management system (DBMS) that stores, retrieves, and modifies various data on distribution systems [21].

1.8.2 Database Concept
As suggested in Figure 1.10, the database plays a central role in the operation of such a system. It is in this area that technology has made some significant strides in the past 5 years so that not only is it possible to store vast quantities of data economically, but it is also possible to retrieve desired data with access times on the order of seconds.
The DBMS provides the interface between the process that requires access to the data and the data themselves. The particular organization that is likely to emerge as the dominant one in the near future is based on the idea of a relation. Operations on the database are performed by the DBMS.
1.8.3 New Automated Tools
In addition to the database management program and the network analysis programs, it is expected that some new tools will emerge to assist the designer in arriving at the optimal design. One such new tool that has appeared in the literature is known as a network editor [20]. The network consists of a graph whose vertices are network components, such as transformers and loads, and edges that represent connections among the components.
The features of the network editor may include network objects, for example, feeder line sections, secondary line sections, distribution transformers, or variable or fixed capacitors, control mechanisms, and command functions. A primitive network object comprises a name, an object class description, and a connection list. The control mechanisms may provide the planner with natural tools for correct network construction and modification [21].
1.9 Impact of Dispersed Storage and Generation
Following the oil embargo and the rising prices of oil, the efforts toward the development of alternative energy sources (preferably renewable resources) for generating electric energy have been increased. Furthermore, opportunities for small power producers and cogenerators have been enhanced by recent legislative initiatives, for example, the Public Utility Regulatory Policies Act (PURPA) of 1978 and by the subsequent interpretations by the Federal Energy Regulatory Commission in 1980 [22,25].
The following definitions of the criteria affecting facilities under PURPA are given in Section 201 of PURPA:
A small power production facility is one which produces electric energy solely by the use of primary fuels of biomass, waste, renewable resources, or any combination thereof. Furthermore, the capacity of such production sources together with other facilities located at the same site must not exceed 80 MW.
A cogeneration facility is one which produces electricity and steam or forms of useful energy for industrial, commercial, heating, or cooling applications.
A qualified facility is any small power production or cogeneration facility which conforms to the previous definitions and is owned by an entity not primarily engaged in generation or sale of electric power.
In general, these generators are small (typically ranging in size from 100 kW to 10 MW and connectable to either side of the meter) and can be economically connected only to the distribution system. They are defined as dispersed storage and generation (DSG) devices. If properly planned and operated, DSG may provide benefits to distribution systems by reducing capacity requirements, improving reliability, and reducing losses.
Examples of DSG technologies include hydroelectric, diesel generators, wind electric systems, solar electric systems, batteries, storage space and water heaters, storage air conditioners, hydroelectric pumped storage, photovoltaics, and fuel cells. Table 1.1 gives the results of a comparison of DSG devices with respect to the factors affecting the energy management system (EMS) of a utility system [26]. Table 1.2 gives the interactions between the DSG factors and the functions of the EMS or energy control center.
Comparison of DSG Devices
DSC Devices |
Factors |
||||||||
|---|---|---|---|---|---|---|---|---|---|
Size |
Power Source Availability |
Power Source Stability |
DSC Energy Limitation |
Voltage Control |
Response Speed |
Harmonic Generation |
Special Automatic Start |
DSG Factors |
|
Biomass |
Variable |
Good |
Good |
No |
Yes |
Fast |
No |
Yes |
Yes |
Geothermal |
Medium |
Good |
Good |
No |
Yes |
Medium |
No |
Yes |
No |
Pumped hydro |
Large |
Good |
Good |
Yes |
Yes |
Fast |
No |
Yes |
No |
Compressed air storage |
Large |
Good |
Good |
Yes |
Yes |
Fast |
No |
Yes |
No |
Solar thermal |
Variable |
Uncertain |
Poor |
No |
Uncertain |
Variable |
Uncertain |
Uncertain |
Yes |
Photovoltaics |
Variable |
Uncertain |
Poor |
No |
Uncertain |
Fast |
Yes |
Yes |
Yes |
Wind |
Small |
Uncertain |
Poor |
No |
Uncertain |
Fast |
Uncertain |
Yes |
Yes |
Fuel cells |
Variable |
Good |
Good |
No |
Yes |
Fast |
Yes |
Yes |
No |
Storage battery |
Variable |
Good |
Good |
Yes |
Yes |
Fast |
Yes |
Yes |
No |
Low-head hydro |
Small |
Variable |
Good |
No |
Yes |
Fast |
No |
Yes |
No |
Cogeneration: |
|||||||||
Gas turbine |
Medium |
Good |
Good |
No |
Yes |
Fast |
No |
Yes |
No |
Burning refuse |
Medium |
Good |
Good |
No |
Yes |
Fast |
No |
Yes |
No |
Landfill gas |
Small |
Good |
Good |
No |
Yes |
Fast |
No |
Yes |
No |
Source: Kirkham, H. and Klein, J., IEEE Trans. Power Appar. Syst., PAS-102(2), 339, 1983.
Interaction between DSG Factors and Energy Management System Functions
Functions |
Factors |
||||||||
|---|---|---|---|---|---|---|---|---|---|
size |
Power Source Availability |
Power Source Stability |
Energy Limitation |
DSG Voltage Control |
Response Speed |
Harmonic Generation |
Automatic Start |
Special DSG Factors |
|
Automatic generation control |
1 |
1 |
1 |
1 |
0 |
1 |
0 |
0 |
0 |
Economic dispatch |
1 |
1 |
1 |
1 |
? |
0 |
0 |
1 |
0 |
Voltage control |
1 |
0 |
1 |
0 |
1 |
1 |
? |
0 |
0 |
Protection |
1 |
0 |
1 |
0 |
1 |
1 |
1 |
1 |
1 |
State estimation |
1 |
0 |
0 |
0 |
0 |
0 |
0 |
? |
0 |
On-line load flow |
1 |
0 |
0 |
0 |
0 |
0 |
0 |
0 |
0 |
Security monitoring |
1 |
0 |
0 |
0 |
0 |
0 |
0 |
0 |
0 |
Source: Kirkham, H. and Klein, J., IEEE Trans. Power Appar. Syst., PAS-102(2), 339, 1983.
1, Interaction probable; 0, interaction unlikely; ?, interaction possible.
As mentioned before, it has been estimated that the installed generation capacity will be about 1200 GW in the United States by the year 2000 (Table 1.3). The contribution of the DSG systems to this figure has been estimated to be in a range of 4%–10%. For example, if 5% of installed capacity is DSG in the year 2000, it represents a contribution of 60 GW.
Profile of the Electric Utility Industry in the United States in the Year 2000
Total US population |
250 × 106 |
Number of electric meters |
110 × 106 |
Number of residence |
|
With central air conditioners |
33 × 106 |
With electric water heaters |
25 × 106 |
With electric space heating |
7 × 10⁶ |
Number of electric utilities |
3100 |
Source: Vaisnys, A., A Study of a Space Communication System for the Control and Monitoring of the Electric Distribution System, JPL Publication 80-48, Jet Propulsion Laboratory, California Institute of Technology, Pasadena, CA, May 1980. With permission.
According to Chen [27], as power distribution systems become increasingly complex due to the fact that they have more DSG systems, as shown in Figure 1.11, distribution automation will be indispensable for maintaining a reliable electric supply and for cutting down operating costs.
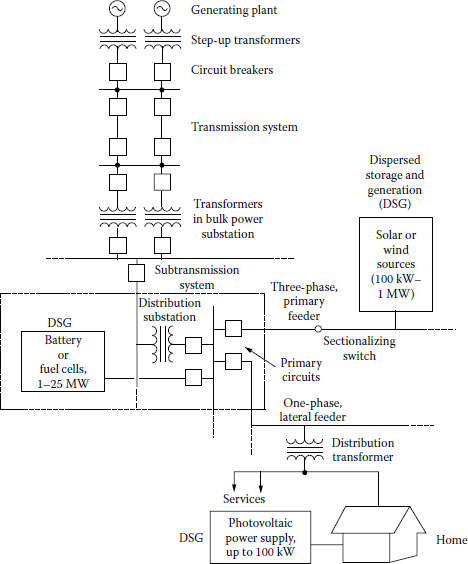
In the future, small dispersed-energy-storage-and-generation units attached to a customer’s home, a power distribution feeder, or a substation would require an increasing amount of automation and control.
(From Chen, A.C.M., Automated power distribution, IEEE Spectrum, pp. 55–60, April 1982. Used by permission © 1982 IEEE.)
In distribution systems with DSG, the feeder or feeders will no longer be radial. Consequently, a more complex set of operating conditions will prevail for both steady state and fault conditions. If the dispersed generator capacity is large relative to the feeder supply capacity, then it might be considered as backup for normal supply. If so, this could improve service security in instances of loss of supply.
In a given fault, a more complex distribution of higher-magnitude fault currents will occur due to multiple supply sources. Such systems require more sophisticated detection and isolation techniques than those adequate for radial feeders. Therefore, distribution automation, with its multiple point monitoring and control capability, is well suited to the complexities of a distribution system with DSG.
1.10 Distribution System Automation
The main purpose of an electric power system is to efficiently generate, transmit, and distribute electric energy. The operations involved dictate geographically dispersed and functionally complex monitoring and control systems, as shown in Figure 1.12. As noted in the figure, the EMS exercises overall control over the total system.

The supervisory control and data acquisition (SCADA) system involves generation and transmission systems. The distribution automation and control (DAC) system oversees the distribution system, including connected load. Automatic monitoring and control features have long been a part of the SCADA system.
More recently, automation has become a part of the overall energy management, including the distribution system. The motivating objectives of the DAC system are [28]
- Improved overall system efficiency in the use of both capital and energy
- Increased market penetration of coal, nuclear, and renewable domestic energy sources Reduced reserve requirements in both transmission and generation
- Increased reliability of service to essential loads
Advances in digital technology are making true distribution automation a reality. Recently, inexpensive minicomputers and powerful microprocessors (computer on a chip) have provided distribution system engineers with new tools that are making many distribution automation concepts achievable. It is clear that future distribution systems will be more complex than those of today. If the systems being developed are to be optimal with respect to construction cost, capitalization, performance reliability, and operating efficiency, better automation and control tools are required.
The term distribution automation has a very broad meaning, and additional applications are added every day. To some people, it may mean a communication system at the distribution level that can control customer load and can reduce peak-load generation through load management. To others, the distribution automation may mean an unattended distribution substation that could be considered attended through the use of an on-site microprocessor.
The microprocessor, located at a distribution substation, can continuously monitor the system, make operating decisions, issue commands, and report any change in status to the distribution dispatch center, store it on-site for later use, or forget it, depending on the need of the utility.
1.10.1 Distribution Automation and Control Functions
There is no universal consensus among the utilities as to the types of functions that should be handled by a DAC system. Table 1.4 gives some of the automated distribution functions that can be categorized as the load management (or demand-side management) functions, real-time operational management functions, and remote meter reading functions. Some of these functions will be discussed in further detail.
Automated Distribution Functions Correlated with Locations
Customer Sites |
Power System Elements |
||||||||
|---|---|---|---|---|---|---|---|---|---|
Residential |
Commercial and Industrial |
Agricultural |
Distribution Circuits |
Industrial Substation |
Distribution Substation |
Power Substation |
Bulk DSG Facilities |
||
Load management |
|||||||||
Discretionary load switching |
x |
x |
x |
||||||
Peak-load pricing |
x |
x |
x |
||||||
Load shedding |
x |
x |
x |
||||||
Cold load pickup |
x |
x |
x |
||||||
Operational management |
|||||||||
Load reconfiguration |
x |
x |
x |
x |
|||||
Voltage regulation |
x |
x |
x |
x |
|||||
Transformer load management |
x |
x |
|||||||
Feeder load management |
x |
x |
|||||||
Capacitor control |
x |
x |
|||||||
Dispersed storage and generation |
x |
||||||||
Fault detection, location, and isolation |
x |
x |
x |
x |
|||||
Load studies |
x |
x |
x |
x |
x |
x |
|||
Condition and state monitoring |
x |
x |
x |
x |
x |
x |
x |
||
Remote meter reading |
|||||||||
Automatic customer meter reading |
x |
x |
x |
||||||
DSG, dispersed storage and generation |
|||||||||
Source: Vaisnys, A., A Study of a Space Communication System for the Control and Monitoring of the Electric Distribution System, JPL Publication 80-48, Jet Propulsion Laboratory, California Institute of Technology, Pasadena, CA, May 1980.
Discretionary load switching: This function is also called the customer load management. It involves direct control of loads at individual customer sites from a remote central location. Control may be exercised for the purpose of overall system peak-load reduction or to reduce the load on a particular substation or feeder that is becoming overloaded.
Customer loads that are appropriate for control are water heating, air-conditioning, space heating, thermal storage heating, etc., and industrial loads supplied under interruptible service contracts. While this function is similar to peak-load pricing, the dispatching center controls the individual customer loads rather than only the meters.
Peak-load pricing: This function allows the implementation of peak-load pricing programs by remote switching of meter registers automatically for the purpose of time-of-day metering.
Load shedding: This function permits the rapid dropping of large blocks of load, under certain conditions, according to an established priority basis.
Cold load pickup: This function is a corollary to the load-shedding function. It entails the controlled pickup of dropped load. Here, cold load pickup describes the load that causes a high magnitude, short duration inrush current, followed by the undiversified demand experienced when reenergizing a circuit following an extended, that is, 20 min or more, interruption.
Fast completion of a fault isolation and service restoration operation will reduce the undiversified component of cold load pickup considerably. Significant service interruption will be limited to those customers supplied from the faulted and isolated line section. An extended system interruption may be due to upstream events beyond the control of the distribution automation system. When this occurs, the undiversified demand cold load pickup can be suppressed.
This is achieved by designing the system to disconnect loads controlled by the load management systems that customer loads are reduced when energy is restored. Reconnection of loads can be timed to match the return of diversity to prevent exceeding feeder loading limits.
Load reconfiguration: This function involves remote control of switches and breakers to permit routine daily, weekly, or seasonal reconfiguration of feeders or feeder segments for the purpose of taking advantage of load diversity among feeders. It enables the system to effectively serve larger loads without requiring feeder reinforcement or new construction. It also enables routine maintenance on feeders without any customer load interruptions.
Voltage regulation: This function allows the remote control of selected voltage regulators within the distribution network, together with network capacitor switching, to effect coordinated systemwide voltage control from a central facility.
Transformer load management (TLM): This function enables the monitoring and continuous reporting of transformer loading data and core temperature to prevent overloads, burnouts, or abnormal operation by timely reinforcement, replacement, or reconfiguration.
Feeder load management (FLM): This function is similar to TLM, but the loads are monitored and measured on feeders and feeder segments (known as the line sections) instead. This function permits loads to be equalized over several feeders.
Capacitor control: This function permits selective and remote-controlled switching of distribution capacitors.
Dispersed storage and generation: Storage and generation equipment may be located at strategic places throughout the distribution system, and they may be used for peak shaving. This function enables the coordinated remote control of these sites.
Fault detection, location, and isolation: Sensors located throughout the distribution network can be used to detect and report abnormal conditions. This information, in turn, can be used to automatically locate faults, isolate the faulted segment, and initiate proper sectionalization and circuit reconfiguration. This function enables the dispatcher to send repair crews faster to the fault location and results in lesser customer interruption time.
Load studies: This function involves the automatic online gathering and recording of load data for special off-line analysis. The data may be stored at the collection point, at the substation, or transmitted to a dispatch center. This function provides accurate and timely information for the planning and engineering of the power system.
Condition and state monitoring: This function involves real-time data gathering and status reporting from which the minute-by-minute status of the power system can be determined.
Automatic customer meter reading: This function allows the remote reading of customer meters for total consumption, peak demand, or time-of-day consumption, and saves the otherwise necessary man-hours involved in meter reading.
Remote service connect or disconnect: This function permits remote control of switches to connect or disconnect an individual customer’s electric service from a central control location.
1.10.2 Level of Penetration of Distribution Automation
The level of penetration of distribution automation refers to how deeply into the distribution system the automation will go. Table 1.5 gives the present and near-future functional scope of power distribution automation systems.
Functional Scope of Power Distribution Automation System
Present |
Within up to 5 Years |
After 5 Years |
|---|---|---|
Protection |
||
Excessive current over long time |
Breaker failure protection |
Dispersed storage and generation (DSG) protection |
Instantaneous overcurrent |
Synchronism check |
|
Under frequency |
Personnel safety |
|
Transformer protection |
||
Bus protection |
||
Operational control and monitoring |
||
Automatic bus sectionalizing |
Integrated voltage and var control: |
DSG command and control: power, voltage, synchronization |
Alarm annunciation |
Capacitor bank control |
|
Transformer tap-change control Instrumentation |
Transformer tap-change control |
DSG scheduling |
Feeder deployment switching and automatic sectionalizing |
Automatic generation control |
|
Load control |
Load shedding |
Security assessment |
Data acquisition, logging, and display Sequence-of-events recording |
||
Transformer monitoring Instrumentation and diagnostics |
||
Data collection and system planning |
||
Remote supervisory control and data acquisition (SCADA) at a substation |
Distribution SCADA |
Distribution dispatching center |
Automatic meter reading |
Distribution system database Automatic billing |
|
Service connecting and disconnecting |
||
Communications |
||
One-way load control |
Two-way communication, using one medium |
Two-way communication, using many media |
Source: Chen, A.C.M., IEEE Spectrum, pp. 55–60, April 1982. With permission.
Recently, the need for gathering substation and power plant data has increased. According to Gaushell et al. [29], this is due to
- Increased reporting requirements of reliability councils and government agencies
- Operation of the electric system closer to design limits
- Increased efficiency requirements because of much higher fuel prices
- The tendency of utilities to monitor lower voltages than previously
These needs have occurred simultaneously with the relative decline of the prices of computer and other electronic equipment. The result has been a quantum jump in the amount of data being gathered by an SCADA system or EMS.
A large portion of these data consists of analog measurements of electrical quantities, such as watts, vars, and volts, which are periodically sampled at a remote location, transmitted to a control center, and processed by computer for output on CRT displays, alarm logs, etc. However, as the amount of information to be reported grows, so do the number of communication channels and the amount of control center computer resources required.
Therefore, as equipment are controlled or monitored further down the feeder, the utility obtains more information, can have greater control, and has greater flexibility. However, costs increase as well as benefits. As succinctly put by Markel and Layfield [30],
- The number of devices to be monitored or controlled increases drastically.
- The communication system must cover longer distances, connect more points, and transmit greater amounts of information.
- The computational requirements increase to handle the larger amounts of data or to examine the increasing number of available switching options.
- The time and equipment needed to identify and communicate with each individually controlled device increases as the addressing system becomes more finely grained.
Today, microprocessors use control algorithms, which permit real-time control of distribution system configurations. For example, it has become a reality that normal loadings of substation transformers and of looped (via a normally open tie recloser) sectionalized feeders can be economically increased through software-controlled load-interrupting switches. SCADA remotes, often computer directed, are being installed in increasing numbers in distribution substations.
They provide advantages such as continuous scanning, higher speed of operation, and greater security. Furthermore, thanks to the falling prices of microprocessors, certain control practices (e. g., protecting power systems against circuit-breaker failures by energizing backup equipment, which is presently done only in transmission systems) are expected to become cost-effective in distribution systems.
The EPRI and the US Department of Energy singled out power-line, telephone, and radio carriers as the most promising systems for their research; other communication techniques are certainly possible. However, at the present time, these other techniques involve greater uncertainties [31].
In summary, the choice of a specific communication system or combination of systems depends upon the specific control or monitoring functions required, amount and speed of data transmission required, existing system configuration, density of control points, whether one-way or two-way communication is required, and, of course, equipment costs.
It is possible to use hybrid systems, that is, two or more different communication systems, between utility and customer. For example, a radio carrier might be used between the control station and the distribution transformer, a power-line carrier (PLC) between the transformer and the customer’s meter. Furthermore, the command (forward) link might be one communication system, for example, broadcast radio, and the return (data) link might be another system, such as VHF radio.
An example of such a system is shown in Figure 1.13. The forward (control) link of this system uses commercial broadcast radio. Utility phase-modulated digital signals are added to amplitudemodulated (AM) broadcast information. Standard AM receivers cannot detect the utility signals, and vice versa. The return data link uses VHF receivers that are synchronized by the broadcast station to significantly increase data rate and coverage range [32].

Figure 1.14 shows an experimental system for automating power distribution at the LaGrange Park Substation of Commonwealth Edison Company of Chicago. The system includes two minicomputers, a commercial VHF radio transmitter and receiver, and other equipment installed at a special facility called Probe. Microprocessors atop utility poles can automatically connect or disconnect two sections of a distribution feeder upon instructions from the base station.
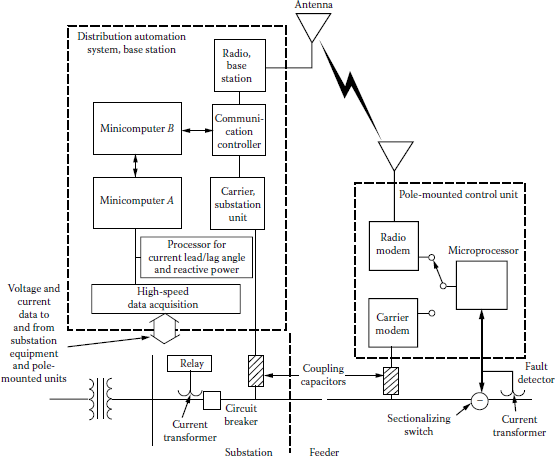
The research system consisted of two minicomputers with distributed high-speed data acquisition processing units at the La Grange Park Substation.
(From Chen, A.C.M., Automated power distribution, IEEE Spectrum, pp. 55–60, April 1982. Used by permission © 1982 IEEE.)
Figure 1.15 shows a substation control and protection system that has also been developed by EPRI. It features a common signal bus to control recording, comparison, and follow-up actions. It includes line protection and transformer protection. The project is directed toward developing microprocessor-based digital relays capable of interfacing with conventional current and potential transformers and of accepting digital data from the substation yard.
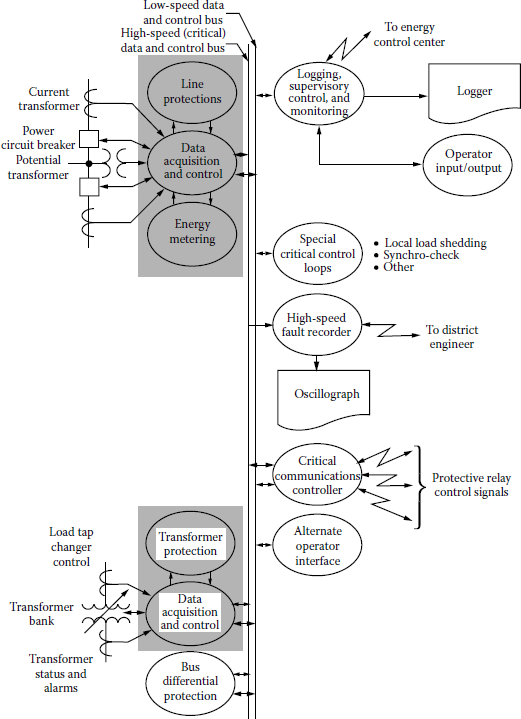
Substation control and protection system that features a common signal bus (center lines) to control recording, comparison, and follow-up actions (right). Critical processes are shaded.
(From EPRI J., 53, June 1978.)
These protective devices can also communicate with substation microcomputer controls capable of providing sequence of events, fault recording, and operator control display. They are also able to interface upward to the dispatcher’s control and downward to the distribution system control [44].
Figure 1.16 shows an integrated distribution control and protection system developed by EPRI. The integrated system includes four subsystems: a substation integration module (SIM), a data acquisition system (DAS), a digital protection module (DPM), and a feeder remote unit (FRU).

The integrated distribution control and protection system of EPRI. *Data acquisition system; †digital protection module.
(From EPRI J., 43, May 1983.)
The SIM coordinates the functions of the data acquisition and control system, the DPM, and FRUs by collecting data from them and forming the real-time database required for substation and feeder control. The digital protection module operates in coordination with the DAS and is also a stand-alone device.
1.10.3 Alternatives of Communication Systems
There are various types of communication systems available for distribution automation:
- PLC
- Radio carrier
- Telephone (lines) carrier
- Microwave
- Private cables, including optical fibers
Power-line carrier (PLC) systems use electric distribution lines for the transmission of communication signals. The advantages of the PLC system include complete coverage of the entire electric system and complete control by the utility. Its disadvantages include the fact that under mass failure or damage to the distribution system, the communication system could also fail and that additional equipment must be added to the distribution system.
In radio carrier systems, communication signals are transmitted point to point via radio waves. Such systems would be owned and operated by electric utilities. It is a communication system that is separate and independent of the status of the distribution system. It can also be operated at a very high data rate. However, the basic disadvantage of the radio system is that the signal path can be blocked, either accidentally or intentionally.
Telephone carrier systems use existing telephone lines for signal communication, and therefore they are the least expensive. However, existing telephone tariffs probably make the telephone system one of the more expensive concepts at this time. Other disadvantages include the fact that the utility does not have complete control over the telephone system and that not all meters have telephone service at or near them. Table 1.6 summarizes the advantages and disadvantages of the aforementioned communication systems.
Summary of Advantages and Disadvantages of the Power-Line, Radio, and Telephone carriers
Advantages |
Disadvantages |
|---|---|
Power-line carrier |
|
Owned and controlled by utility |
Utility system must be conditioned |
Considerable auxiliary equipment |
|
Communication system fails if poles go down |
|
Radio carrier |
|
Owned and controlled by utility |
Subject to interference by buildings and trees |
Point-to-point communication |
|
Terminal equipment only |
|
Telephone carrier |
|
Terminal equipment only |
Utility lacks control |
Carrier maintained by phone company |
Ongoing tariff costs |
New telephone drops must be added |
|
Installation requires house wiring |
|
Communication system fails if poles go down |
Source: Proceedings Distribution Automation and Control Working Group, JPL Publication 79-35, Jet Propulsion Laboratory, California Institute of Technology, Pasadena, CA, March 1979. With permission.
Furthermore, according to Chen [27], utilities would have to change their control hierarchies substantially in the future to accommodate the DSG systems in today’s power distribution systems, as shown in Figure 1.17.

A control hierarchy envisaged for future utilities.
(From Chen, A.C.M., Automated power distribution, IEEE Spectrum, pp. 55–60, April 1982. Used by permission © 1982 IEEE.)
1.11 Summary and Conclusions
In summary, future distribution systems will be more complex than those of today, which means that the distribution system planner’s task will be more complex. If the systems being planned are to be optimal with respect to construction cost, capitalization, performance reliability, and operating efficiency, better planning and operation tools are required.
While it is impossible to foresee all the effects that technology will have on the way in which distribution planning and engineering will be done, it is possible to identify the major forces that are beginning to institute a change in the methodology and extrapolate.
References
1. Westinghouse Electric Corporation: Electric Utility Engineering Reference Book-Distribution Systems, Vol. 3, Westinghouse Electric Corporation, East Pittsburgh, PA, 1965.
2. Energy Information Administration: Energy Data Reports-Statistics of Privately-Owned Electric Utilities in the United States, US Department of Energy, Washington, DC, 1975–1978.
3. US Department of Energy: The National Electric Reliability Study: Technical Study Reports, US Department of Energy, DOE/EP-0005, Office of Emergency Operations, Washington, DC, April 1981.
4. Economic Regulatory Administration: The National Power Grid Study, Vol. 2, US Department of Energy, DOE/ERA-0056–2, Economic Regulatory Administration, Office of Utility Systems, Washington, DC, September 1979.
5. Gönen, T. et al.: Toward automated distribution systems planning, Proceedings of the IEEE Control of Power Systems Conference, Texas A&M University, College Station, TX, March 19–21, 1979, pp. 23–30.
6. Munasinghe, M.: The Economics of Power System Reliability and Planning, Johns Hopkins, Baltimore, MD, 1979.
7. Gönen, T. and J. C. Thompson: Distribution system planning: The state-of-the-art and the future trends, Proceedings, Southwest Electrical Exposition and the IEEE Conference, Houston, TX, January 22–24, 1980, pp. 13–18.
8. Gönen, T. and J. C. Thompson: An interactive distribution system planning model, Proceedings of the 1979 Modeling and Simulation Conference, University of Pittsburgh, Pittsburgh, PA, April 25–27, 1979, Vol. 10, pt. 3, pp. 1123–1131.
9. Sullivan, R. L.: Power System Planning, McGraw-Hill, New York, 1977.
10. Willis, H. L. et al.: Optimization applications to power distribution, IEEE Comp. Appl. In Power, 2(10), October 1995, 12–17.
11. Ramirez-Rosado, I. J. and T. Gönen: Optimal multi-stage planning of power distribution systems, IEEE Trans. Power Delivery, 2(2), April 1987, 512–519.
12. Gönen, T. and B. L. Foote: Distribution system planning using mixed-integer programming, IEEE Proc., 128(pt. C, no. 2), March 1981, 70–79.
13. Knight, U. G.: Power Systems Engineering and Mathematics, Pergamon, Oxford, England, 1972.
14. Gönen, T., B. L. Foote, and J. C. Thompson: Development of Advanced Methods for Planning Electric Energy Distribution Systems, US Department of Energy, Washington, DC, October 1979.
15. Gönen, T. and D. C. Yu: A distribution system planning model, Proceedings of the IEEE Control of Power Systems Conference (COPS), Oklahoma City, OK, March 17–18, 1980, pp. 28–34.
16. Gönen, T. and B. L. Foote: Mathematical dynamic optimization model for electrical distribution system planning, Electr. Power Energy Syst., 4(2), April 1982, 129–136.
17. Ludot, J. P. and M. C. Rubinstein: Méthodes pour la Planification á Court Terme des Réseaux de Distribution, Proceedings of the Fourth PSCC, Paper 1.1/12, Grenoble, France, 1972.
18. Launay, M.: Use of computer graphics in data management systems for distribution network planning in Electricite De France (E.D.F.), IEEE Trans. Power Appar. Syst., PAS-101(2), 1982, 276–283.
19. Delgado, R.: Load management—A planner’s view, IEEE Trans. Power Appar. Syst., PAS-102(6), 1983, 1812–1813.
20. Gönen, T. and B. L. Foote: Application of mixed-integer programming to reduce suboptimization in distribution systems planning, Proceedings of the 1979 Modeling and Simulation Conference, University of Pittsburgh, Pittsburgh, PA, April 25–27, 1979, Vol. 10, pt. 3, pp. 1133–1139.
21. Gönen, T. and D. C. Yu: Bibliography of distribution system planning, Proceedings of the IEEE Control of Power Systems Conference (COPS), Oklahoma City, OK, March 17–18, 1980, pp. 23–34.
22. Public Utility Regulatory Policies Act (PURPA), House of Representatives, Congressional Report No. 95–1750, Conference Report, Library of Congress, October 10, 1980.
23. Ma, F., L. Isaksen, and R. Patton: Impacts of Dispersing Storage and Generation in Electric Distribution Systems, Final report, US Department of Energy, Washington, DC, July 1979.
24. Vaisnys, A.: A Study of a Space Communication System for the Control and Monitoring of the Electric Distribution System, JPL Publication 80-48, Jet Propulsion Laboratory, California Institute of Technology, Pasadena, CA, May 1980.
25. Federal Energy Regulatory Commission Regulations under Sections 201 and 210 of PURPA, Sections 292.101, 292.301–292. 308, and 292.401–292.403. Congressional Report No. 95–181, Library of Congress, 1981.
26. Kirkham, H. and J. Klein: Dispersed storage and generation impacts on energy management systems, IEEE Trans. Power Appar. Syst., PAS-102(2), 1983, 339–345.
27. Chen, A. C. M.: Automated power distribution, IEEE Spectrum, April 1982, pp. 55–60.
28. Distribution automation and control on the electric power system, Proceedings of the Distribution Automation and Control Working Group, JPL Publication 79-35, Jet Propulsion Laboratory, California Institute of Technology, Pasadena, CA, March 1979.
29. Gaushell, D. J., W. L. Frisbie, and M. H. Kuchefski: Analysis of analog data dynamics for supervisory control and data acquisition systems, IEEE Trans. Power Appar. Syst., PAS-102(2), February 1983, 275–281.
30. Markel, L. C. and P. B. Layfield: Economic feasibility of distribution automation, Proceedings of Control of Power Systems Conference, Texas A&M University, College Station, TX, March 14–16, 1977, pp. 58–62.
31. Two-way data communication between utility and customer, EPRI J., May 1980, 17–19.
32. Distribution, communication and load management, in R&D Status Report-Electrical Systems Division, EPRI J., September 1982, 46–47.
33. Kaplan, G.: Two-way communication for load management, IEEE Spectrum, August 1977, 47–50.
34. Bunch, J. B. et al.: Probe and its implications for automated distribution systems, Proceedings of the American Power Conference, Chicago, IL, April 1981, Vol. 43, pp. 683–688.
35. Castro, C. H., J. B. Bunch, and T. M. Topka: Generalized algorithms for distribution feeder deployment and sectionalizing, IEEE Trans. Power Appar. Syst., PAS-99(2), March/April 1980, pp. 549–557.
36. Morgan, M. G. and S. N. Talukdar: Electric power load management: Some technical, economic, regulatory and social issues, Proc. IEEE, 67(2), February 1979, 241–313.
37. Bunch, J. B., R. D. Miller, and J. E. Wheeler: Distribution system integrated voltage and reactive power control, Proceedings of the PICA Conference, Philadelphia, PA, May 5–8, 1981, pp. 183–188.
38. Redmon, J. R. and C. H. Gentz: Effect of distribution automation and control on future system configuration, IEEE Trans. Power Appar. Syst., PAS-100(4), April 1981, 1923–1931.
39. Chesnut, H. et al.: Monitoring and control requirements for dispersed storage and generation, IEEE Trans. Power Appar. Syst., PAS-101(7), July 1982, 2355–2363.
40. Inglis, D. J., D. L. Hawkins, and S. D. Whelan: Linking distribution facilities and customer information system data bases, IEEE Trans. Power Appar, Syst., PAS-101(2), February 1982, 371–375.
41. Gönen, T. and J. C. Thompson: Computerized interactive model approach to electrical distribution system planning, Electr. Power Ener. Syst., 6(1), January 1984, 55–61.
42. Gönen, T., A. A. Mahmoud, and H. W. Colburn: Bibliography of power distribution system planning, IEEE Trans. Power Appar. Syst., 102(6), June 1983, 1778–1187.
43. Gönen, T. and I. J. Ramirez-Rosado: Review of distribution system planning models: A model for optimal multistage planning, IEE Proc., 133(2, part. C), March 1981, 397–408.
44. Control and protection systems, in R&D Status Report-Electrical Systems Division, EPRI J., June 1978, 53–55.
45. Ramirez-Rosado, I. J., R. N. Adams, and T. Gönen: Computer-aided design of power distribution systems: Multi-objective mathematical simulations, Int. J. Power Ener. Syst., 14(1), 1994, 9–12.
46. Distribution automation, in R&D Status Report-Electrical Systems Division, EPRI J., May 1983, 43–45.
47. Ramirez-Rosado, I. J. and T. Gönen: Review of distribution system planning models: A model for optimal multistage planning, IEE Proc., 133(part C, no. 7), November 1986, 397–408.
48. Ramirez-Rosado, I. J. and T. Gönen: Pseudo-dynamic planning for expansion of power distribution systems, IEEE Trans. Power Syst., 6(1), February 1991, 245–254.