
5.5.3 Pressure Drop in Pipes
Normally, the pressure drop for gases flowing through pipes without packing can be neglected. For flow in pipes, the pressure drop along the length of the pipe can be approximated by
![]()
where
![]()
where f is the Fanning friction factor, D is the pipe diameter, and the other parameters are the same as previously defined.
For the flow conditions given in Example 5-4 in a 1000-ft length of 1½-inch schedule 40 pipe (αp = 0.0118 ft–3), the pressure drop is less than 10%. However, for high volumetric flow rates through microreactors, the pressure drop could be significant.
Example 5-4. Calculating Pressure Drop in a Packed Bed
Plot the pressure drop in a 60 ft length of 1½-inch schedule 40 pipe packed with catalyst pellets ¼-inch in diameter. There is 104.4 lbm/h of gas passing through the bed. The temperature is constant along the length of pipe at 260°C. The void fraction is 45% and the properties of the gas are similar to those of air at this temperature. The entering pressure is 10 atm.
a. First let’s calculate the total pressure drop.
At the end of the reactor, z = L, Equation (5-34) becomes
E5-4.1
![]()
5-25
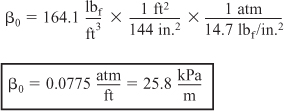
![]()
E5-4.2
![]()
For 1½-inch schedule 40 pipe, Ac = 0.01414 ft2:
![]()
For air at 260°C and 10 atm,
μ = 0.0673 lbm/ft·h
ρ0 = 0.413 lbm/ft3
![]()

Substituting these values into Equation (5-25) gives
E5-4.3

E5-4.4

We note that the turbulent flow term, Term 2, is dominant.
E5-4.5
We are now in a position to calculate the total pressure drop ΔP.
E5-4.6
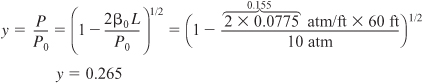
E5-4.7
![]()
b. Now let’s use the data to plot the pressure and the volumetric flow rate profiles. Recalling Equation (5-23) for the case ε = 0 and T = T0
E5-4.8

Table E5-4.1. P and υ Profiles

For ρc = 120 lbm/ft3

Equations (E5-34.1) and (E5-4.8), along with the values in Table E5-4.1, were used to obtain Figure E5-4.1.
Figure E5-4.1. Pressure and volumetric flow rate profiles ![]() .
.

Note how the volumetric flow rate increases dramatically as we move down the reactor.
Analysis: This example showed how to calculate the pressure drop and pressure drop parameters (α and β0) for a gas flowing through a packed-bed reactor. The pressure and volumetric flow rate profiles were calculated as a function of z (i.e., catalyst weight), as shown in Figure E5-4.1. One thing I bet you did not expect in this figure is how much the volumetric flow rate increases as the pressure decreases as one moves down the length of the PBR.