
9.4.4 Mass Balances
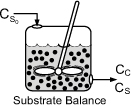
There are two ways that we could account for the growth of microorganisms. One is to account for the number of living cells, and the other is to account for the mass of the living cells. We shall use the latter. A mass balance on the microorganisms in a CSTR (chemostat) (e.g., margin figure and Figure 9-24) of constant volume is
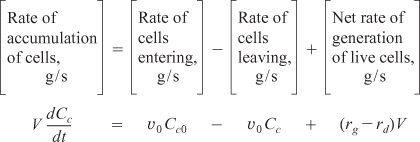
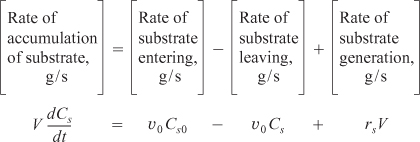
The corresponding substrate balance is
In most systems, the entering microorganism concentration, Cc0, is zero for a flow reactor.
Batch Operation
For a batch system υ = υ0 = 0, the mass balances are as follows:
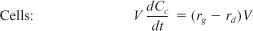
Cell Mass Balance
![]()
Dividing by the reactor volume V gives
![]()
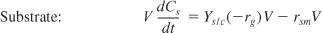
Substrate Mass Balance
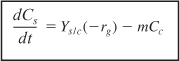
The rate of disappearance of substrate, –rs, results from substrate used for cell growth and substrate used for cell maintenance,

Dividing by V yields the substrate balance for the growth phase
For cells in the stationary phase, where there is no growth in cell concentration, cell maintenance and product formation are the only reactions to consume the secondary substrate. Under these conditions the substrate balance, Equation (9-76), reduces to
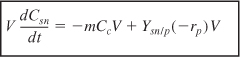
Typically, rp will have the same Monod form of the rate law as rg [e.g., Equation (9-71)]. Of course, Equation (9-79) only applies for substrate concentrations greater than zero.
Product Mass Balance
The rate of product formation, rp, can be related to the rate of substrate consumption, –rs, through the following balance when m = 0:
![]()
During the growth phase we could also relate the rate of formation of product, rp, to the cell growth rate, rg, Equation (9-63), i.e., rp = Yp/crg. The coupled first-order ordinary differential equations above can be solved by a variety of numerical techniques.
Example 9-5. Bacteria Growth in a Batch Reactor
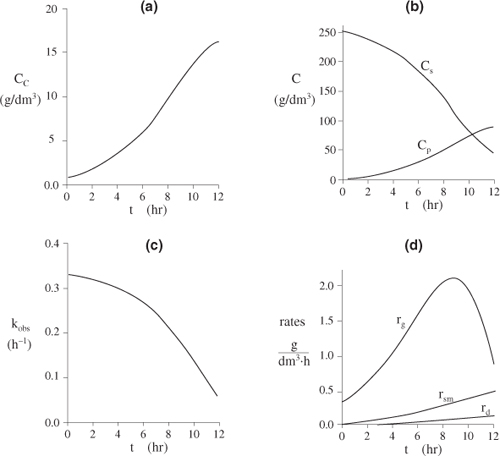
Glucose-to-ethanol fermentation is to be carried out in a batch reactor using an organism such as Saccharomyces cerevisiae. Plot the concentrations of cells, substrate, and product and the rates rg, rd, and rsm as functions of time. The initial cell concentration is 1.0 g/dm3, and the substrate (glucose) concentration is 250 g/dm3.
Additional data [partial source: R. Miller and M. Melick, Chem. Eng., Feb. 16, p. 113 (1987)]:
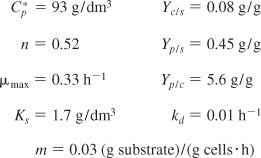
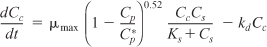
- Mass balances:

- Rate laws:
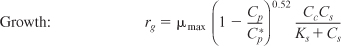


- Stoichiometry:

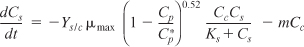
- Combining gives


These equations were solved using an ODE equation solver (see Table E9-5.1). The results are shown in Figure E9-5.1 for the parameter values given in the problem statement.
Table E9-5.1. Polymath Program
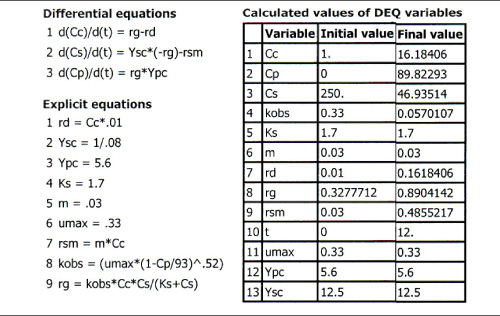
Figure E9-5.1. Concentrations and rates as a function of time.

The substrate concentration Cs can never be less than zero. However, we note that when the substrate is completely consumed, the first term on the right-hand side of Equation (E9-5.8) (and line 3 of the Polymath program) will be zero but the second term for maintenance, mCc, will not. Consequently, if the integration is carried further in time, the integration program will predict a negative value of Cs! This inconsistency can be addressed in a number of ways, such as including an if statement in the Polymath program (e.g., if Cs is less than or equal to zero, then m = 0).
Analysis: In this example we applied a modified CRE algorithm to biomass formation and solved the resulting equations using the ODE solver Polymath. We note in Figure E9-5.1 (d) the growth rate, rg, goes through a maximum increasing at the start of the reaction as the concentration of cells, Cc, increases then decreases as the substrate (nutrient) and kobs decrease. We see from Figures E9-5.1 (a) and (b) that the cell concentration increases dramatically with time while the product concentration does not. The reason for this difference is that part of the substrate is consumed for maintenance and part for cell growth, leaving only the remainder of the substrate to be transformed into product.