
12.6.5 Complex Reactions in a PFR
Example 12-7. Complex Reactions with Heat Effects in a PFR
The following complex gas phase reactions follow elementary rate laws
(1) A + 2B → C ![]() ΔHRx1B = –15,000cal/mole B
ΔHRx1B = –15,000cal/mole B
(2) 2A + 3C → D ![]() ΔHRx2A = –10,000cal/mole A
ΔHRx2A = –10,000cal/mole A
and take place in a PFR. The feed is stoichiometric for reaction (1) in A and B with FA0 = 5 mol/min. The reactor volume is 10 dm3 and the total entering concentration is CT0 = 0.2 mol/dm3. The entering pressure is 100 atm and the entering temperature is 300 K. The coolant flow rate is 50 mol/min and the entering coolant fluid has a heat capacity of CPCO = 10 cal/mol · K and enters at a temperature of 325 K.
![]()
![]()

Plot FA, FB, FC, FD, y, T, and Ta as a function of V for
a. Co-current heat exchange
b. Counter current heat exchange
c. Constant Ta
d. Adiabatic operation
Gas Phase PFR No Pressure Drop (y = 1)
Mole Balances
![]()
![]()
![]()
![]()

Rates:
Rate Laws
![]()
![]()
Relative Rates
![]()
![]()
![]()
![]()
Net Rates of reaction for species A, B, C and D are
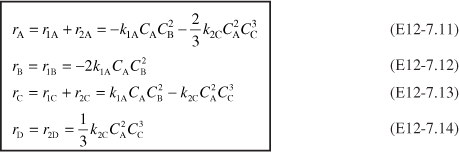
At V = 0, FD = 0 causing SC/D to go to infinity. Therefore, we set SC/D = 0 between V = 0 and a very small number, say, V = 0.0001 dm3 to prevent the ODE solver from crashing.
![]()
Stoichiometry:
![]()
![]()
![]()
![]()
![]()
![]()
Parameters:
![]()
![]()
(24) CA0 = 0.2 mol/dm3
(25) R = 1.987cal/mol/K
(26) E1 = 8,000 cal/mol
(27) E2 = 12,000 cal/mol
(28) → (35) Other parameters CPA, CPB, ![]() ,
, ![]() , etc. are given in the problem statement.
, etc. are given in the problem statement.
Energy Balance:
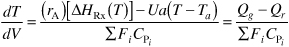
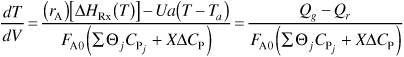
Recalling equation (12-37)
![]()
The denominator of Equation (E12-7.36) is
![]()
The “Heat Removed” term is
![]()
The “Heat Generated” is
![]()
a. Co-current heat exchange
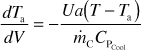
The heat exchange balance for co-current exchange is
E12-7.40
![]()
Part (a) Co-current flow: Plot and analyze the molar flow rates and the reactor and coolant temperatures as a function of reactor volume.
Table E12-7.1. Polymath Program and Output for Co-Current Exchange

Figure E12-7.1. Profiles for co-current heat exchange (a) temperature (b) molar flow rates.
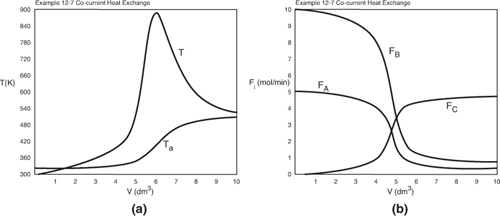
Analysis: Part (a): For co-current heat exchange, the selectivity ![]() is really quite good. We also note that the reactor temperature, T, increases when Qg > Qr and reaches a maximum, T = 930 K at V = 5 dm3. After that, Qr > Qg the reactor temperature decreases and approaches Ta at the end of the reactor.
is really quite good. We also note that the reactor temperature, T, increases when Qg > Qr and reaches a maximum, T = 930 K at V = 5 dm3. After that, Qr > Qg the reactor temperature decreases and approaches Ta at the end of the reactor.
Part (b) Counter current heat exchange: We will use the same program as Part (a), but will change the sign of the heat exchange balance and guess Ta at V = 0 to be 507 K.
We find our guess of 507 K matches Ta0 = 325 K. Are we lucky or what!
Table 12-7.2. Polymath Program and Output for Counter Current Exchange

Figure E12-7.2. Profiles for Counter Current Heat Exchange (a) temperature (b) molar flow rates.

Analysis: Part (b): For counter current exchange the coolant temperature reaches a maximum at V = 1.3 dm3 while the reactor temperature reaches a maximum at V = 2.7 dm3. The reactor with a counter current exchanger reaches a maximum reactor temperature of 1100 K, which is greater than that for the co-current exchanger, (i.e., 930 K). Consequently, if there is a concern about additional side reactions occurring at this maximum temperature of 1100 K, one should use a co-current exchanger or maintain constant Ta in the exchanger. In Figure 12-7.2 (a) we see that the reactor temperature approaches the coolant entrance temperature at the end of the reactor. The selectivity for the counter current systems ![]() is slightly lower than that for the co-current exchange.
is slightly lower than that for the co-current exchange.
Part (c) Constant Ta: To solve the case of constant heating fluid temperature, we simply multiply the right-hand side of the heat exchanger balance by zero, i.e.,
![]()
and use Equations (E12-7.1 through (E12-7.40).
Table 12-7.3. Polymath Program and Output For Constant Ta
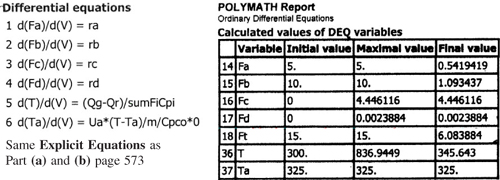
Figure E12-7.3. Profiles for Constant Ta (a) temperature (b) molar flow rates.

Analysis: Part (c): For constant Ta, the maximum reactor temperature, 870K, is less than either co-current or counter-current exchange while the selectivity, ![]() , is greater than either co-current or counter current exchange. Consequently, one should investigate how to achieve sufficiently high mass flow of the coolant in order to maintain constant Ta.
, is greater than either co-current or counter current exchange. Consequently, one should investigate how to achieve sufficiently high mass flow of the coolant in order to maintain constant Ta.
Part (d) Adiabatic: To solve for the adiabatic case, we simply multiply the overall heat transfer coefficient by zero.
Ua = 80*0
Table E12-7.4. Polymath Program and Output For Adiabatic Operation
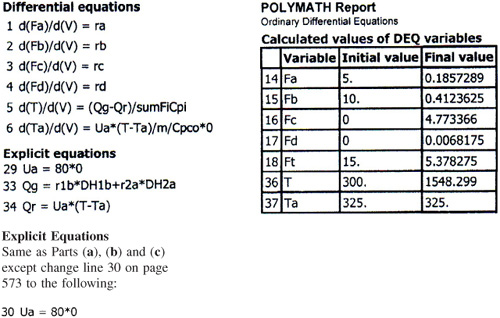
Figure E12-7.4. Profiles for Adiabatic Operation
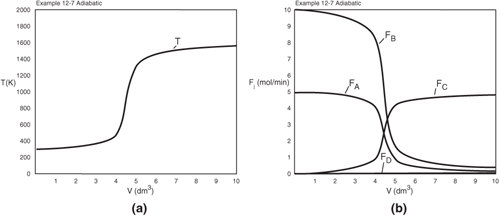
Analysis: Part (d): For the adiabatic case, the maximum temperature, which is the exit temperature, is higher than the other three exchange systems, and the selectivity is the lowest. At this high temperature, the occurrence of unwanted side reactions certainly is a concern.
Overall Analysis Parts (a) to (d): The maximum temperature in each of these cases is outside the safety limit of 700 K for this system. Problem P12-2A (h) asks how you can keep the maximum temperature below 700 K.
12.7 Safety
Scaling up exothermic chemical reactions can be very tricky. Tables 12-5 and 12-6 give reactions that have resulted in accidents and their causes, respectively.7 The reader should review the case histories of these reactions to learn how to avoid similar accidents.
Table 12-5. Incidence of Batch-Process Accidents
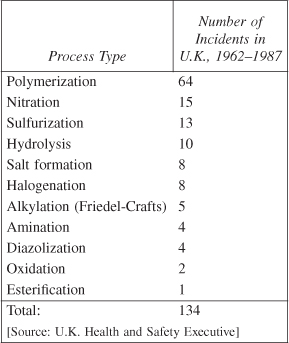
Table 12-6. Causes of Batch Reactor Accidents In Table 12-4

Runaway reactions are the most dangerous in reactor operation, and a thorough understanding of how and when they could occur is part of the chemical reaction engineer’s responsibility. The reaction in the last example in this chapter could be thought of running away. Recall that as we moved down the length of the reactor, none of the cooling arrangements could keep the reactor from reaching an extremely high temperature (e.g., 800 K). In the next chapter, we study case histories of two runaway reactions. One is the nitroaniline explosion discussed in Example E13-2 and the other is Example 13-6, concerning the recent (2007) explosion at T2 Laboratories. [http://www.chemsafety.gov/videoroom/detail.aspx?VID=32].
There are many resources available for additional information on reactor safety and the management of chemical reactivity hazards. Guidelines for managing chemical reactivity hazards and other fire, explosion, and toxic release hazards are developed and published by the Center for Chemical Process Safety (CCPS) of the American Institute of Chemical Engineers. CCPS books and other resources are available at www.aiche.org/ccps. For example, the book Essential Practices for Managing Chemical Reactivity Hazards, written by a team of industry experts, is also provided free of charge by CCPS on the site www.info.knovel.com/ccps. A concise and easy-to-use software program that can be used to determine the reactivity of substances or mixtures of substances, the Chemical Reactivity Worksheet, is provided by the National Oceanic and Atmospheric Administration (NOAA) for free on its Web site www.noaa.gov.
The Safety and Chemical Engineering Education (SAChE) program was formed in 1992, as a cooperative effort between the AIChE, CCPS and engineering schools to provide teaching materials and programs that bring elements of process safety into the education of undergraduate and graduate students studying chemical and biochemical products and processes. The SAChE Web site has a great discussion of reactor safety with examples (www.sache.org) as well as information on reactive materials. These materials are also suitable for training purposes in an industrial setting.
The following instruction modules are available on the SAChE Web site (www.sache.org).
- Chemical Reactivity Hazards:This Web-based instructional module contains about 100 Web pages with extensive links, graphics, videos, and supplemental slides. It can be used either for classroom presentation or as a self-paced tutorial. The module is designed to supplement a junior or senior chemical engineering course by showing how uncontrolled chemical reactions in industry can lead to serious harm, and by introducing key concepts for avoiding unintended reactions and controlling intended reactions.
- Runaway Reactions:Experimental Characterization and Vent Sizing: This instruction module describes the ARSST and its operation, and illustrates how this instrument can easily be used to experimentally determine the transient characteristics of runaway reactions, and how the resulting data can be analyzed and used to size the relief vent for such systems.
- Rupture of a Nitroaniline Reactor:This case study demonstrates the concept of runaway reactions and how they are characterized and controlled to prevent major losses.
- Seveso Accidental Release Case History:This presentation describes a widely discussed case history that illustrates how minor engineering errors can cause significant problems; problems that should not be repeated. The accident was in Seveso, Italy in 1976. It was a small release of a dioxin that caused many serious injuries.
Membership in SAChE is required to view these materials. Virtually all U.S. universities and many non-U.S universities are members of SAChE—contact your university SAChE representative, listed on the SAChE Web site, or your instructor or department chair to learn your university’s user name and password. Companies can also become members—see the SAChE Web site for details.
Certificate Program
SAChE also offers several certificate programs that are available to all chemical engineering students. Students can study the material, take an online test, and receive a certificate of completion. The following two certificate programs are of value for reaction engineering:
- Runaway Reactions:This certificate focuses on managing chemical reaction hazards, particularly runaway reactions.
- Chemical Reactivity Hazards:This is a Web-based certificate that provides an overview of the basic understanding of chemical reactivity hazards.
Many students are taking the certificate test on-line and put the fact that they successfully obtained the certificate on their résumés.
More information on safety is given in the Summary Notes and Professional Reference Shelf on the Web. Particularly study the use of the ARSST to detect potential problems. These will be discussed in Chapter 13 PRS 13.1 on the DVD-ROM.

Summary
- For single reactions, the energy balance on a PFR/PBR in terms of molar flow rate is
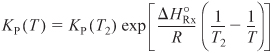
- The temperature dependence of the specific reaction rate is given in the form

- The temperature dependence of the equilibrium constant is given by van’t Hoff’s equation for ΔCP = 0,
- Neglecting changes in potential energy, kinetic energy, and viscous dissipation, and for the case of no work done on or by the system and all species entering at the same temperature, the steady state CSTR energy balance for single reactions is

- Multiple steady states:

- When q multiple reactions are taking place and there are m species,

DVD-ROM Material
- Summary Notes
- Interactive Computer Games

A. Heat Effects I
B. Heat Effects II
- Solved Problems

A. Example 12-2
Formulated in AspenTech: Load AspenTech directly from the DVD-ROM

B. Example CD12-1
ΔHRx(T) for Heat Capacities Expressed as Quadratic Functions of Temperature
C. Example CD12-2
Second-Order Reaction Carried Out Adiabatically in a CSTR
- PFR/PBR Solution Procedure for a Reversible Gas-Phase Reaction
- Example 12-1 Isomerization of Normal Butane with Heat Exchange
- Example 12-2 Production of Acetic Anhydride
- Example 12-2 AspenTech Formulation
- Example 12-4 CSTR with Cooling Coil
- Example 12-5 Parallel Reaction in a PFR with Heat Effects
- Example 12-6 Multiple Reactions in a CSTR
- Example 12-7 Complex Reactions
- Example R12-1 Industrial Oxidation of SO2
- Example 12-T12-3 PBR with Variable Coolant Temperature, Ta

• Professional Reference Shelf
R12.1. Runaway in CSTRs and Plug-Flow Reactors
Phase Plane Plots. We transform the temperature and concentration profiles into a phase plane. The trajectory going through the maximum of the “maxima curve” is considered to be critical and therefore is the locus of the critical inlet conditions for CA and T corresponding to a given wall temperature.
R12.2. Steady-State Bifurcation Analysis. In reactor dynamics, it is particularly important to find out if multiple stationary points exist or if sustained oscillations can arise.
R12.3. Heat Capacity as a Function of Temperature. Combining the heat of reaction with the quadratic form of the heat capacity,
CPi = αi + βiT + γiT2
we find that
![]()
Example 12-2 is reworked on the PRS for the case of variable heat capacities.
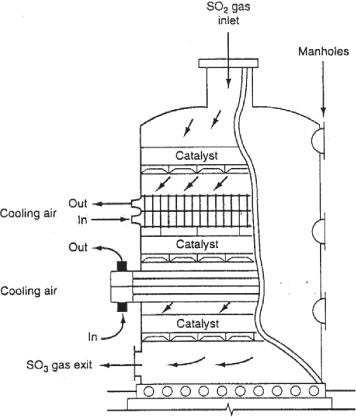
R12.4. Manufacture of Sulfuric Acid. The details of the industrial oxidation of SO2 are described. Here the catalyst quantities, the reactor configuration, and operating conditions are discussed, along with a model to predict the conversion and temperature profiles.

Questions and Problems
The subscript to each of the problem numbers indicates the level of difficulty: A, least difficult; D, most difficult.
![]()


In each of the questions and problems, rather than just drawing a box around your answer, write a sentence or two describing how you solved the problem, the assumptions you made, the reasonableness of your answer, what you learned, and any other facts that you want to include. See the Preface for additional generic parts (x), (y), and (z) to the home problems.
Read over the problems at the end of this chapter. Make up an original problem that uses the concepts presented in this chapter. To obtain a solution:
a. Make up your data and reaction.
b. Use a real reaction and real data. See Problem P4-1A for guidelines.
c. Prepare a list of safety considerations for designing and operating chemical reactors. (See www.sache.org and www.siri.org/graphics.) The August 1985 issue of Chemical Engineering Progress may be useful for part (c).
Load the following Polymath program from the DVD-ROM where appropriate:
a. Example 12-1. Safety. Suppose the value of the equilibrium constant and heat of reaction were measured incorrectly and were found to be KC = 1,000 mol/dm3 at 330 K and ΔHRx = –20,000 kJ/mol. (1) Redo Example 12-1 using these values. (2) Suppose that a second highly exothermic reaction takes place beginning at 400 K. Can any of the heat exchange systems studied here prevent reaching this 400 K temperature? If not, what conditions should be changed to prevent the runaway explosion? (3) Let Qg = rAΔHRx and Qr = Ua (T – Ta) and then plot Qg and Qr on the same figure as a function of V. (4) Vary the coolant flow rate (0 < ![]() < 2,000 kg/h) and the entering temperature 273 (K < T0 < 315 K) and describe what you find. (5) Vary some of the other parameters and see if you can find unsafe operating conditions. (6) Plot Qr and Ta as a function of V necessary to maintain isothermal operation.
< 2,000 kg/h) and the entering temperature 273 (K < T0 < 315 K) and describe what you find. (5) Vary some of the other parameters and see if you can find unsafe operating conditions. (6) Plot Qr and Ta as a function of V necessary to maintain isothermal operation.

b. Example 12-2. (1) Let Qg = rAΔHRx and Qr = Ua (T – Ta) and then plot Qg and Qr on the same figure as a function of V. (2) Fix the reactor volume at 0.5 m3 and the entrance conditions at (T0 = 1050 K, Ta0 = 1250 K) and then make a table, Xe, X, Ta, and T for each of the heat exchange cases, change the inlet conditions and determine which heat exchanger case gives the greatest differences in the conversion. (3) Repeat (2) for V = 5 m3. (4) Plot Qg, Qr, and –rA versus V for all four cases on the same figure and describe what you find. (5) For each of the four heat exchanger cases, investigate the addition of an inert I with a heat capacity of 50 J/mol · K, keeping FA0 constant, letting the other inlet conditions adjust accordingly (e.g., ε). (6) Vary the inert molar flow rate (i.e., ΘI, 0.0 < ΘI < 3.0 mol/s). Plot X and analyze versus ΘI. (7) Finally, vary the heat exchange fluid temperature Ta0 (1,000°F < Ta0 < 1350°F). Write a paragraph describing what you find noting any interesting profiles or results.
c. Example 12-2. AspenTech Formulation. Repeat P12-2(b) using AspenTech.
d. Example 12-3. Describe how your answers would change if the molar flow rate of methanol were increased by a factor of 4.
e. Example 12-4. Other data show ![]() Btu/lb-mol and CPA = 29 Btu/lb-mol/°F. How would these values change your results? Make a plot of conversion as a function of heat exchanger area. [0 < A < 200 ft2].
Btu/lb-mol and CPA = 29 Btu/lb-mol/°F. How would these values change your results? Make a plot of conversion as a function of heat exchanger area. [0 < A < 200 ft2].
f. Example 12-5. How would your results change if there is (1) a pressure drop with α = 1.05 dm–3? (2) Reaction (1) is reversible with KC = 10 at 450 K? (3) How would the selectivity change if Ua is increased? Decreased?
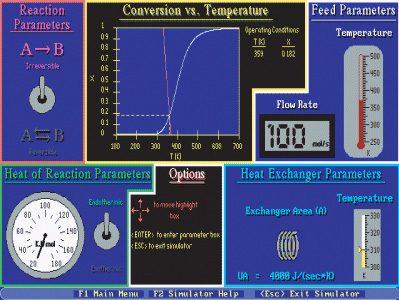
g. Example 12-6. (1) Vary T0 to make a plot of the reactor temperature, T, as a function of T0. What are the extinction and ignition temperatures? (2) Vary τ between 0.1 min and 0.001 min and describe what you find. (3) Vary Ua between 4,000 and 400,000 J/min/K and describe what you find.
h. Example 12-7. (1) Safety. Plot Qg and Qr as a function of V. How can you keep the maximum temperature below 700 K? Would adding inerts help and if so what should the flow rate be if CP1 = 10 cal/mol/K? (2) Look at the Figures. What happened to species D? What conditions would you suggest to make more species D? (3) Make a table of the temperature (e.g., maximum T, Ta) and molar flow rates at two or three volumes, comparing the different heat exchanger operations. (4) Why do you think the molar flow rate of C does not go through a maximum? Vary some of the parameters to learn if there are conditions where it goes through a maximum. Start by increasing FA0 by a factor of 5. (5) Include pressure in this problem. Vary the pressure drop parameter (0 < αρb < 0.0999 dm–3) and describe what you find.
i. DVD-ROM SO2 Example PRS-R12.4-1. Load the SO2 oxidation LEP R12-1. How would your results change if (1) the catalyst particle diameter were cut in half? (2) the pressure were doubled? At what particle size does pressure drop become important for the same catalyst weight, assuming the porosity doesn’t change? (3) you vary the initial temperature and the coolant temperature? Write a paragraph describing what you find.
j. SAChE. Go to the SAChE Web site, www.sache.org. On the left hand menu, select “SaChE Products.” Select “All” tab and go to the module entitled, “Safety, Health and the Environment” (S, H & E). The problems are for KINETICS (i.e., CRE). There are some example problems marked “K” and explanations in each of the above S, H & E selections. Solutions to the problems are in a different section of the site. Specifically look at: Loss of Cooling Water (K-1), Runaway Reactions (HT-1), Design of Relief Values (D-2), Temperature Control and Runaway (K-4), and (K-5), and Runaway and the Critical Temperature Region (K-7). Go through the K problems and write a paragraph on what you have learned. Your instructor or department chair should have the user name and password to enter the SAChE Web site in order to obtain the module with the problems.
Load the Polymath LEP 12-T12-3 for Table T12-2 from the DVD-ROM for this exothermic reversible reaction with a variable coolant temperature. The elementary reaction
![]()
has the following parameter values for the base case.

Vary the following parameters in the ranges shown in Parts (a) through (i). Write a paragraph describing the trends you find for each parameter variation and why they look the way they do. Use the base case for parameters not varied. [Hint: See Selftests and Workbook in the Chapter 12 Summary Notes on the DVD-ROM.]
a. FA0: 1 ≤ FA0 ≤ 8 mol/s
b. ΘI: 0.5 ≤ ΘI ≤ 4
*Note: The program gives ΘI = 1.0. Therefore, when you vary ΘI, you will need to account for the corresponding increase or decrease of CA0 because the total concentration, CT0, is constant.
c. ![]()
d. T0: 310 K ≤ T0 ≤ 350 K
e. Ta: 300 K ≤ Ta ≤ 340 K
f. ![]()
g. Repeat (f) for counter current coolant flow.
h. Determine the conversion in a 5,000 kg fluidized CSTR where UA = 500 cal/s·K with Ta = 320 K and ρb =2 kg/m3.
i. Repeat (a), (b), and (d) if the reaction were endothermic with Kc = 0.01 at 303 K and ![]() .
.
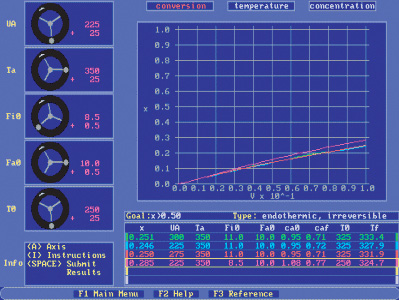
Load the Interactive Computer Games (ICG) from the DVD-ROM. Play the game, and then record your performance number for the module, which indicates your mastery of the material. Note: For simulation (b), only do the first three reactors, as Reactors 4 and above do not work.
a. ICG Heat Effects Basketball 1 Performance # ________________.
b. ICG Heat Effects Simulation 2 Performance # ________________.
Safety Problem The following is an excerpt from The Morning News, Wilmington, Delaware (August 3, 1977): “Investigators sift through the debris from blast in quest for the cause [that destroyed the new nitrous oxide plant]. A company spokesman said it appears more likely that the [fatal] blast was caused by another gas—ammonium nitrate—used to produce nitrous oxide.” An 83% (wt) ammonium nitrate and 17% water solution is fed at 200°F to the CSTR operated at a temperature of about 510°F. Molten ammonium nitrate decomposes directly to produce gaseous nitrous oxide and steam. It is believed that pressure fluctuations were observed in the system and, as a result, the molten ammonium nitrate feed to the reactor may have been shut off approximately 4 min prior to the explosion.
sAssume that at the time the feed to the CSTR stopped, there was 500 lbm of ammonium nitrate in the reactor. The conversion in the reactor is believed to be virtually complete at about 99.99%.
Additional information (approximate but close to the real case):

where M is the mass of ammonium nitrate in the CSTR (lbm) and k is given by the relationship below.

The enthalpies of water and steam are
Hw (200°F) = 168 Btu/lbm
Hg (500°F = 1202 Btu/lbm
a. Can you explain the cause of the blast? [Hint: See Problem P13-3B.]
b. If the feed rate to the reactor just before shutoff was 310 lbm of solution per hour, what was the exact temperature in the reactor just prior to shutdown? [Hint: Plot Qr and Qg as a function of temperature on the same plot.]
c. How would you start up or shut down and control such a reaction?
d. Explore this problem and describe what you find. [For example, add a heat exchanger UA (T – Ta), choose values of UA and Ta, and then plot R(T) versus G(T)?]
e. Discuss what you believe to be the point of the problem. The idea for this problem originated from an article by Ben Horowitz.
The endothermic liquid-phase elementary reaction
A + B → 2C
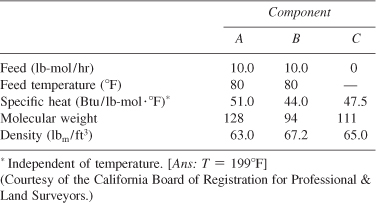
proceeds, substantially, to completion in a single steam-jacketed, continuous-stirred reactor (Table P12-6B). From the following data, calculate the steady-state reactor temperature:
![]()
Reactor volume: 125 gal
Steam jacket area: 10 ft2
Jacket steam: 150 psig (365.9°F saturation temperature)
Overall heat-transfer coefficient of jacket, U: 150 Btu/h·ft2·°F
Agitator shaft horsepower: 25 hp
Heat of reaction, ![]() Btu/lb-mol of A (independent of temperature)
Btu/lb-mol of A (independent of temperature)
Table P12-6B Feed Conditions and Properties
Use the data in Problem P11-3A for the following
Additional information
![]()
a. Calculate the conversion when the reaction is carried out adiabatically in one 500 dm3 CSTR and then compare the results with the two adiabatic 250 dm3 CSTRs in series.
The reversible reaction (Part (d) of P11-3A) is now carried out in a PFR with a heat exchanger. Plot and then analyze X, Xe, T, Ta, Qr, Qg, and the rate, –rA, for the following cases
b. Constant heat exchanger temperature Ta
c. Co-current heat exchanger Ta
d. Counter current heat exchanger Ta
e. Adiabatic operation
f. Make a table comparing all your results (e.g., X, Xe, T, Ta). Write a paragraph describing what you find.
g. Plot Qr and Ta as a function of V necessary to maintain isothermal operation.
For the reaction
A⇄B
and data in Problem P11-6B carry out the following. Plot and then analyze X, Xe, T, Ta, and the rate (–rA) profiles in a PFR for the following cases. In each case, explain why the curves look the way they do.
a. Co-current heat exchange
b. Counter current heat exchange
c. Constant heat exchanger temperature Ta
d. Compare and contrast each of the above results and the results for adiabatic operation (e.g., make a table of X and Xe obtained in each case).
e. Vary some of the parameters, e.g., (0 < ΘI < 10) and describe what you find.
f. Plot Qr and Ta as a function of V necessary to maintain isothermal operation.
Repeat Problem P11-7B with the reaction
![]()
Plot X, Xe, T, Ta and –rA down the length of the PFR for the following cases.
a. Co-current heat exchange
b. Counter current heat exchange
c. Constant Constant heat exchanger temperature Ta
d. Compare and contrast your results for (a), (b) and (c) along with those for adiabatic operation and write a paragraph describing what you find.
Use the data and reaction in Problem P11-3A for the following:
a. Plot and then analyze the conversion, Qr, Qg, and temperature profiles up to a PFR reactor volume of 10 dm3 for the case when the reaction is reversible with KC = 10 m3/kmol at 450 K. Plot and then analyze the equilibrium conversion profile.
b. Repeat (a) when a heat exchanger is added, Ua = 20 cal/m3/s/K, and the coolant temperature is constant at Ta = 450 K.
c. Repeat (b) for both a co-current and a counter current heat exchanger. The coolant flow rate is 50 g/s, CPc = 1 cal/g · K, and the inlet coolant temperature is Ta0 = 450 K. Vary the coolant rate ![]() .
.
d. Plot Qr and Ta as a function of V necessary to maintain isothermal operation.
e. Compare your answers to (a) through (d) and describe what you find. What generalizations can you make?
f. Repeat (c) and (d) when the reaction is irreversible but endothermic with ![]() . Choose Ta0 = 450 K.
. Choose Ta0 = 450 K.
Use the data in Problem P11-4A for the case when heat is removed by a heat exchanger jacketing the reactor. The flow rate of coolant through the jacket is sufficiently high that the ambient exchanger temperature is constant at Ta = 50°C.
a.
- Plot and then analyze the temperature conversion, Qr and Qg profiles for a PBR with

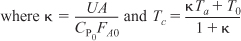
where
ϱb = bulk density of the catalyst (kg/m3) a
= heat-exchange area per unit volume of reactor (m2/m3) U
= overall heat-transfer coefficient (J/s·m2·K)
- How would the profiles change if Ua/ρb were increased by a factor of 3000?
- If there is a pressure drop with α = 0.019 kg–1?
b. Repeat part (a) for co-current and counter current flow and adiabatic operation with ![]() , CPC = 5,000 J/kg K and an entering coolant temperature of 50°C.
, CPC = 5,000 J/kg K and an entering coolant temperature of 50°C.
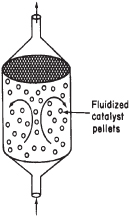
c. Find X and T for a “fluidized” CSTR [see margin] with 80 kg of catalyst.
![]()
d. Repeat parts (a) and (b) for W = 80.0 kg, assuming a reversible reaction with a reverse specific reaction rate of
![]()
Vary the entering temperature, T0, and describe what you find.
e. Use or modify the data in this problem to suggest another question or calculation. Explain why your question requires either critical thinking or creative thinking. See Preface B.2, B.3 and http://www.engin.umich.edu/scps.
Derive the energy balance for a packed bed membrane reactor. Apply the balance to the reaction in Problem P11-4B for the case when it is reversible with KC = 1.0 mol/dm3 at 300 K. Species C diffuses out of the membrane with kC = 1.5 s–1.
a. Plot and then analyze the concentration profiles for different values of KC when the reaction is carried out adiabatically.
b. Repeat part (a) when the heat transfer coefficient is Ua = 30 J/s·kg cat·K with Ta = 50·C.
The biomass reaction
![]()
is carried out in a 6 dm3 chemostat with a heat exchanger.
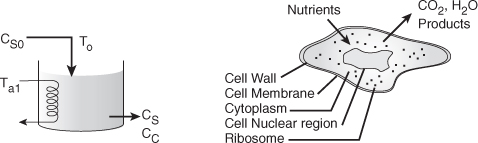
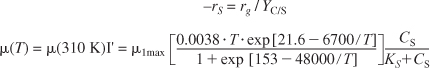
The volumetric flow rate is 1 dm3/h and the entering substrate concentration and temperature are 100 g/dm3 and 280 K, respectively. The temperature dependence of the growth rate follows that given by Aibe et al., Equation (9-63)
rg = μCc
and
a. Plot G(T) and R(T) for both adiabatic and non-adiabatic operation assuming a very large coolant rate (i.e., ![]() with A = 1.1 m2 and Ta = 290 K).
with A = 1.1 m2 and Ta = 290 K).
b. What is the heat exchanger area that should be used to maximize the exiting cell concentration for an entering temperature of 288 K? Cooling water is available at 290 K and up to a maximum flow rate of 1 kg/min.
c. Identify any multiple steady states and discuss them in light of what you learned in this chapter. [Hint: Plot Ts vs. T0 from Part (a).]
d. Vary To, ![]() , and Ta and describe what you find.
, and Ta and describe what you find.
Additional information
YC/S = 0.8 g cell/g substrate, CC = CS0 YC/S X
KS = 5.0 g/dm3
μ1max = 0.5h–1 (note μ = μmax at 310 K)
CPs = Heat capacity of substrate solution including all cells = 5 J/g/K
ms = Mass of substrate solution in chemostat = 6.0 kg
![]()
U = 50,000 J/h/K/m2
CPc = Heat capacity of cooling water 5 J/g/K
![]() = coolant flow rate (up to 60,000 kg/h)
= coolant flow rate (up to 60,000 kg/h)
ρS = solution density = 1 kg / dm3
Note:
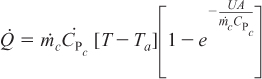
![]()
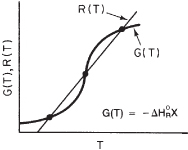
is carried out adiabatically in a CSTR. The “heat generated” [G(T)] and the “heat removed” [R(T)] curves are shown in Figure P12-14A.
Figure . Figure P12-14A Heat removed R(T) and heat “generated” G(T) curves.
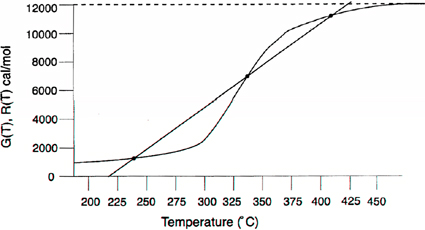
a. What is the ΔHRx of the reaction?
b. What are the inlet ignition and extinction temperatures?
c. What are all the corresponding temperatures in the reactor corresponding to the inlet ignition and extinction temperature?
d. What are the conversions at the ignition and extinction temperatures?
The first-order irreversible exothermic liquid-phase reaction
A → B
is to be carried out in a jacketed CSTR. Species A and an inert I are fed to the reactor in equimolar amounts. The molar feed rate of A is 80 mol/min.
Additional information

a. What is the reactor temperature for a feed temperature of 450 K?
b. Plot and then analyze the reactor temperature as a function of the feed temperature.
c. To what inlet temperature must the fluid be preheated for the reactor to operate at a high conversion? What are the corresponding temperature and conversion of the fluid in the CSTR at this inlet temperature?
d. Suppose that the fluid inlet temperature is now heated 5°C above the reactor temperature in part (c) and then cooled 20°C, where it remains. What will be the conversion?
e. What is the inlet extinction temperature for this reaction system? [Ans.: T0 = 87°C.]
The elementary reversible liquid-phase reaction
![]()
takes place in a CSTR with a heat exchanger. Pure A enters the reactor.
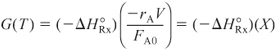
a. Derive an expression (or set of expressions) to calculate G(T) as a function of heat of reaction, equilibrium constant, temperature, and so on. Show a sample calculation for G(T) at T = 400 K.
b. What are the steady-state temperatures? [Ans.: 310, 377, 418 K.]
c. Which steady states are locally stable?
d. What is the conversion corresponding to the upper steady state?
e. Vary the ambient temperature Ta and make a plot of the reactor temperature as a function of Ta, identifying the ignition and extinction temperatures.
f. If the heat exchanger in the reactor suddenly fails (i.e., UA = 0), what would be the conversion and the reactor temperature when the new upper steady state is reached? [Ans.: 431 K.]
g. What heat exchanger product, UA, will give the maximum conversion?
h. Write a question that requires critical thinking and then explain why your question requires critical thinking. [Hint: See Preface Section B.2.]
i. What is the adiabatic blowout flow rate, υ0?
j. Suppose that you want to operate at the lower steady state. What parameter values would you suggest to prevent runaway, e.g., the upper SS?
Additional information
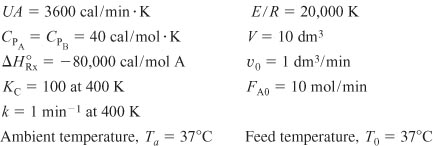
The first-order irreversible liquid-phase reaction
A → B
is to be carried out in a jacketed CSTR. Pure A is fed to the reactor at a rate of 0.5 g mol/min. The heat-generation curve for this reaction and reactor system,
![]()
is shown in Figure P12-17C.
Figure . Figure P12-17C G(T) curve.

a. To what inlet temperature must the fluid be preheated for the reactor to operate at a high conversion? [Ans.: T0 ≥ 214°C.]
b. What is the corresponding temperature of the fluid in the CSTR at this inlet temperature? [Ans.: Ts = 164°C, 184°C.]
c. Suppose that the fluid is now heated 5°C above the temperature in part (a) and then cooled 10°C, where it remains. What will be the conversion? [Ans.: X = 0.9.]
d. What is the extinction temperature for this reaction system? [Ans.: T0 = 190°C.]
e. Write a question that requires critical thinking and then explain why your question requires critical thinking. [Hint: See Preface Section B.2.]
Additional information
The G(T) curve for this reaction is shown in Figure P12-17B
Heat of reaction (constant): –100 cal/mol A
Heat capacity of A and B: 2 cal/mol°C
UA: 1 cal/min·°C, Ambient temperature, Ta: 100°C
The reversible liquid phase reaction
A ⇄ B
is carried out in a 12 dm3 CSTR with heat exchange. Both the entering temperature, T0, and the heat exchange fluid, Ta, are at 330°K. An equal molar mixture of inerts and A enter the reactor.
a. What product of the heat transfer coefficient and heat exchange area would give the maximum conversion?
b. What is the maximum conversion?
Additional information
CPA = CPB = 100 cal/mol/K, CP1 = 150 cal/mol/K
FA0 = 10 mol/h, CA0 = 1 mol/dm3, υ0 = 10 dm3/h
ΔHRx = –42,000 cal/mol
K = 0.001 h–1 at 300K with E = 30,000 cal/mol
KC = 5,000,000 at 300K
The elementary gas phase reaction
2A ⇄ C
is carried out in a packed-bed reactor. Pure A enters the reactor at 450 K flow rate of 10 mol/s, and a concentration of 0.25 mol/dm3. The PBR contains 90 kg of catalyst and is surrounded by a heat exchanger for which cooling fluid is available at 500 K. Compare the conversion achieved for the four types of heat exchanger operation: adiabatic, constant Ta, co-current flow, and counter current flow.
Additional information
α = 0.019/kg cat.
Ua/ρb = 0.8 J/kg cat · s · K
![]()
CPC = 20 J/mol/K
FA0 = 10 mol/h
CA0 = 1 mol/dm3
υ0 = 10 dm3/h
A reaction is to be carried out in the packed-bed reactor shown in Figure P12-20C.
Figure . Figure P12-20C PFR with heat exchange.

The reactants enter in the annular space between an outer insulated tube and an inner tube containing the catalyst. No reaction takes place in the annular region. Heat transfer between the gas in this packed-bed reactor and the gas flowing counter currently in the annular space occurs along the length of the reactor. The overall heat-transfer coefficient is 5 W/m2·K. Plot the conversion and temperature as a function of reactor length for the data given in
a. Problem P11-3A.
b. Problem P12-10B(a).

The irreversible liquid-phase reactions
![]()
are carried out in a PFR with heat exchange. The following temperature profiles were obtained for the reaction and the coolant stream.
Figure . Figure P12-21B Reactant temperature T and coolant temperature Ta profiles.

The concentrations of A, B, C, and D were measured at the point down the reactor where the liquid temperature, T, reached a maximum, and they were found to be CA = 0.1, CB = 0.2, CC = 0.5, and CD = 1.5 all in mol/dm3. The product of the overall heat-transfer coefficient and the heat-exchanger area per unit volume, Ua, is 10 cal/s · dm3 · K. The feed is equal molar in A and B, and the entering molar flow rate of A is 10 mol/s.

a. What is the activation energy for Reaction (1)?
The elementary liquid phase reactions
![]()
![]()
are carried out adiabatically in a 10 dm3 PFR. After streams A and B mix, species A enters the reactor at a concentration of CA0 = 2 mol/dm3 and species B at a concentration of 4 mol/dm3. The entering volumetric flow rate is 10 dm3/s.
Assuming you could vary the entering temperature between 300K and 600 K, what entering temperture would you recommend to maximize the concentration of species C exiting the reactor? (±25°K). Assume all species have the same density.
Additional information

(Multiple reactions with heat effects) Xylene has three major isomers, m-xylene, o-xylene, and p-xylene. When o-xylene is passed over a Cryotite catalyst, the following elementary reactions are observed. The reaction to form p-xylene is irreversible:
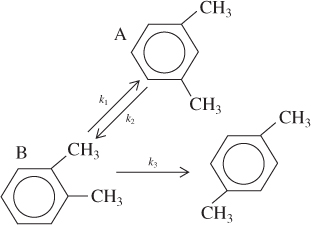
The feed to the reactor is equal molar in both m-xylene and o-xylene (species A and B respectively). For a total feed rate of 2 mol/min and the reaction conditions below, plot the temperature and the molar flow rates of each species as a function of catalyst weight up to a weight of 100 kg.
a. Find the lowest concentration of o-xylene achieved in the reactor.
b. Find the highest concentration of m-xylene achieved in the reactor.
c. Find the maximum concentration of o-xylene in the reactor.
d. Repeat parts (a) to (c) for a pure feed of o-xylene.
e. Vary some of the system parameters and describe what you learn.
f. What do you believe to be the point of this problem?
Additional information8
All heat capacities are virtually the same at 100 J/mol · K.

(Comprehensive Problem on multiple reactions with heat effects) Styrene can be produced from ethylbenzene by the following reaction:
![]()
However, several irreversible side reactions also occur:
![]()
![]()
[J. Snyder and B. Subramaniam, Chem. Eng. Sci., 49, 5585 (1994)]. Ethylbenzene is fed at a rate of 0.00344 kmol/s to a 10.0-m3 PFR (PBR), along with inert steam at a total pressure of 2.4 atm. The steam/ethylbenzene molar ratio is initially [i.e., parts (a) to (c)] 14.5:1 but can be varied.
Given the following data, find the exiting molar flow rates of styrene, benzene, and toluene along with ![]() for the following inlet temperatures when the reactor is operated adiabatically.
for the following inlet temperatures when the reactor is operated adiabatically.
a. T0 = 800 K
b. T0 = 930 K
c. T0 = 1100 K
d. Find the ideal inlet temperature for the production of styrene for a steam/ethylbenzene ratio of 58:1. [Hint: Plot the molar flow rate of styrene versus T0. Explain why your curve looks the way it does.]
e. Find the ideal steam/ethylbenzene ratio for the production of styrene at 900 K. [Hint: See part (d).]
f. It is proposed to add a counter current heat exchanger with Ua = 100 kJ/m3/min/K where Ta is virtually constant at 1000 K. For an entering stream to ethylbenzene ratio of 20, what would you suggest as an entering temperature? Plot the molar flow rates and ![]() .
.
g. What do you believe to be the major points of this problem?
h. Ask another question or suggest another calculation that can be made for this problem.
Additional information

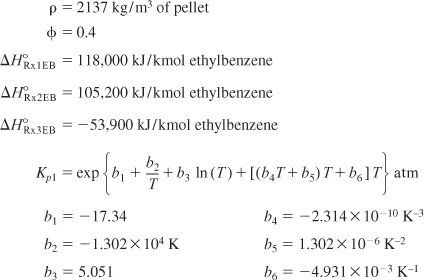
The kinetic rate laws for the formation of styrene (St), benzene (B), and toluene (T), respectively, are as follows (EB = ethylbenzene).
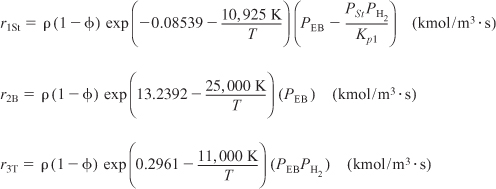
The temperature T is in Kelvin and Pi is in atm.
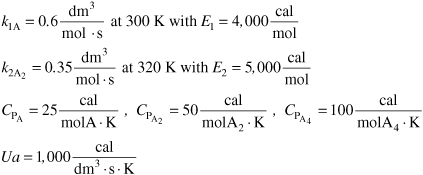
The liquid phase dimer-quadmer series addition reaction
4A → 2A2 → A4
can be written as
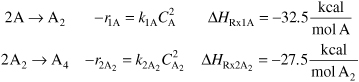
and is carried out in a 10 dm3 PFR. The mass flow rate through the heat exchanger surrounding the reactor is sufficiently large so that the ambient temperature of the exchanger is constant at Ta = 315 K. The reactants enter at a temperature T0, of 300 K. Pure A is fed to the rector at a volumetric flow rate of 50 dm3/s and a concentration of 2 mol/dm3.
a. Plot, compare, and analyze the profiles FA, FA2, and FA4, down the length of the reactor up to 10 dm3.
b. The desired product is A2 and it has been suggested that the current reactor may be too large. What reactor volume would you recommend to maximize FA2?
c. What operating variables (e.g., T0, Ta) would you change and how would you change to make the reactor volume as small as possible and still to maximize FA2? Note any opposing factors in maximum production of A2. The ambient temperature and the inlet temperature must be kept between 0°C and 177°C.
Additional information
Turn in your recommendation of reactor volume to maximize FA2 and the molar flow rate at this maximum.
The gas phase trimer-hexamer series addition reaction
6A → 2A3 → A6
can be written as
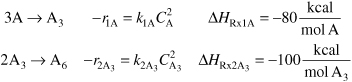
and is carried out in a 10 dm3 CSTR with heat exchanger. The mass flow rate through the heat exchange surrounding the reactor is sufficiently large. The ambient temperature of the exchanger is constant at Ta = 315 K and the entering temperature T0 is 300K. Pure A is fed to the rector at a volumetric flow rate of 50 dm3/s and a concentration of 2 mol/dm3. Find FA, FA3, FA6, and T exiting the reactor.
Additional information

• DVD-ROM Complete Data Set
The TAME data set is given on the DVD-ROM. This problem is a very comprehensive problem; perhaps it can be used as a term (semester) problem.
• Good Alternative Problems (GA) on the DVD-ROM, Similar to the Above DVD Problems
Supplementary Reading
- An excellent development of the energy balance is presented in
ARIS, R., Elementary Chemical Reactor Analysis. Upper Saddle River, N.J.: Prentice Hall, 1969, Chaps. 3 and 6.
- Safety
CENTER FOR CHEMICAL PROCESS SAFETY (CCPS), Guidelines for Chemical Reactivity Evaluation and Application to Process Design, New York: American Institute of Chemical Engineers (AIChE) 1995.
CROWL, DANIEL A., and JOSEPH F. LOUVAR, Chemical Process Safety: Fundamentals with Applications, Second Edition. Upper Saddle River, NJ: Prentice Hall, 2001.
MELHEM, G. A., and H. G. FISHER, International Symposium on Runaway Reactions and Pressure Relief Design, New York: Center for Chemical Process Safety (CCPS) of the American Institute of Chemical Engineers (AIChE) and The Institution of Chemical Engineers, 1995.
See the Center for Chemical Process Safety (CCPS) Web site, www.aiche.org/ccps.
- A number of example problems dealing with nonisothermal reactors can be found in
FROMENT, G. F., and K. B. BISCHOFF, Chemical Reactor Analysis and Design, 2nd ed. New York: Wiley, 1990.
WALAS, S. M., Chemical Reaction Engineering Handbook of Solved Problems. Amsterdam: Gordon and Breach, 1995. See the following solved problems: Problem 4.10.1, page 444; Problem 4.10.08, page 450; Problem 4.10.09, page 451; Problem 4.10.13, page 454; Problem 4.11.02, page 456; Problem 4.11.09, page 462; Problem 4.11.03, page 459; Problem 4.10.11, page 463.
- A review of the multiplicity of the steady state and reactor stability is discussed by
PERLMUTTER, D. D., Stability of Chemical Reactors. Upper Saddle River, N.J.: Prentice Hall, 1972.
- The heats of formation, Hi(T), Gibbs free energies, Gi(TR), and the heat capacities of various compounds can be found in
GREEN, DON W., and ROBERT H. PERRY, Perry’s Chemical Engineers’ Handbook, 8th Edition (Chemical Engineers Handbook). New York: McGraw-Hill, 2008.
LIDE DAVID R., CRC Handbook of Chemistry and Physics, 90th Edition. Boca Raton, FL: CRC Press, 2009.
- Other Reading.
BURGESS, THORNTON W., The Adventures of Jerry Muskrat. New York: Dover Publications, Inc., 1914.