
Why is there an activation energy?
If the reactants are free radicals that essentially react immediately on collision, there usually isn’t an activation energy. However, for most atoms and molecules undergoing reaction, there is an activation energy. A couple of the reasons are that in order to react:
- The molecules need energy to distort or stretch their bonds so that they break and now can form new bonds.
- The molecules need energy to overcome the steric and electron repulsive forces as they come close together.
The activation energy can be thought of as a barrier to energy transfer (from kinetic energy to potential energy) between reacting molecules that must be overcome. The activation is the minimum increase in potential energy of the reactants that must be provided to transform the reactants into products. This increase can be provided by the kinetic energy of the colliding molecules. One way to view the barrier to a reaction is through the use of the reaction coordinates. These coordinates denote the minimum potential energy of the system as a function of the progress along the reaction path as we go from reactants to an intermediate to products. For the exothermic reaction
![]()
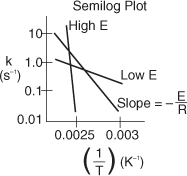
the reaction coordinate is shown in Figure 3-1. Here EA, EB, EAB and EBC are the energies of molecules A, B, AB and BC and EABC is the energy of the complex A–B–C at the top of the barrier.
Figure 3-1. Progress along reaction path. (a) Symbolic reaction; (b) Calculated from computational software on the DVD-ROM Chapter 3 Web Module.
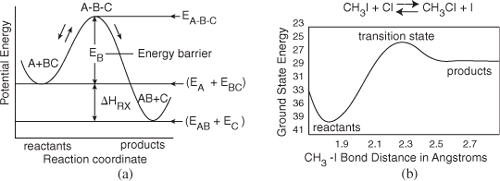
Figure 3-1(a) shows the potential energy of the three atom (or molecule) system, A, B, and C, as well as the reaction progress as we go from reactants A and BC to products AB and C. Initially A and BC are far apart and the system energy is just the bond energy BC. At the end of the reaction, the products AB and C are far apart, and the system energy is the bond energy AB. As we move along the reaction coordinate (x-axis) to the right in Figure 3-1(a), the reactants A and BC approach each other, the BC bond begins to break, and the energy of the reaction pair increases until the top of the barrier is reached. At the top, the transition state is reached where the intermolecular distances between A and B and between B and C are essentially equal (i.e., A–B–C). As a result, the potential energy of the initial three atoms (molecules) is high. As the reaction proceeds further, the distance between A and B decreases, and the AB bond begins to form. As we proceed further, the distance between AB and C increases and the energy of the reacting pair decreases to that of the AB bond energy. The calculations to arrive at Figure 3-1(b) are discussed in the DVD-ROM web module, and transition state theory is discussed in the DVD-ROM Professional Reference Shelf R3.2 Transition State Theory for the real reaction ![]() .
.

We see that for the reaction to occur, the reactants must overcome an energy barrier, EB, shown in Figure 3-1. The energy barrier, EB, is related to the activation energy, E. The energy barrier height, EB, can be calculated from differences in the energies of formation of the transition state molecule and the energy of formation of the reactants, that is,
![]()

The energy of formation of the reactants can be found in the literature, while the energy of formation of the transition state can be calculated from quantum mechanics using a number of software packages, such as Gaussian (http://www.gaussian.com/) and Dacapo (https://wiki.fysik.dtu.dk/dacapo). The activation energy, E, is often approximated by the barrier height, which is a good approximation in the absence of quantum mechanical tunneling.
Now that we have the general idea for a reaction coordinate, let’s consider another real reaction system:
H· + C2H6 → H2 + C2H5·
The energy-reaction coordinate diagram for the reaction between a hydrogen atom and an ethane molecule is shown in Figure 3.2 where the bond distortions, breaking, and forming are identified.

One can also view the activation energy in terms of collision theory (Professional Reference Shelf R3.1). By increasing the temperature, we increase the kinetic energy of the reactant molecules. This kinetic energy can in turn be transferred through molecular collisions to internal energy to increase the stretching and bending of the bonds, causing them to reach an activated state, vulnerable to bond breaking and reaction (cf. Figures 3-1 and 3-2).
Figure 3-2. A diagram of the orbital distortions during the reaction
H • + CH3CH3 → H2 + CH2CH3 •
The diagram shows only the interaction with the energy state of ethane (the C–H bond). Other molecular orbitals of the ethane also distort.

Courtesy of R. Masel, Chemical Kinetics and Catalysis (Wiley, 2001), p. 594.
The energy of the individual molecules falls within a distribution of energies where some molecules have more energy than others. One such distribution is shown in Figure 3-3 where f(E,T) is the energy distribution function for the kinetic energies of the reacting molecules. It is interpreted most easily by recognizing the product (f · dE) as the fraction of molecular collisions that have an energy between E and (E + dE). For example, in Figure 3-3, the fraction of collisions that have energies between 5 and 6 kcal is 0.083, as shown by the shaded area on the left. The activation energy has been equated with a minimum energy that must be possessed by reacting molecules before the reaction will occur. The fraction of the molecular collisions that have an energy EA or greater is shown by the shaded areas at the right in Figure 3-3. The molecules in this shaded area have sufficient kinetic energy to cause bonds to break and reaction to occur. One notes as temperature is increased (T2 > T1) the shaded area increases indicating the number of molecules that have sufficient energy to react increases as does the rate of reaction, –rA.
Figure 3-3. Energy distribution of reacting molecules.

Postulation of the Arrhenius equation, Equation (3-18), remains the greatest single step in chemical kinetics, and retains its usefulness today, more than a century later. The activation energy, E, is determined experimentally by measuring the reaction rate at several different temperatures. After taking the natural logarithm of Equation (3-18), we obtain
![]()
We see that the activation energy can be found from a plot of ln kA as a function of (1/T) which is called an Arrhenius plot. The larger the activation energy, the more temperature sensitive the reaction. That is, for large E, an increase in just a few degrees in temperature can greatly increase k and thus increase the rate of reaction.
Figure 3-4. Calculation of the activation energy from an Arrhenius plot.
Example 3-1. Determination of the Activation Energy
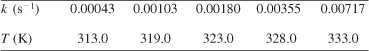
Calculate the activation energy for the decomposition of benzene diazonium chloride to give chlorobenzene and nitrogen
using the information in Table E3-1.1 for this first-order reaction.
We start by recalling Equation (3-20)
![]()

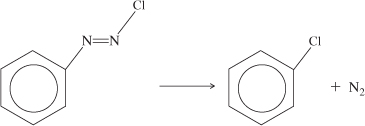
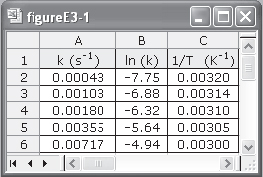
We can use the data in Table E3-1.1 to determine the activation energy, E, and frequency factor, A, in two different ways. One way is to make a semilog plot of k vs. (1/T) and determine E from the slope (–E/R) of an Arrhenius plot. Another way is to use Excel or Polymath to regress the data. The data in Table E3-1.1 was entered in Excel and is shown in Figure E3-1.1, which was then used to obtain Figure E3-1.2.
Figure E3-1.1. Excel spreadsheet.
A step-by-step tutorial to construct both an Excel and a Polymath spreadsheet is given in the Chapter 3 Summary Notes on the DVD-ROM.
![]()
Figure E3-1.2. (a) Excel semilog plot; (b) Excel normal plot after taking ln(k).

The equation for the best fit of the data
![]()
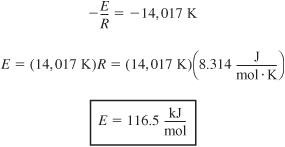
is also shown in Figure E3-1.2(b). From the slope of the line given in Figure 3-1.2(b) and Equation (3-20), we obtain
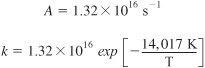
From Figure E3-1.2(b) and Equation (E3-1.1), we see
In A = 37.12
Taking the antilog we find the frequency factor to be
Analysis: The activation energy, E, and frequency factor, A, can be calculated if we know the specific reaction rate, k, at two temperatures, T1 and T2. We can either use the Arrhenius Equation (3-18) twice, once at T1 and once at T2, to solve two equations for the two unknowns, A and E, or we can take the slope of a plot of (ln k) as a function of (1/T); the slope will be equal to (–E/R).
There is a rule of thumb that states that the rate of reaction doubles for every 10°C increase in temperature. However, this rule is true only for specific combinations of activation energies and temperatures. For example, if the activation energy is 53.6 kJ/mol, the rate will double only if the temperature is raised from 300 K to 310 K. If the activation energy is 147 kJ/mol, the rule will be valid only if the temperature is raised from 500 K to 510 K. (See Problem P3-7B for the derivation of this relationship.)

The larger the activation energy, the more temperature-sensitive is the rate of reaction. While there are no typical values of the frequency factor and activation energy for a first-order gas-phase reaction, if one were forced to make a guess, values of A and E might be 1013 s–1 and 100 kJ/mol. However, for families of reactions (e.g., halogenation), a number of correlations can be used to estimate the activation energy. One such correlation is the Polanyi-Semenov equation, which relates activation energy to the heat of reaction (see Professional Reference Shelf 3.1). Another correlation relates the activation energy to differences in bond strengths between products and reactants.4 While the activation energy cannot be currently predicted a priori, significant research efforts are under way to calculate activation energies from first principles.5
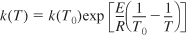
One final comment on the Arrhenius equation, Equation (3-18). It can be put in a most useful form by finding the specific reaction rate at a temperature T0, that is,
k(T0) = Ae–E/RI0
and at a temperature T
k(T) = Ae–E/RI
and taking the ratio to obtain
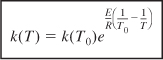
This equation says that if we know the specific reaction rate k(T0) at a temperature, T0, and we know the activation energy, E, we can find the specific reaction rate k(T) at any other temperature, T, for that reaction.
3.4 Present Status of Our Approach to Reactor Sizing and Design
In Chapter 2, we combined the different reactor mole balances with the definition of conversion to arrive at the design equation for each of four types of reactors, as shown in Table 3-2. Next we showed that if the rate of disappearance is known as a function of the conversion X:
–rA = g(X)

Where are we?
then it is possible to size CSTRs, PFRs, and PBRs operated at the same conditions under which –rA = g(X) was obtained.

In general, information in the form –rA = g (X) is not available. However, we have seen in Section 3.2 that the rate of disappearance of A, –rA, is normally expressed in terms of the concentration of the reacting species. This functionality,
![]()
is called a rate law. In Chapter 4, we show how the concentration of the reacting species may be written in terms of the conversion X,
![]()
 and then we can design isothermal reactors
With these additional relationships, one observes that if the rate law is given and the concentrations can be expressed as a function of conversion, then in fact we have –rA as a function of X and this is all that is needed to evaluate the isothermal design equations. One can use either the numerical techniques described in Chapter 2, or, as we shall see in Chapter 5, a table of integrals, and/or software programs (e.g., Polymath).
Closure. Having completed this chapter, you should be able to write the rate law in terms of concentration and the Arrhenius temperature dependence. We have now completed the first two basic building blocks in our algorithm to study isothermal chemical reactions and reactors.

In Chapter 4, we focus on the third building block, Stoichiometry, as we use the stoichiometric table to write the concentrations in terms of conversion to finally arrive at a relationship between the rate of reaction and conversion.
• Mole Balance, Ch 1
• Rate Law, Ch 3
• Stoichiometry, Ch 4
• Combine, Ch 5
• Evaluate, Ch 5
• Energy Balance, Ch 11
Summary
- Relative rates of reaction for the generic reaction:
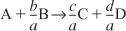
The relative rates of reaction can be written either as
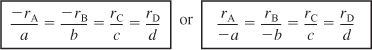
- Reaction order is determined from experimental observation:
The reaction in Equation (S3-3) is α order with respect to species A and β order with respect to species B, whereas the overall order, n, is (α + β). If α = 1 and β = 2, we would say that the reaction is first order with respect to A, second order with respect to B, and overall third order. We say a reaction follows an elementary rate law if the reaction orders agree with the stoichiometric coefficients for the reaction as written.
Examples of reactions that follow an elementary rate law
Irreversible reactions
First order

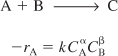
Second order

Reversible reactions
Examples of reactions that follow nonelementary rate laws
Homogeneous

Heterogeneous reactions

- The temperature dependence of a specific reaction rate is given by the Arrhenius equation,

where A is the frequency factor and E the activation energy.
If we know the specific reaction rate, k, at a temperature, T0, and the activation energy, we can find k at any temperature, T,
Similarly from Appendix C, Equation (C-9), if we know the partial pressure equilibrium constant KP at a temperature, T1, and the heat of reaction, we can find the equilibrium constant at any other temperature

DVD-ROM Material
• Learning Resources
- Summary Notes for Chapter 3
- Web Modules
A. Cooking a Potato
Chemical reaction engineering is applied to cooking a potato

with
k = Ae–E/RT

B. Molecular Reaction Engineering
Molecular simulators (e.g., Gaussian) are used to make predictions of the activation energy.
• Frequently Asked Questions
• Professional Reference Shelf
R3.1.
Collision Theory
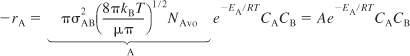
In this section, the fundamentals of collision theory
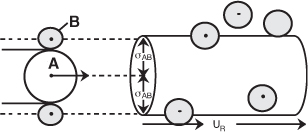
Schematic of collision cross section for A colliding with B
A + B → C + D
to arrive at the following rate law
The activation energy, EA, can be estimated from the Polanyi equation
![]()
R3.2.
Transition State Theory
In this section, the rate law and rate law parameters are derived for the reaction
A + BC ⇄ ABC# → AB + C
using transition state theory. [Graduate-level material.]
R3.3. Molecular Dynamics
The reaction trajectories are calculated to determine the reaction cross section of the reacting molecules. The reaction probability is found by counting up the number of reactive trajectories after Karplus.6 [Graduate-level material.]
Questions and Problems

The subscript to each of the problem numbers indicates the level of difficulty: A, least difficult; D, most difficult.
![]()
a. List the important concepts that you learned from this chapter. What concepts are you not clear about?
b. Explain the strategy to evaluate reactor design equations and how this chapter expands on Chapter 2.
c. Choose a FAQ from Chapters 1 through 3 and say why it was the most helpful.
d. Listen to the audios ![]() on the DVD-ROM. Select a topic and explain it.
on the DVD-ROM. Select a topic and explain it.
e. Read through the Self Tests and Self Assessments in Chapters 1 through 3 in the Summary Notes on the DVD-ROM. Select one and critique it.
f. Which example on the DVD-ROM Summary Notes for Chapters 1 through 3 was most helpful?
a. Example 3-1. Make a plot of k versus T and ln k versus (1/T) for E = 240 kJ/mol and for E = 60 kJ/mol. (1) Write a couple of sentences describing what you find. (2) Next write a paragraph describing the activation, how it affects chemical reaction rates, and what its origins are.
b. Collision Theory—Professional Reference Shelf. Make an outline of the steps that were used to derive
–rA = Ae–E/RT CACB
c. The rate law for the reaction ![]() with kA = 25(dm3/mol)2/s. What are kB and kC?
with kA = 25(dm3/mol)2/s. What are kB and kC?
Molecular collision energies—refer to Figure 3-3.
a. What fraction of molecular collisions have energies less than or equal to 35 kcal at 300 K? 500 K?
b. What fraction of molecular collisions have energies between 10 and 20 kcal at T 300 K? at T = 500K?
c. What fraction of molecular collisions have energies greater than the activation energy EA = 25 kcal at T 300 K? at T = 500K?
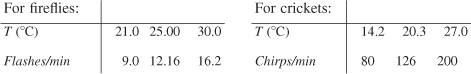
The frequency of flashing of fireflies and the frequency of chirping of crickets as a function of temperature follow. [J. Chem. Educ., 5, 343 (1972) Reprinted by permission.]

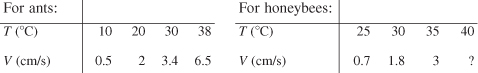
The running speed of ants and the flight speed of honeybees as a function of temperature are given below. [Source: B. Heinrich, The Hot-Blooded Insects (Cambridge, Mass.: Harvard University Press, 1993).]
a. What do the firefly and cricket have in common? What are their differences?
b. What is the velocity of the honeybee at 40°C? At –5°C?
c. Do the bees, ants, crickets, and fireflies have anything in common? If so, what is it? You may also do a pairwise comparison.
d. Would more data help clarify the relationships among frequency, speed, and temperature? If so, in what temperature should the data be obtained? Pick an insect, and explain how you would carry out the experiment to obtain more data. [For an alternative to this problem, see CDP3-AB.]
Troubleshooting. Corrosion of high-nickel stainless steel plates was found to occur in a distillation column used at DuPont to separate HCN and water. Sulfuric acid is always added at the top of the column to prevent polymerization of HCN. Water collects at the bottom of the column and HCN at the top. The amount of corrosion on each tray is shown in Figure P3-5B as a function of plate location in the column.
Figure . Figure P3-5B Corrosion in a distillation column

The bottom-most temperature of the column is approximately 125°C and the topmost is 100°C. The corrosion rate is a function of temperature and the concentration of an HCN–H2SO4 complex. Suggest an explanation for the observed corrosion plate profile in the column. What effect would the column operating conditions have on the corrosion profile?
Inspector Sgt. Ambercromby of Scotland Yard. It is believed, although never proven, that Bonnie murdered her first husband, Lefty, by poisoning the tepid brandy they drank together on their first anniversary. Lefty was unware she had coated her glass with an antidote before she filled both glasses with the poisoned brandy. Bonnie married her second husband, Clyde, and some years later when she had tired of him, she called him one day to tell him of her new promotion at work and to suggest that they celebrate with a glass of brandy that evening. She had the fatal end in mind for Clyde. However, Clyde suggested that instead of brandy, they celebrate with ice cold Russian vodka and they down it Cossack style, in one gulp. She agreed and decided to follow her previously successful plan and to put the poison in the vodka and the antidote in her glass. The next day, both were found dead. Sgt. Ambercromby arrives. What are the first three questions he asks? What are two possible explanations? Based on what you learned from this chapter, what do you feel Sgt. Ambercromby suggested as the most logical explanation?
[Professor Flavio Marin Flores, ITESM, Monterrey, Mexico]
[Hint: View the YouTube video (www.youtube.com) made by the chemical reaction engineering students at the University of Alabama, entitled The Black Widow. Type in “chemicalreactor” to narrow your search. You can also access it directly from a link in Chapter 3 Summary Notes on the Web site (www.umich.edu/~essen), scroll down until you find the Black Widow video.]
Activation Energy
a. The rule of thumb that the rate of reaction doubles for a 10°C increase in temperature occurs only at a specific temperature for a given activation energy. Develop a relationship between the temperature and activation energy for which the rule of thumb holds. Neglect any variation of concentration with temperature.
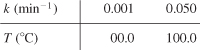
b. Determine the activation energy and frequency factor from the following data:
c. Write a paragraph explaining activation energy, E, and how it affects the chemical reaction rate. Refer to Section 3.3 and especially the Professional Reference Shelf sections R3.1, R3.2, and R3.3 if necessary.
The initial reaction rate for the elementary reactor
2A + B → 4C
was measured as a function of temperature when the concentration of A was 2 M and that B was 1.5 M.
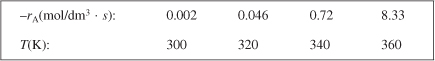
a. What is the activation energy?
b. What is the frequency factor?
c. What is the rate constant as a function of temperature using T = 300K as the base case?
Hot Potato. Review the “Cooking a Potato” web module on the DVD-ROM or on the Web.
a. It took the potato described on the Web 1 hour to cook at 350°F. Bob the Builder suggests that the potato can be cooked in half that time if the oven temperature is raised to 600°F. What do you think?
b. Buzz Lightyear says, “No Bob,” and suggests that it would be quicker to boil the potato in water at 100°C because the heat transfer coefficient is 20 times greater. What are the tradeoffs of oven versus boiling?
[Hint: View the YouTube video (www.youtube.com) made by the chemical reaction engineering students at the University of Alabama, entitled Baking a Potato by Bob the Builder and Friends. Type in “chemicalreactor” to narrow your search. You can also access it directly from a link in Chapter 3 Summary Notes on the Web site at www.umich.edu/~essen.]
a. Write the rate law for the following reactions assuming each reaction follows an elementary rate law.
a. Write the rate law for the reaction
2A + B → C
if the reaction
- is second order in B and overall third order,
- is zero order in A and first order in B,
- is zero order in both A and B, and
- is first order in A and overall zero order.
b. Find and write the rate laws for the following reactions
- H2 + Br2 → 2HBr
- H2 + I2 → 2HI

The rate laws for each of the reactions listed below were obtained at low temperatures. The reactions are highly exothermic and therefore reversible at high temperatures. Suggest a rate law for each of the reactions [(a), (b) and (c)] at high temperatures.
a. The reaction
A → B
is irreversible at low temperatures and the rate law is
–rA = kCA
A + 2B → 2D
is irreversible at low temperatures and the rate law is
–rA = kCA1/2 CB
c. The gas-solid catalyzed reaction
![]()
is irreversible at low temperatures and the rate law is
![]()
In each case, make sure that the rate laws at high temperatures are thermodynamically consistant at equilibrium (cf. Appendix C).
Data on the tenebrionid beetle whose body mass is 3.3 g show that it can push a 35-g ball of dung at 6.5 cm/s at 27°C, 13 cm/s at 37°C, and 18 cm/s at 40°C.
a. How fast can it push dung at 41.5°C? [B. Heinrich. The Hot-Blooded Insects (Cambridge, Mass.: Harvard University Press, 1993).]

b. Apply one or more of the six ideas in Table P-3, page xiii to this problem.
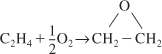
In the homogeneous gas-phase reaction
![]()
What is the relationship between rCH4 and rO2?
- rCH4 = rO2
- Cannot tell without the data
-

-

- None of the above
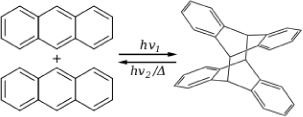
Solar Chemical Energy Storage. The major ways to utilize, capture or store the sun’s energy are solar thermal (see P8-14B), solar voltaic, biomass conversion, solar water splitting (P10-11B), and solar chemical. Solar chemical refers to processes that harness and store solar energy by adsorbing light in a reversible chemical reaction http://en.wikipedia.org/wiki/Solar_chemical. For example, the photodimerization of anthracene absorbs and stores solar energy that can be released when the reverse reaction takes place.
Figure P3-15.1. Anthracene dimerisation.
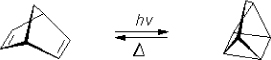
Another reaction of interest is the Norbornadiene–Quadricyclane (NQ) couple, where solar energy is adsorbed and stored in one direction and released in the other.
Figure P3-15.2. The Norbornadiene–Quadricyclane (NQ) couple is of potential interest of sunlight energy storage.
a. Suggest a rate law for the reversible photodimerization of anthracene.
b. Suggest a rate law for the reversible storage of energy by the NQ couple.
What five things are wrong with this solution?
The reaction
2A + B → C
follows an elementary law. At 50°C the specific reaction rate constant is 10(m3/mol)2/s with an activation energy of 400J/mol. What is the rate of reaction at 100°C when the concentrations of A and B are 2 and 4 moles/m3 respectively?
Solution
In order to completely consume a 4 molar solution of B would require an 8 molar concentration of A. Because the initial concentration of A is only 2 molar, A is the limiting reactant. Thus we choose A as our basis of calculation and divide by its stoichiometic coefficient of A, to get
![]()
because the reaction follows an elementary rate law
![]()
Converting the rate constant at 50°C to k at 100°C
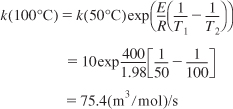
Substituting for k, CA and CB
![]()
• Additional Homework Problems on DVD-ROM
Temperature Effects
CDP3-AB
Use the Polanyi equation to calculate activation energies. [ECRE, 3rd Ed. P3-20B.]

Supplementary Reading
- Two references relating to the discussion of activation energy have already been cited in this chapter. Activation energy is usually discussed in terms of either collision theory or transition-state theory. A concise and readable account of these two theories can be found in
BURGESS, THORNTON W., The Adventures of Reddy Fox, New York: Dover Publications, Inc., 1913.
LAIDLER, K. J. Chemical Kinetics. New York: Harper & Row, 1987, Chap. 3.
MASEL, R., Chemical Kinetics and Catalysis, New York: Wiley, 2001, p. 594.
- The books listed above also give the rate laws and activation energies for a number of reactions; in addition, as mentioned earlier in this chapter, an extensive listing of rate laws and activation energies can be found in NBS circulars.
Kinetic data for a larger number of reactions can be obtained on floppy disks and CD-ROMs provided by National Institute of Standards and Technology (NIST). Standard Reference Data 22l/A320 Gaithersburg, MD 20899; ph: (301) 975-2208. Additional sources are Tables of Chemical Kinetics: Homogeneous Reactions, National Bureau of Standards Circular 510 (Sept. 28, 1951); Suppi. 1 (Nov. 14, 1956); Suppi. 2 (Aug. 5, 1960); Suppi. 3 (Sept. 15, 1961) (Washington, D.C.: U.S. Government Printing Office). Chemical Kinetics and Photochemical Data for Use in Stratospheric Modeling, Evaluate No. 10, JPL Publication 92-20, Aug. 15, 1992, Jet Propulsion Laboratories, Pasadena, Calif.
- Also consult the current chemistry literature for the appropriate algebraic form of the rate law for a given reaction. For example, check the Journal of Physical Chemistry in addition to the journals listed in Section 4 of the Supplementary Reading section in Chapter 4.