
Salesforce allows us to generate reports on different predefined formats based on business requirement. Salesforce offers four different report formats that you can use. They are as follows:
- Tabular
- Summary
- Matrix
- Joined
You can use this type of report to display a row of records in a table without any subtotal. Let's start with a business use case.
Say David Guzman is working as System Administrator at Universal Containers. As part of day-to-day admin activity, he has received a requirement from the management to create a report to list all the accounts that have at least one order record and each order record must have at least one related activities record.
Perform the following steps to create a custom report for the preceding business requirement:
- Navigate to the Reports tab and click on the New Report button.
- It will redirect you to a page where you have to select report types. In this case, select the
Accounts with Order and Activitiesreport type and then click on Create, as shown in the following screenshot: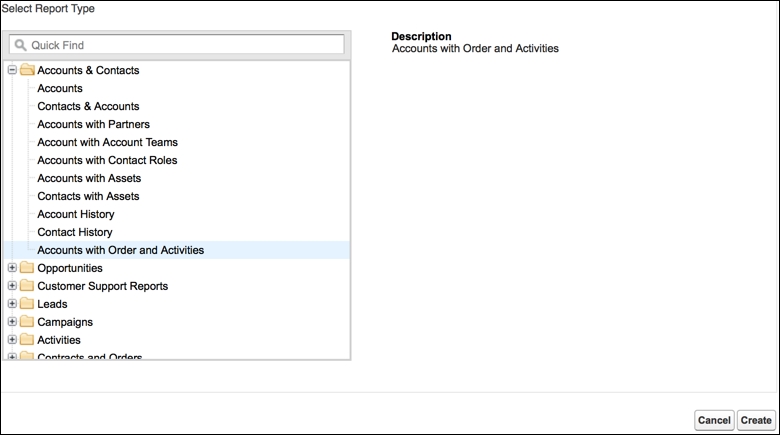
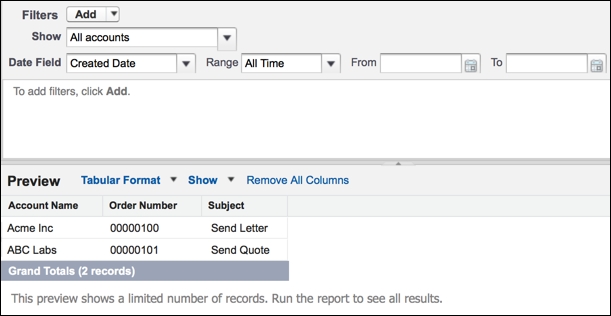
- It allows you to adjust the filter as you want. For the Date Field filter, select the Created date range, that is, All Time. At the end, the report will look like the following:
- Once you're done, click on Save. Make sure to save the report in the appropriate folder and also check the report folder sharing settings.
This type of report is used to display groupings of rows of data. Let's start with a business use case.
Say David Guzman is working as System Administrator at Universal Containers. He has received a requirement from the VP of Sales to create a custom report that would display only those accounts that do not have related contacts, and he or she wants you to group the result by account type.
Perform the following steps to create a custom report for the preceding business requirement:
- Navigate to the Reports tab and click on the New Report button.
- It will redirect you to a page where you have to select Report Types; in this case, select the Accounts report type and then click on Create.
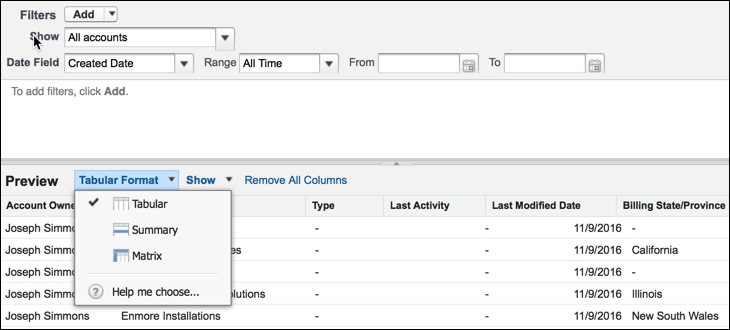
- The next step is to change the format. To do so, click on Tabular Format and select Summary, as shown in the following screenshot:
Cross filters allow us to filter the parent records in a report by their related child records, using the with or without condition.
- In the filters section, go to Add | Cross Filter.
- The next step is to select a parent object from the drop-down list. In this case, select the Account object.
- Then choose either with or without. In this case, select without.
- Then, select a child object from the drop-down list. Select Contacts in this case. The drop-down list will display all the eligible child objects of the Account object.
It will look like the following:

- Once you are done, click on OK.
- After applying the cross filter, your report will look like the following:

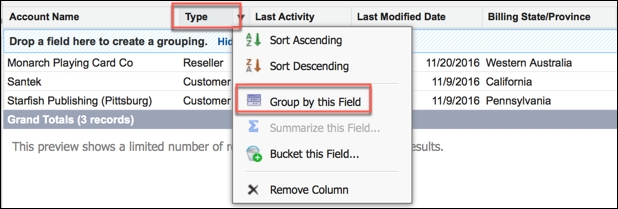
- The final step is to apply grouping based on Type. To do so, go to column
Type | Group by this Field, as shown in the following screenshot:
- Once you are done, click on Save.
- Save the report with the name
Account without Contactsin theUnfiled Public Reportsfolder:
- Once you are done, click on Save.
Matrix report is the most complex report format. It allows us to summarize data in grid format. It allows records to be grouped by both columns and rows.