
In this recipe, we will explore the steps to enable debug tracing in AD FS 2.0. Debug tracing helps you troubleshoot the issues with AD FS 2.0 with an extended set of events that get recorded in the debug log.
To achieve troubleshooting in AD FS 2.0 with debug tracing, perform the following steps:
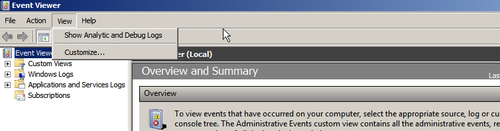
- In your Active Directory domain controller machine, open Event Viewer from Administrative Tools and click on the Show Analytic and Debug Logs option under the View menu, as shown in the following screenshot:
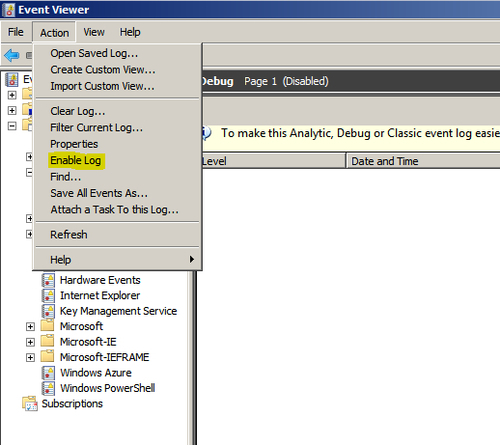
- Expand the Applications and Services Logs node and select Debug under the AD FS 2.0 Tracing folder. Click on Enable Log from the Action menu, as shown in the following screenshot:
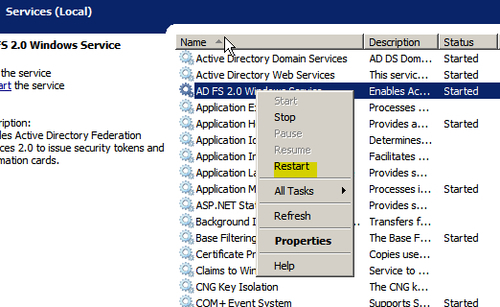
- Restart the AD FS 2.0 Windows Service by right-clicking on it and clicking on Restart, as shown in the following screenshot:
The AD FS 2.0 debug trace log is not enabled by default, due to the fact that it can grow quickly and consume large amounts of disk space.
The AD FS 2.0 debug trace log uses the Event Tracing for Windows (ETW) framework and verbose logging can be enabled using the Windows Event Utility command:
wevtutil sl "AD FS 2.0 Tracing/Debug" /l:5
You must restart AD FS 2.0 Windows Service every time you enable or disable AD FS 2.0 verbose debug trace.
Refer to AD FS 2.0 Troubleshooting Guide at http://technet.microsoft.com/en-us/library/ff641699(v=ws.10).aspx to learn more about the different troubleshooting scenarios in AD FS 2.0.