
Measuring light intensity – the photometer
A short explanation
A simple photometer circuit is shown in Figure 1, and is based on a device called a light-dependent resistor, or LDR. As its name tells us, its resistance depends upon the amount of light falling on it. In bright light, the resistance is relatively low (about 1 kΩ), whereas in the dark, its resistance is very high (up to 10 MΩ). The cell is made from a semiconducting substance known as cadmium sulphide (CdS), and is enclosed in a small plastic container. The semiconductor is laid on a flat insulating surface in the form of a small flat ribbon. The ribbon construction gives a good area of surface for a given length of ribbon, and the length of the ribbon is maximised by laying it out in a zig-zag pattern. In the dark, CdS is an insulator; when light falls on it, electrons are released inside the CdS, making it conduct. The more light there is, the more electrons there are, and the resistance falls.

The photometer circuit
The circuit is simply a series connection of four things – the battery, the LDR, a variable resistor and a meter. A switch is also provided. The combination of the LDR resistance and that of VR1 determines the current flowing, which is indicated on the meter. Altering the resistance of VR1 sets the sensitivity of the photometer – you may want full-scale deflection of the meter needle for a bright light, or for a dim light.
It is simple to make, and a plug-in type matrix board is ideal to test the circuit, so that you can decide if you want to make a permanent version. Connect all the components in series; the only change you may want to make is the connection to VR1. If you find that the sensitivity control seems to work ‘backwards’, simply unsolder the wire from the end tag of VR1 and solder it to the opposite end tag. Problem solved!
In use
As soon as you connect up the battery, you will probably have a meter reading because of the daylight falling on the LDR. Shading it with your hand should reduce the reading. If the meter needle is hard over against the end-stop, turn VR1 until it indicates about half-scale. The LDR is very sensitive, and will read zero only in a dark room. If you put on a torch to see what the meter reading is, the LDR will detect the torch light, and will give a reading!
Here is a simple project where you can use the photometer in an experiment which has an analogy in radio. Draw a circle on a large (A3 or bigger) sheet of paper and divide it up into 30-degree sectors, as shown in Figure 2. Draw a series of smaller circles which divide the maximum radius into five. Look at the figure if you’re not sure about this. Bring the LDR away from the circuit by using two long, flexible wires. The experiment must be performed in a darkened room (preferably in total darkness). Prepare a table with two columns, the left-hand one headed ‘Angle (degrees)’ and the right-hand one ‘Meter reading’. Fill in the left-hand column 0, 30, 60 … and so on up to 360°.
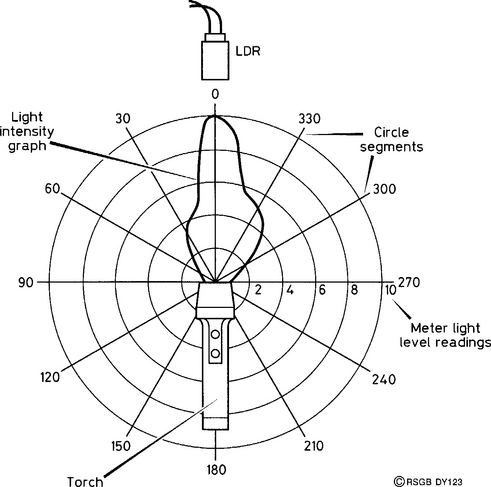
Place the torch in the position shown, with its lens at the centre of the circle and pointing along the 0° line; switch it on. Place the LDR facing the torch and adjust VR1 until you have full-scale deflection of the meter needle. Suppose the meter indicates 10 units at this point. Enter this into your table in the 0° row. Keeping the torch the same distance from the circle centre, and pointing at it, move the LDR round all 30° positions and record the meter readings. Switch off the torch and take the sheet of paper and your tabulated results into daylight!
Lay the large sheet of paper on a table with your results beside it; then, at each 30° interval, plot the point along the radius corresponding to the meter reading. Then, join up all the points and you have what is called a polar diagram of light intensity. The use of the word ‘polar’ implies that the readings have been taken in a circle and plotted that way.
Light waves and radio waves are both examples of electromagnetic radiation. The torch is designed to ‘beam’ its radiation in a particular direction, just like an aerial does. Hence the use of the word ‘beam’ for a directional aerial. If a similar polar diagram is drawn for a Yagi-type aerial, it will show the same general characteristics as does Figure 2, namely a main direction (or ‘lobe’) where most of the energy is concentrated, with evidence of sidelobes, indicated by ‘lumps’ on the otherwise smooth main lobe.
Also in this book you will find a project for the construction of a UHF field-strength meter, which you could use to carry out a measurement of the polar diagram of a UHF aerial.