
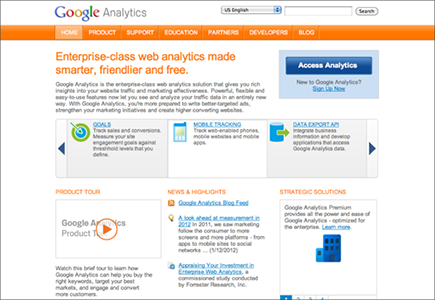
Figure 3-1: Google Analytics.
The Big Daddy: Google Analytics 101
Google Analytics (see Figure 3-1) is incredibly versatile, so much so that I could easily fill an entire book on its features and uses. However, because I don’t have room for that, I’ll stuff a single section full of key points to get you started quickly.
The first thing you need to know to use Google Analytics is that you need to have a Google account to do so. In fact, having a Google account isn’t a bad idea, anyway — it allows you access to a variety of free Google tools that will enhance your online experience. But for now, we’re focused on one: Google Analytics. The easiest way to get a Google account is to either set up a Gmail account (free) or a Google+ account (free).
 Google Analytics offers a lot of hidden features — features that can really improve your metrics-reading skill set. I can’t cover them all here, but did you know Google offers classes, too? Sign up to qualify for the Google Engage for Agencies program or one of their other free course series to get certified as a pro Googler! It helps you make your business better, and it looks great on your resume. Look for it in the help section of your Google Analytics account or AdWords account.
Installing Google Analytics
If you don’t already have Google Analytics working for you on your blog or site, you can quickly and easily install it. Installation takes only a minute and is completely painless.
The process is slightly different depending on whether you’re installing on your blog or your website. The next two sections provide the details.
First, grab your Google Analytics ID and write it somewhere. It’s easy to find. Just log into Google Analytics and from your dashboard and click the gears icon. You should see your ID next to your URL on the page that comes up. It’s the number that starts with UA-.
Installing Google Analytics onto your blog
WordPress is by far the most popular blog solution right now, and the most accessible (and free), so I focus on that. If you have a WordPress installation on your own hosted blog or site, a quick and simple plug-in does all the installation dirty work for you. To use it, simply do the following:
1. Log in to your WordPress blog.
2. In the left column of your dashboard, click Add Next next to the word Plugins heading.
3. In the Search For Plugins area of the new window that opens, type Google Analytics for WordPress.
4. In the search results, look for the plug-in authored by Joost de Valk.
5. Click the words Install Now below the plug-in title (Google Analytics for WordPress).
6. Confirm that you want to install the plug-in.
7. After the Installation indicator lets you know that you’re finished, click the words Activate Plugin.
8. Follow the instructions for setting up the plug-in.
You must enter your website Analytics ID (the number on the Google Analytics Dashboard that starts with a UA- next to your site URL).
You’re all set and ready to start crunching data from your WordPress blog!
If you’re already familiar with using an FTP program to upload files directly to the WordPress Plugins folder on your server for installation, you can skip these steps and go right to the source to download the plug-in file: www.google.com/analytics/apps/about?app_id=456001
. From there, you simply upload the files into the Wp-Content/Plugins folder on your FTP server. After that, the files will automatically appear in your WordPress dashboard under the Plugins menu on the left. Simply navigate to the plug-in and select the blue Activate This Plugin link.
Installing Google Analytics onto your (non-WordPress) website
If you don’t have a blog like WordPress, Joomla, or Drupal, but want Google Analytics on your website, you can make that happen with a simple cut and paste. Just follow these steps:
1. Open the HTML source code file for your website footer.
2. Separately, head over to your Google Analytics dashboard.
This is the same Google Analytics account you set up in Chapters 1 and 2, if you’ve worked through those chapters.
In the same window where you find your Google Analytics ID, you also find some JavaScript code.
3. Copy the JavaScript code in its entirety.
It looks like this:
<script type=”text/javascript”>
var _gaq = _gaq || [];
_gaq.push([‘_setAccount’, ‘UA-xxxxxx-xx’]);
_gaq.push([‘_trackPageview’]);
(function() {
var ga = document.createElement(‘script’); ga.type = ‘text/javascript’; ga.async = true;
ga.src = (‘https:’ == document.location.protocol ? ‘https://ssl’ : ‘http://www’) + ‘.google-analytics.com/ga.js’;
var s = document.getElementsByTagName(‘script’)[0]; s.parentNode.insertBefore(ga, s);
})();
</script>
Did you navigate away from the window that showed the code you need to copy over at Google Analytics? Don’t worry! You can get back to it. Log in to your Google Analytics dashboard. In the list of websites, find the one that you’re installing Analytics on and click the word Edit in blue to the right of that row. In the window that opens, click the words Check Status in the upper right. That brings the Paste This Code window back up for you.
4. In your text editor, paste the code you copied in Step 3 into your HTML, just before the </body>
tag.
5. Save and upload the new HTML file.
After you save and upload the file and check for tracking, Google Analytics begins gathering data for you to put to work.
After you install Google Analytics your analytics data will appear in your dashboard in about 48 hours. After you see data, the fun begins! You can check immediately to see whether the code is working, however, by logging back into your Analytics account and looking for the OK symbol to appear in the tracking area — upper right. If it isn’t working, you see an exclamation point inside a yellow triangle and should try again.
Using Google’s Analytics Overview
Your Overview in Google Analytics will become your home away from home for metrics on your website, Facebook, and many other tools and sites that offer ways to work with this versatile Google tool (see Figure 3-2). Your Overview is your gateway to all the data from the websites in which you’ve installed Google Analytics.
Figure 3-2: The Google Analytics Overview.
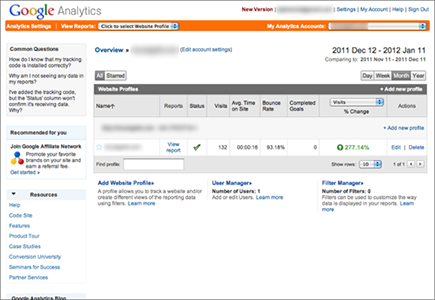
The sections of the Google Analytics Overview are as follows:
![]() Dashboard/Website Profiles: This is where you will find a list of all websites you’ve opened Analytics accounts for.
Dashboard/Website Profiles: This is where you will find a list of all websites you’ve opened Analytics accounts for.
I recommend only opening your own analytics on websites that are yours, and opening client analytics websites under their own account. At this time, account ownership can’t be transferred, so the owner of the website itself should be the owner of the website’s analytics account. Of course, if a person owns multiple websites, those websites should all be in that person’s Overview for one-stop maintenance.
![]() Name: This column holds the website URL and Google Analytics code in bold on the top line; the account installation link appears below it in regular type with a star next to it. The star simply gives you a way to “favorite” a site, just like you’d use it to mark things as favorites in other Google tools, like Gmail. Marking a site as a favorite is helpful if you own many websites and want to be able to sort them by most viewed.
Name: This column holds the website URL and Google Analytics code in bold on the top line; the account installation link appears below it in regular type with a star next to it. The star simply gives you a way to “favorite” a site, just like you’d use it to mark things as favorites in other Google tools, like Gmail. Marking a site as a favorite is helpful if you own many websites and want to be able to sort them by most viewed.
![]() Reports: Under this column, you will find the blue View Report link for each website. This link is how you access the actual data coming in for that site.
Reports: Under this column, you will find the blue View Report link for each website. This link is how you access the actual data coming in for that site.
![]() Status: A green check mark indicates that all is well with the analytics code running on that site. If you see a yellow triangle with an exclamation mark, you need to go into the settings for the site to figure out what is wrong or try replacing the code.
Status: A green check mark indicates that all is well with the analytics code running on that site. If you see a yellow triangle with an exclamation mark, you need to go into the settings for the site to figure out what is wrong or try replacing the code.
![]() Visits: This section reveals how many people have come to visit your site in a certain period, generally a week.
Visits: This section reveals how many people have come to visit your site in a certain period, generally a week.
![]() Avg. Time on Site: This area measures the average time a visitor spends on your site per visit and tells you the average time on site for all visitors during the time period. Sites that are sticky have longer visit times than the average website — they’re designed well, so people want to spend more time interacting with the site. That’s a good thing.
Avg. Time on Site: This area measures the average time a visitor spends on your site per visit and tells you the average time on site for all visitors during the time period. Sites that are sticky have longer visit times than the average website — they’re designed well, so people want to spend more time interacting with the site. That’s a good thing.
![]() Bounce Rate: This area simply measures how quickly someone who came to your site leaves without visiting any other pages than the one they clicked in on. The lower the percentage here, the better you’re doing at keeping folks interested in your site.
Bounce Rate: This area simply measures how quickly someone who came to your site leaves without visiting any other pages than the one they clicked in on. The lower the percentage here, the better you’re doing at keeping folks interested in your site.
![]() Completed Goals: This area requires going in to your site reports by clicking View Reports and setting goals to track different landing pages and campaigns. A site with no goals set for that time period will show 0 here.
Completed Goals: This area requires going in to your site reports by clicking View Reports and setting goals to track different landing pages and campaigns. A site with no goals set for that time period will show 0 here.
![]() % Change: This quick snapshot tells you whether you’re improving in any one of the previous four columns over the time period. A significant increase would merit a day-by-day look at the site to see what encouraged the improvement, and a significant drop might warrant some troubleshooting.
% Change: This quick snapshot tells you whether you’re improving in any one of the previous four columns over the time period. A significant increase would merit a day-by-day look at the site to see what encouraged the improvement, and a significant drop might warrant some troubleshooting.
![]() Actions: This column allows you to add new profiles for each site, edit the analytics for the site, or delete the site.
Actions: This column allows you to add new profiles for each site, edit the analytics for the site, or delete the site.
Digging into the dashboard
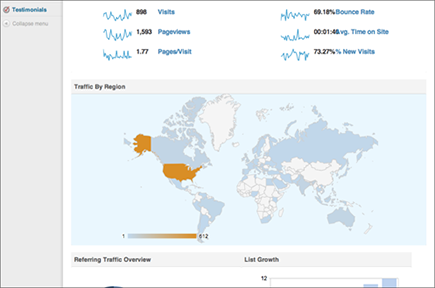
Clicking the blue View Reports link in your Overview takes you to your site’s dashboard, where you can drill down through your content, backlinks, visitor data, referring sites, and entry and exit page data, among other things. It also is the place where you’ll set goals and campaigns and work with real time stats (see Figure 3-3).
When you first access your dashboard, assuming Analytics has been gathering data on your site for at least a week or so, you will see a wavy line graph. This graph represents your overall visits for the time period. Most days, you can ignore this graph — unless you see a significant dip or spike. When that happens, you should investigate so that you can find out how to adjust your site or blog to fix the issue (or to do more of whatever it was that piqued folks’ interest).
Many of the features of Google Analytics are straightforward and will become clear with trial and error. A few of these features are worth discussing in the following sections, however, because they are building blocks to some of the more advanced stuff later on.
Figure 3-3: A WordPress dashboard.
Bounce rate
Bounce rate is the percentage of visitors who left your site after arriving at your entrance (landing) page (see Figure 3-4). A high bounce rate percentage isn’t necessarily bad — it depends on your website and your intentions with that site. Say, for example, that you want people visiting your site to immediately perform a call to action, such as calling your toll-free telephone number. If most people are actually making that call, you’d end up with a high bounce number. However, because you’re getting those calls, the bounce number is irrelevant — you’re seeing a return on your call to action as you intended.
On the other hand, if you want folks to mosey around your site and look at many pages, you want your bounce rate to be low. (The Average Time On Site metric contributes to this reading also.) If you aren’t getting the results on your site goals that you intended, you can use this metric (and the Average Time On Site metric) to monitor how well your adjustments work.
If you click through to Content / Site Content / Pages on the dashboard, you will see which pages on your site are leading the pack in page views. You can also sort these pages by Bounce Rate — just by clicking on the Bounce Rate column. Does a popular page have a high bounce rate? If so, why? Is it because folks are satisfied with what they found there and took action, such as calling a toll-free number? Then you don’t need to do a thing. If not, and if you’d prefer that visitors stay and browse around awhile, you’ll want to do more digging and adjust your content based on what you find.
Bounce rate can also indicate how pages are performing for your sales funnel. If the page is designed to move people to a sales page or a sales process, a low bounce rate is an indicator that the page is doing its job. Check your sales figures to be sure. In fact, if the page is doing its job and you have low sales, your bounce rate tells you that your sales copy or some other aspect may need improvement.
Traffic Sources
Traffic Sources is one of my favorite Google Analytics metrics. In fact, while different metrics are important to different people for very different reasons, I love seeing where my traffic is coming from!
This metric does two things:
![]() It tells me where my biggest fans or my biggest returns on content investment are — something key to know in social media.
It tells me where my biggest fans or my biggest returns on content investment are — something key to know in social media.
![]() It tells me how relevant my site is in search results.
It tells me how relevant my site is in search results.
The All Traffic metric in Traffic Sources gives us a great snapshot of our best referrers. Frequent referrals from a site coupled with a low bounce rate means you have connected with the right influencer or influencing site for the goal you are trying to achieve with that page. Good job!
Traffic Sources also tells you what type of visitor the sources send over. If Facebook sends a lot of referrals but has a high bounce rate, perhaps you can either pull back on your Facebook efforts or adjust them to go to another page. Or perhaps you can even change the landing page content to make it more sticky (the landing page is the page you link to on other sites that you want visitors from that site to land on).
Use a different landing page for different visitors or traffic sources. The contacts you make on Twitter are very different than the contacts you make on Facebook or LinkedIn or even via Google Search. Don’t overlook “snackable” content shared to discovery sites like StumbleUpon.com either — very easy to make share-worthy landing pages peppered with humor or interest items.
Keywords
Click Search / Organic in the Traffic Sources section, and you will find Keywords. Keywords are the meat and potatoes of good blogging. Writing keyword-rich content that sounds natural isn’t easy, but the Keyword tracker in Google Analytics can help you get better at it. Even if you’re not a blogger, the Keywords tracking feature in Google Analytics tells you which words are driving the most folks to your site. More importantly, by tracking keywords along with the Bounce Rate, Average Time on Site, and the Traffic Source metrics, you can identify which visitors leave your site frustrated and change those Landing Pages to help them better.
Figure 3-4: Tracking your bounce rate.

Segmentation
The Segmentation metric helps you answer the secondary questions that crop up as you get the basic questions answered through metrics. Analytics can tell you how many visitors came to your site, but segmentation answers the follow-up questions of “How many were from the United States?” or “How many of the visitors from the United States used a Macintosh running Safari to browse the site?”
Campaigns
Click through to Traffic Sources / Incoming Sources / Campaigns to get to your Campaigns information. Campaigns are how the metrics gurus always know so precisely how folks are getting to the site. By attaching different campaign parameters to different banner ads or other calls to action on your site via links, you can create a trackable link (these are a mile long, by the way). If you then shrink down the link with your favorite URL shortener (see Chapter 7) and share this link on sites like Twitter, Facebook, and LinkedIn — sites that are normally hard to track — you can discover the smallest details of who gets to your site from where and to what content. Pretty cool for a free service, isn’t it?
Campaigns are complex, and I am not going to take you to the deep end on this topic (Yet! I do in Chapter 14) but wanted to note it as one of the metrics in Google Analytics that you should pay attention to.
..................Content has been hidden....................
You can't read the all page of ebook, please click here login for view all page.