
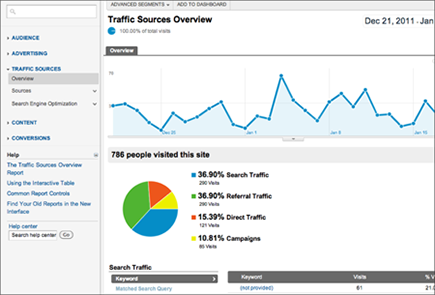
Figure 12-1: Traffic Sources Overview in Google Analytics.
Growing a Brand with Metrics
Metrics are excellent tools to build awareness of your brand and grow your business, working hard to give you the data you need to expand your reach. Not only are metrics good for growing the business profile, you can use them for other growth aspects, such as hiring new help.
One of the first places you should check in your analytics program is the overview of where your traffic is coming from. You can find this overview in Google Analytics as follows:
1. Log in to Google Analytics.
2. Select the domain you want to track.
3. Click the Standard Reporting tab.
4. In the left sidebar, click Traffic Sources.
5. Click Overview under Traffic Sources.
The Traffic Sources Overview, shown in Figure 12-1, appears.
6. Look for the pie chart and pay attention to the segments Search, Referral, Direct, and Campaigns.
Breaking down the pie
You can use this referral source data to see how well your various online marketing efforts are working. If most of your pie is Search, then you know your SEO is strong, and any AdWords campaigns and keyword pushes you’re running are strong. If more of your pie is Referral, then you know your social media and landing page campaigns are doing well.
If your pie is off kilter, you can see which areas you need to work on and know where to put your resources. This helps you make spending and time allotment decisions for your business. It also helps you assess your existing efforts.
If you have a strong e-mail campaign (yes, e-mail is social), then you’ll see good results in the Campaigns segment of the pie (formerly called Other). If this segment is weak, it’s one of the first things I’d recommend you work on — e-mail is often overlooked, and your e-mail list is one of the best ways to get and hold people’s attention through direct value-add campaigns and information sharing.
Getting into advanced segmentation
What quick analysis can you get from your metrics to help you make business decisions? You can get great intelligence on how well you’re reaching your target market.
Say that you need to run a campaign to sell widgets in Kansas. You can use advanced segmentation to create user-defined metrics reports on your campaigns and goals. Advanced segmentation can narrow your metrics down to location, technology used, landing page data, mobile versus web browsing, conversion rate, and more.
To get into the Advanced Segmentation menu and start customizing your metrics reporting, simply do these steps:
1. Log in to Google Analytics and click the domain you want to track.
2. In the Custom Reporting tab, click New Custom Report and then click Edit.
3. Define your metrics parameters to create your new, segmented metrics report.
 To ensure that you’re getting the most complete data, make sure that your landing pages and campaign keywords are in place before you set up advanced segmentation. Without these tracking mechanisms, you’ll get only surface level data that doesn’t help you make the deepest decisions possible. You can also select the Advanced Segments tab instead of (or after) you set your parameters in the Edit tab.
Creating a social media traffic report
You can create as many reports as you like, so instead of trying to cram all your data into one report, think of how you want to use the data and create reports that help you funnel what you learn into something useful.
Say that you want to set up an example of a useful advanced segmentation report in Google Analytics that focuses on social media traffic. This report would tell you how effective your social media efforts are. To set up an advanced segmentation report:
1. Inside Google Analytics, click the New Custom Segment button under Advanced Segments.
2. Name your new segment.
Something like Social Media Traffic is good because it helps you remember what you’ll be gathering data on.
3. In the drop-down menus, create Includes for each network by selecting Include.
4. Next to Include, select Source from the drop-down menu in green.
5. Add your source URL without the http://
.
For example, add plus.google.com.
6. Add an OR
statement so that your report catches all traffic from all sites.
If you were to add an AND statement between each site include line, you’d only get results that came from all sites simultaneously — not likely to happen!
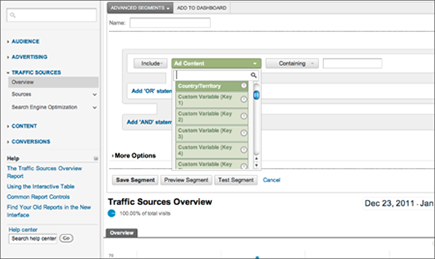
7. Repeat Steps 3, 4, and 5 for as many social network sites as you want to track (see Figure 12-2).
I recommended tracking Twitter, Facebook, Delicious, Plus, StumbleUpon, and Reddit.
8. Save your changes.
Figure 12-2: Adding your Includes to the advanced segmentation report.
What about other criteria? Location segments can be useful if you are looking to break into a new market or to test how you’re doing in your existing market.
To set up a location segment:
1. Inside Google Analytics, click the New Custom Segment button under Advanced Segments.
2. Name your new segment.
In the same section of your analytics dashboard, start a New Custom Segment.
3. In the drop-down menus, create Includes for each network by selecting Include.
Your first Include should be your country or territory if you want to track location.
You can also add additional conditions to the report.
Some conditions you may want to include are connection speed (if you’re looking for broadband saturation) and time on site (if you’ re judging stickiness in a new territory).
4. Test your segment.
5. Save your segment.
In the new Google Analytics, if you want to build layered reports, you need to add New Custom Segments each time and then come back to the Advanced Segments dashboard and apply them to the overall report. So, for example, to add to the Geolocation Report, you’d go back in and create the “time on site” condition, save it, and then apply it from the dashboard.
Looking at the Unique Visitors number
One of the more confusing numbers in the Analytics dashboard is the Unique Visitors number. It seems vague and mismatched, often reading as a different number on the front Dashboard page and under the Advanced Segmentation area. This number actually tells you quite a bit more than you’d think about your visitor patterns, however, and you can use the info to create even more detailed advanced segmentation reports. Say that your Unique Visitors count is 100 on the Dashboard page and 117 on the Advanced Segmentation pages (85 new and 32 returning).
The 85 Unique Visitors are folks who came to see your site and did not come back during the timeframe you’re searching. The other 32 came back to see your site again. (This is a good thing!) The difference in numbers is 32. (These are the folks who came back at least twice, so 85 + 32 = 117.)
If your numbers were still off, say 120 instead of 117 with 85 new and 32 returning, you could continue to drill down using simple math to find out which of those visitors came back still a third time. If your site is getting that many return visits and you’ve filtered your own IP out of the results, then you know your site is sticky.
If you’re only getting visitors that bounce away from your site never to return, you can use advanced segmentation to figure out where you might need to improve using time on site, entry pages, and other parameters. Over time, you can pinpoint and fix any trouble spots and even figure out where the next best place for you to grow your market is.
Tracking social sharing
Another metric to track while trying to grow a brand is social sharing. This data also circles back around through your Social Media Traffic report, giving you a snapshot of your site’s reach coming and going, so to speak.
The easiest way to track social sharing is via tools you place on your site and track the use of. An oldie but goodie example is the Tweet This button provided by the Twitter API, which tracks the reach of an article via tweets and trending data.
Things have come a long way since the Tweet This button first came out, though. Now there are plug-ins for WordPress like Social Metrics that take snapshots of where you’re being shared and how often. Used in tandem with Bit.ly or Awe.sm (link shorteners with analytics), these tools can do extensive tracking of where your content is shared. In fact, Social Metrics has some export to CSV features in its Pro version that you can add to those spreadsheets you’ve been using to track, sort, and learn from your data.
Combining KISSmetrics with Google Analytics
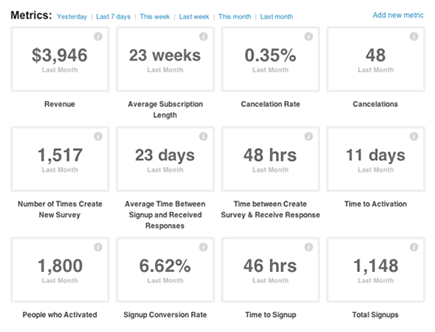
I talk a lot about Google Analytics because it’s both ubiquitous and free. KISSmetrics, shown in Figure 12-3, is one paid metrics solution that’s been out for a while and that is receiving high praise from icons in the online world. KISSmetrics is a paid solution, but an intriguing one with fairly reasonable price points.
Figure 12-3: A sample screen in KISSmetrics.
When you sign up for KISSmetrics, you notice several things:
![]() The setup time is less than 10 minutes if you know a little bit about how to work with your website.
The setup time is less than 10 minutes if you know a little bit about how to work with your website.
![]() KISSmetrics makes some sweeping claims about what you’ll learn about your business from their metrics in one week (and the claims aren’t far off).
KISSmetrics makes some sweeping claims about what you’ll learn about your business from their metrics in one week (and the claims aren’t far off).
![]() KISSmetrics provide all the code you need to implement each vertical and condition you want to track.
KISSmetrics provide all the code you need to implement each vertical and condition you want to track.
![]() Its metrics are people-centric; KISSmetrics remembers details about your visitors beyond page clicks and location.
Its metrics are people-centric; KISSmetrics remembers details about your visitors beyond page clicks and location.
Some of the many things KISSmetrics is designed to track include how people come to your site, which of your channels work the best to bring people that convert to your doorstep, what that conversion rate actually is, when people slip out of the sales funnel during signup or checkout, whether customers are being successful at learning and using your site (on-ramping or onboarding), which customers take advantage of your trial without buying, and which features of your site actually get used.
If you have the budget (starting at $29 per month after a 30-day free trial), KISSmetrics is one tool I’d recommend you experiment with in addition to Google Analytics to add that layer of people-tracking that Analytics lacks. In fact, Google Analytics is one of many services that KISSmetrics works well with via API integration, and the setup is simple.
When I say people tracking, I mean that you can tie in properties in KISSmetrics to a single visitor. For example, a new customer is a writer and used a 10 percent off coupon, found you on LinkedIn via your company page services link, and works for a Fortune 100. If you “tell” all of that information to KISSmetrics by associating properties with this customer, KISSmetrics will remember it. You can then use it to create advanced segments and data slices on your data.
..................Content has been hidden....................
You can't read the all page of ebook, please click here login for view all page.